CRT and Volume Profile

CRT + Volume Profile 

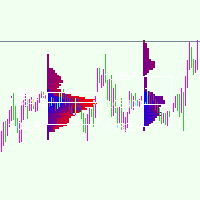
Candle Range Theory levels on several timeframes, filtered by the previous session's volume profile, with lower-timeframe entries (CISD / MSS) and strips of higher-timeframe candles drawn right of price. One indicator for the whole CRT workflow: where the range is, whether the sweep happened at a level that matters, and where the entry shift is.

HOW THE CRT MODEL IS DETECTED
- C1 is the range candle. Its high and low become CRT H and CRT L, with the 0.5 level between them.
- C2 is the trap candle. It sweeps one side of C1 and closes back inside the range, against the sweep, while opening and closing on the same side of the C1 midpoint.
- A bearish model (high swept) targets CRT L. A bullish model (low swept) targets CRT H.
- The lines start where the C1 high and low were actually made and stop when the target is reached or a candle closes beyond the swept level (model invalidated).

MULTI-TIMEFRAME CRT
- Up to three CRT timeframes at once (for example 1H, 4H and Daily). Each level is tagged with its timeframe.
- A timeframe below the chart timeframe is replaced by the chart timeframe.
- Optional marker on the swept wick of the trap candle.
- History mode: keep only the current model or keep past models on the chart.

PREVIOUS-SESSION VOLUME PROFILE
- Built from lower-timeframe bars for accuracy: M1 data up to M15 charts, M5 up to H1, M15 up to H4, H1 above.
- POC, value area high and low (70% of volume) and high-volume nodes (HVN).
- Profile period: Auto (daily up to H1, weekly on H4, monthly on D1), or fixed Daily, Weekly, Monthly, or a custom session in New York time (charts up to H1).
- Sessions start at 18:00 New York time, like the futures trading day.
- Solid or column style, one profile colour, HVN as lines, nodes or hidden, POC / VAH / VAL optionally extended right across the current session.

KEY-LEVEL FILTER
- When enabled, a CRT is drawn only if its swept level or its sweep wick lies within 10% of the CRT range from a previous-session key level.
- Key levels setting works as a strictness dial: POC only, POC + value area (default), or POC + value area + HVN.
- The filter always reads the last completed session, never the one still forming. Until one full session is available nothing is filtered.
- The CRT alert names the level the sweep landed on (for example "at Daily VAL").

LOWER-TIMEFRAME ENTRY: CISD / MSS
- Inside each CRT window the indicator marks the first structure break in the direction of the model.
- Confirmation: Body (CISD) - the break is confirmed by a close beyond the swing, line drawn at the swing body. Wick (MSS) - the break is confirmed by the high or low, line drawn at the wick.
- C3 tag: the break came after the trap candle closed. C2 tag: the break came while the trap candle was still forming (optional, can be turned off).
- Swing sensitivity adapts to the chart timeframe automatically or can be set manually.
- Auto timeframe pairing shows entries only on chart timeframes that suit each CRT model, for example a 1H CRT on 1m-3m, a 4H CRT up to 15m, a Daily CRT up to 1H. The CRT levels are drawn on every timeframe; only the entry marks are paired. Can be turned off.

FAIR VALUE GAPS ON THE BREAK LEG
- After a CISD / MSS, every fair value gap left by the impulse leg that broke structure is drawn, in the model direction only.
- A gap turns grey once price trades through it.
- Optional context mode: all other live gaps inside the model window, from the C2 open to the target or invalidation, in a muted colour.

HIGHER-TIMEFRAME CANDLE STRIPS
- Up to five strips of higher-timeframe candles (3 to 20 candles each) drawn to the right of price, so you can see how the model looks on the higher timeframe without switching charts.
- The latest CRT model is marked on the candles with H, L and 0.5 lines and the swept wick. Optional status label: active, target or invalid.
- Fair value gaps and volume imbalances on the strip candles.
- Candle times in New York time, broker server time or UTC, with weekdays on Daily strips.
- Optional countdown to the close of the newest candle in each strip.
- Optional fading of candles outside the model.

ALERTS
- CRT formed (bullish / bearish) with the timeframe and the key level of the sweep.
- CISD / MSS entry with the CRT timeframe.
- Popup with sound in the terminal and push notifications to the MetaTrader 5 mobile app.

OTHER
- Theme: Auto (follows the chart background), Dark or Light.
- Broker server time: auto-detected for GMT+2 / GMT+3 brokers with US or EU daylight saving, or set manually with a fixed offset.
- Number of history bars to calculate is adjustable.
- Works on any symbol and timeframe. The volume profile uses tick volume where real volume is not provided by the broker.

RECOMMENDED USE
1. Choose the CRT timeframes you trade (for example 1H and 4H) and keep the key-level filter on.
2. Wait for a CRT at a previous-session POC, VAH or VAL.
3. Drop to the paired lower timeframe and wait for the CISD / MSS in the model direction.
4. Use the FVG on the break leg as the entry area, CRT 0.5 and the opposite CRT line as targets.

The indicator is an analysis tool. It does not open trades and does not guarantee results. Always test on a demo account first.
Рекомендуем также
Smart SMC FVG
Ekkasawat Pitichalermroch
SMC + Volume Profile + FVG: Indicator Guide Overview SMC + Volume Profile + FVG is an all-in-one indicator for MetaTrader 5. It combines three popular price-action tools on a single chart: Smart Money Concepts (SMC): market structure (swings, BOS, CHoCH) and Order Blocks Fair Value Gaps (FVG): price imbalances left behind by fast moves Volume Profile: where the most trading happened, shown as POC, Value Area High and Value Area Low Everything is drawn automatically. You can turn each part on or
Master Edition — это профессиональный аналитический инструмент, предназначенный для визуализации структуры рынка через призму объема и денежного потока. В отличие от стандартных индикаторов объема, этот инструмент отображает Daily Volume Profile (Дневной Профиль Объема) прямо на вашем графике, позволяя видеть, где именно происходило открытие цены и где позиционируются «умные деньги». Эта версия Master Edition разработана для ясности и скорости, оснащенная уникальной системой Auto-Theme Sync, кот
Build a clear POC and value area from the chart range you choose. BrioQuant Range Volume Profile maps the selected MT5 volume feed across price and marks the POC, VAH and VAL. Profile the visible chart, a draggable fixed range, today or the latest number of bars, with configurable value-area shading and labels. Features: Modes: Visible Range, Fixed Range (drag two handles on the chart), Today, Last N Bars POC, configurable value-area percent, VA shading, price labels Instance tag lets two copies
Volume Delta Candles offer a straightforward way to analyze trading activity within each candle, making it easier to see what's happening without needing an extra volume indicator. This tool uses lower timeframe or real-time data to show the percentage of buying and selling volume within a candle as a colored bar. Make sure you understand Volume and Volume Delta before jumping in. If you’re not sure, reach out to me first for a quick rundown. But if you're already familiar, you're good to go! Ke
Poc volume honeyflow
Ali Abdalrasool Ai-sayyd Sobai
POC Highlighter - Volume Profile Indicator This indicator displays the Volume Profile and clearly marks the Point of Control (POC) with a prominent yellow horizontal line. The POC represents the price level with the highest traded volume within the visible chart range or selected period. Key Features: - Automatic calculation and display of Volume Profile histogram at the right side of the chart. - Highlights the POC level with a customizable yellow line (default: solid yellow). - Adjustable p
Here   our more valuable tools SMC Trend Trading   ,  Easy SMC Trading  ,  Institutional SMC Architect Volume Analysis Tools  ,  Volume flow Profile  ,  Market volume profile  , FVG with Volume  , Liquidity Heatmap Profile  ,  Volume Spread Analysis Deriv boom and crash index spike killer system you can use it only on m5 timeframe  follow the structure and get signal with alert on phone open trade set sl tp and enjoy easy analysis and trading made simple 
Brief Description The Balance Curve Dashboard is a sophisticated visual tool that transforms your trading history into an interactive, high-performance equity curve display directly on your MT5 chart. Unlike traditional balance lines that draw on the chart as standard objects, this indicator uses a custom Canvas-based rendering engine to create a crisp, anti-aliased, and fully customizable visual representation of your portfolio's performance. Key Features: Interactive Visual Dashboard · Ful
A Market Profile (time price opportunity) implementation with an option to mark a point of control (POC) based on   volume   . Config: Hide default candles. Select a session time using exchange timezone. Experiment with tick multiplier value to achieve desired level of detail. Choose the symbols of your choice, e.g. squares or A-Z chars. For multiple sessions you will have to add additional instances of this script with a different time configuration. Limitations: TradingView has a hard limi
CRV Z-Score Engine is a professional market structure indicator that transforms raw price into normalized,  multi-horizon statistical structure model   It reveals: When price is statistically stretched When the market is transitioning between regimes When a move is structurally aligned across multiple horizons This is not a lagging oscillator . It is a multi-horizon statistical structure model built for serious traders. WHAT IS Z-SCORE? Z-Score measures how far price deviates from its n
Этот индикатор сделан на основе дискретного преобразования Хартли. Использование этого преобразования позволяет применять разные подходы при обработке финансовых временных рядов. Отличительная особенность этого индикатора - его показания относятся не к одной точке на графике, а ко всем точкам периода индикатора. При обработке временного ряда индикатор позволяет выделять различные элементы временного ряда. На этом подходе построен первая возможность фильтрации - просто отбрасываются все ненужные
Понимайте, где цена может искать ликвидность Liquidity Reaction Map MT5 — это индикатор рыночного анализа на графике, который определяет потенциальные области ликвидности на стороне покупателей и продавцов на основе подтвержденной ценовой структуры. Он объединяет свинговые точки, равные максимумы и минимумы, уровни предыдущего дня и недели, экстремумы торговых сессий и круглые цены в единую карту ликвидности. Близко расположенные уровни могут объединяться и ранжироваться по силе, расстоянию до ц
The  OBV MTF  is an Enterprise-grade On-Balance Volume indicator that transforms standard OBV into a complete trading system. It combines gradient-aware momentum analysis, divergence detection, multi-timeframe alignment, and dynamic customisable midpoint-filtering in a single intuitive professional volume analysis tool. Core Features 1. 5-State Momentum Engine Aqua (Strong Bullish) : OBV slope rising with positive acceleration SteelBlue (Weak Bullish) : OBV rising but losing momentum Gray (Neutr
Here   our more valuable tools SMC Trend Trading   ,  Easy SMC Trading  ,  Institutional SMC Architect Volume Analysis Tools  ,  Volume flow Profile  ,  Market volume profile  , FVG with Volume  , Liquidity Heatmap Profile  ,  Volume Spread Analysis The    Liquidity Heatmap   is a sophisticated institutional trading tool designed to reveal where over-leveraged traders are trapped. By calculating estimated liquidation levels based on volume spikes and leverage, this indicator draws a dynamic "h
An ICT fair value gap is a trading concept that identifies market imbalances based on a three-candle sequence. The middle candle has a large body while the adjacent candles have upper and lower wicks that do not overlap with the middle candle. This formation suggests that there is an imbalance where buying and selling powers are not equal. Settings Minimum size of FVG (pips) -> FVGs less than the indicated pips will be not be drawn Show touched FVGs Normal FVG color -> color of FVG that hasn't
FREE
Представляем RSIScalperPro - революционный индикатор на основе RSI для MetaTrader 5, специально разработанный для скальпинга на графике одной минуты. С RSIScalperPro у вас будет мощный инструментарий для точных сигналов входа и выхода, чтобы повысить вашу торговую эффективность. RSIScalperPro использует два различных индикатора RSI, которые предоставляют четкие сигналы для уровней перекупленности и перепроданности. Вы можете настроить временные периоды и ограничительные значения двух RSI в соот
X Sensors Pro — это профессиональный индикатор профиля объема, который визуализирует распределение торгового объема по ценовым уровням за выбранный период. Индикатор автоматически определяет локальные экстремумы (HH и LL), рассчитывает Point of Control (POC) — уровень с максимальным объемом, а также строит уровни поддержки и сопротивления на основе выявленного диапазона.   Основные возможности: ·                       Визуализация профиля объема в виде цветных гистограмм ·                      
Atlantis Pro Indicator — Точная тик-аналитика с портфельным подходом Atlantis Pro Indicator — это продвинутый многофункциональный инструмент, который использует реальные тиковые данные для выявления ключевых ценовых уровней и зон вероятных разворотов с высокой точностью. Постоянно анализируя каждый рыночный тик, Atlantis Pro фиксирует критические изменения покупательского и продавцового давления и моментально отображает чёткие стрелки Buy и Sell прямо на графике — видимые по умолчанию для быстр
Introduction This indicator detects volume spread patterns for buy and sell opportunity. The patterns include demand and supply patterns. You might use each pattern for trading. However, these patterns are best used to detect the demand zone (=accumulation area) and supply zone (=distribution area). Demand pattern indicates generally potential buying opportunity. Supply pattern indicates generally potential selling opportunity. These are the underlying patterns rather than direct price action. T
********************************************************************************************           ---VSA Supply and Demand--- This is a actually set of three indicators that form a unity for effective monitoring of the movement of smart money. They are based on the volume and basic patterns of the VSA methodology.   1.VSA.ex5 2.Volume Supply and Demand.ex5 3.Bars and Candles Supply and Demand.ex5  But here I offer you only the first indicator, which is called the VSA indicator with basi
Market Profile Osw MT5
William Oswaldo Mayorga Urduy
Руководство пользователя: Market Profile Osw Market Profile Osw — это продвинутый инструмент анализа аукциона, который позволяет визуализировать распределение объема и цены за определенный период. В отличие от обычных свечных графиков, эта система показывает, где происходила наибольшая торговая активность, позволяя выявить психологические зоны поддержки и сопротивления на основе реального участия рынка. 1. Руководство по параметрам (Меню настроек) Общие настройки Show Market Profile: Включает
Индикатор строит текущие котировки, которые можно сравнить с историческими и на этом основании сделать прогноз ценового движения. Индикатор имеет текстовое поле для быстрой навигации к нужной дате. Параметры : Symbol - выбор символа, который будет отображать индикатор; SymbolPeriod - выбор периода, с которого индикатор будет брать данные; IndicatorColor - цвет индикатора; Inverse - true переворачивает котировки, false - исходный вид; Далее идут настройки текстового поля, в которое можно ввес
LuoMo Volume & Price Structure 8.98 A multi-function chart indicator for   MetaTrader 4 and MetaTrader 5 , designed to display key volume, volatility, sentiment, and price-structure information directly on the main chart. Main Features Volume and price-based Support & Resistance Volume spike and exhaustion signals ATR volatility expansion alerts Volume Profile with HVN and LVN Bullish and bearish sentiment distribution Developing or fixed POC VAH and VAL levels Supply and Demand zones Volume-wei
Вот версия на русском языке, готовая для публикации в MQL5 Market: Volume Profile Multiple — Множественные профили объёма с буферами для алгоритмической торговли Устали строить Volume Profile блок за блоком, перерисовывая и пересчитывая его при каждой смене таймфрейма? Volume Profile Multiple автоматически строит на графике несколько последовательных профилей объёма, показывая, где реально находился институциональный интерес в каждом отрезке рынка — а не только в последнем видимом диапазоне. Что
Here   our more valuable tools SMC Trend Trading   ,  Easy SMC Trading  ,  Institutional SMC Architect Volume Analysis Tools  ,  Volume flow Profile  ,  Market volume profile  , FVG with Volume  , Liquidity Heatmap Profile  ,  Volume Spread Analysis Transform Your Trading with Intelligent Market Insights! The 2025 Spike Killer Dashboard is a powerful MQL5 indicator that combines cutting-edge signal generation with an intuitive crystal dashboard for real-time market analysis. Designed for tra
VWAP Z-Score (Rolling) Positive values indicate price trading above VWAP, while negative values indicate price trading below VWAP. Typical Use Cases Mean-reversion strategies Overbought / oversold detection VWAP-based statistical analysis Confirmation tool for discretionary or algorithmic trading Risk-aware trade entries and exits Notes Uses tick volume for VWAP weighting (standard for Forex symbols). The indicator does not repaint. Designed for analytical and decision-support purposes only.
Wat Machine
Watson Dyton Mulenga
WAT MACHINE — Product Description DOES NOT REPAINT. EVER. WAT MACHINE is a precision signal indicator for MetaTrader 5 that identifies high-probability turning points in the market and plots clean buy and sell arrows directly on your chart — exactly where price is most likely to reverse. No guessing. No repainting. No chasing. The signal is confirmed and locked in. What you see is what was there. HOW TO USE IT When an arrow appears, you have two options: Direct entry — enter at market on the nex
VWAP Indicator MT5
Kyra Nickaline Watson-gordon
Description : VWAP (Volume-Weighted Average Price) is the ratio of the value traded to total volume traded over a particular time horizon. It is a measure of the average price at which pair is traded over the trading horizon. Read More. All Symbols and All Timeframes are supported. Indicator Inputs :     VWAP Mode : Mode of VWAP Calculation. Options can be selected : Single,Session,Daily,Weekly,Monthly     Volumes : Real Volumes,Tick Volumes     Price Type : Used price for calculating. O
Многорежимный анализ объема: анализируйте объем по-своему, а не по алгоритму индикатора. Большинство индикаторов профиля объема ограничивают трейдеров заранее определенными диапазонами анализа. Но рынок не движется в рамках фиксированных шаблонов, так почему же ваш анализ должен двигаться в их рамках? Индикатор Volume Profile Multi-Mode предоставляет вам полную свободу выбора места, времени и способа анализа объема. Независимо от того, изучаете ли вы структуру рынка, составляете профилю торговые
BoxChart MT5
Evgeny Shevtsov
5 (7)
Рынок несправедлив, хотя бы потому, что всего лишь 10% игроков управляют 90% капитала. У рядового трейдера мало шансов, чтобы противостоять этим «хищникам». Но выход есть, необходимо всего лишь перейти на другую сторону, необходимо находиться в числе этих 10% «акул», научиться распознавать их намерения и двигаться вместе с ними. Объем - это единственный опережающий фактор, который безупречно работает на любом периоде и любом торговом инструменте. Сначала зарождается и накапливается объем, и толь
Here   our more valuable tools SMC Trend Trading   ,  Easy SMC Trading  ,  Institutional SMC Architect Volume Analysis Tools  ,  Volume flow Profile  ,  Market volume profile  , FVG with Volume  , Liquidity Heatmap Profile  ,  Volume Spread Analysis Spike Blaster Pro is a next-generation MT5 indicator designed specifically for synthetic markets. It works seamlessly on Boom Index and Weltrade Index , providing traders with sharp, reliable spike detection signals. What makes Spike Blaster Pro po
С этим продуктом покупают
Trend Sniper X
Sarvarbek Abduvoxobov
4.9 (41)
Trend Sniper X — это трендовый индикатор для MetaTrader 5, работающий на нескольких таймфреймах, который помогает трейдерам точно и ясно определять направление тренда и потенциальные точки разворота. для MT4: https://www.mql5.com/en/market/product/193245 Информация о цене: Текущая цена является промо-ценой и может измениться по мере выхода предстоящих обновлений и новых функций. Бонусное предложение: Чтобы получить БЕСПЛАТНЫЙ авто-трейд советник Assistant EA для этого индикатора, пожалуйста, на
Neuro Poseidon - новый индикатор от Дарьи Резуевой. Он сочетает точные торговые сигналы с адаптивными уровнями TP/SL , в результате создавая максимально выгодные сделки! TO SWITCH TO   ENG   PLEASE CHOOSE IT IN THE UPPER-RIGHT CORNER OF THE WEBSITE Напишите мне и получите  Neuro Poseidon Assistant  в подарок для автоматизации вашей торговли! Что отличает его от других индикаторов? 1. Доказанная прибыльность на всех активах и таймфреймах 2. На графике присутствуют только подтвержденные сигналы н
ARIPoint
Temirlan Kdyrkhan
1 (4)
ARIBot is a powerful trading companion designed to generate high-probability entry signals with dynamic TP/SL/DP levels based on volatility. Built-in performance tracking shows win/loss stats, PP1/PP2 hits, and success rates — all updated live. Key Features: Buy/Sell signals with adaptive volatility bands Real-time TP/SL/DP levels based on ATR Built-in MA Filter with optional ATR/StdDev volatility Performance stats panel (Success, Profit/Loss, PP1/PP2) Alerts via popup, sound, push, or email Cus
Привет, трейдер! Большинство розничных трейдеров полагаются на запаздывающие веб-скрипты. Для торговли с истинным преимуществом необходима институциональная архитектура. Индикатор Astro AI — это не стандартное наложение графика. Это скомпилированная нейронная сеть с двумя агентами, работающая непосредственно на вашем терминале. Вот точная технология, лежащая в основе системы: 1. Агент 1: Аналитик (Графовые нейронные сети — GNN) Рынки — это не просто изолированные ценовые бары; это взаимосвяз
Volatility Master for MetaTrader is a real-time dashboard tool that scans up to  50 symbols  to identify high-volatility , trending markets instantly. With bullish/bearish signals, customizable alerts, and a user-friendly interface, it helps you avoid range-bound conditions and focus on high-probability trades. Clarity leads to confidence. Trade confidently and protect your capital effectively with this powerful dashboard. We don't offer free or bonus indicators in exchange of reviews from you.
M1 Quantum MT5
Hamed Dehgani
4.2 (10)
Торговые сигналы в реальном времени с использованием M1 Quantum: Сигнал  (Сделка выполнена автоматически с помощью Quantum Trade Assistant , бесплатно включённого в этот продукт.) Последние новости : Выпущена версия 1.64. Теперь для всех сделок Stop Loss размещается за соответствующими зонами поддержки/сопротивления. Функция Smart Close также была улучшена для повышения производительности EA в этой версии. С 9 августа live-сигнал работает на версии 1.64. План цен: Текущая цена: $169 (Предложени
ICT PO3 (Power of 3) AMD Protocol Framework Indicator True Time & Structure Integration   |  Non-Repainting | Real-Time  | Multi-Asset  | MT4 Version Available Full Setup Guide & Strategy Playbook: https://www.mql5.com/en/blogs/post/768683 The ICT Power of Three (PO3): The Complete Guide to Accumulation, Manipulation, and Distribution https://www.mql5.com/en/blogs/post/771729 MT4 Version: https://www.mql5.com/en/market/product/171742 Indicator Overview The ICT PO3 AMD Protocol Framework i
Хватит действовать наугад. Знайте, когда входить, где выходить и в какую сторону склоняется рынок, всё на одном графике. RelicusRoad Pro собирает почти двадцать инструментов в один индикатор, а вы включаете те, которые подходят вашему стилю торговли. Чёткие входы. Чёткие выходы. План на каждом графике. Знакомо? Вы покупаете, а через минуту цена разворачивается против вас. Вы закрываете сделку слишком рано, а потом смотрите, как движение продолжается без вас. Пять индикаторов на графике, пять раз
Boba Analysis Suite Boba Analysis Suite — аналитический индикатор для MetaTrader 5. Он объединяет структуру рынка, значимые ценовые зоны и общий рыночный контекст в одном представлении на графике. Индикатор разработан на основе практического опыта трейдера и наставника по трейдингу. Он помогает выстроить последовательный процесс анализа: оценивать направление рынка, определять важные уровни и рассматривать несколько таймфреймов в совокупности. Анализ с учётом контекста Значение отдельных сигнало
CGE Trading Suite
Carl Gustav Johan Ekstrom
5 (2)
Institutional-Grade Analytics for MT5 The full analytical edge of a professional trading desk, built into your MT5 chart. Standard retail platforms lack the depth required for professional market analysis. The CGE Trading Suite bridges this gap, transforming MetaTrader 5 into a comprehensive workspace. By integrating 22 proprietary modules into a single, unified chart interface, the suite eliminates fragmented analysis. It provides definitive clarity across market structure, timing, momentum,
MANZANO FOOTPRINT ORDER FLOW Footprint, Order Flow and Volume Analysis for MetaTrader 5 Manzano Footprint Order Flow is an analytical indicator for MetaTrader 5 that brings together Footprint charts, Bid x Ask, Delta, Cumulative Delta (CVD), Imbalances, Volume Profile, VWAP, Market Depth and Time & Sales in an interactive environment. It allows traders to examine activity within individual candles, identify volume concentrations, compare buying and selling pressure, and analyse how market partic
Chimera Volume для MetaTrader 5 Продвинутый анализ объема и визуализация рыночной активности Chimera Volume — это пользовательский индикатор для MetaTrader 5, разработанный для анализа нормализованной активности объема и отображения изменений в рыночном участии через динамическую визуальную структуру. Индикатор обрабатывает данные тикового объема, используя алгоритмы адаптивной нормализации, и генерирует структурированное представление интенсивности объема, фаз накопления и сдвигов активности в
UZFX {SSS} Scalping Smart Signals v5.0 MT5 — это высокопроизводительный торговый индикатор без перерисовки, разработанный для скальперов, дейтрейдеров и свинг-трейдеров, которым требуются точные сигналы в режиме реального времени на быстро меняющихся рынках. Разработанный компанией (UZFX-LABS), этот индикатор сочетает в себе анализ ценового действия, подтверждение тренда и интеллектуальную фильтрацию для генерации высоковероятных сигналов на покупку и продажу, предупреждающих сигналов и возможно
Btmm state engine pro
Garry James Goodchild
5 (4)
BTMM State Engine Pro by G-Labs — Beat The Market Maker indicator for MetaTrader 5. Asian session range, London and New York kill zones, level progression (L1/L2/L3), peak formation detection (PFH/PFL), entry signals, and a multi-pair scanner from one chart. Stop scanning charts one pair at a time. The State Engine tracks the BTMM daily cycle automatically — Asian box, room boundaries, level blocks, peak formations, and filtered entries — while the scanner dashboard shows level, peak status, d
Ace Trend
Mikhail Sergeev
5 (3)
Представляем вам революционный индикатор, который меняет правила игры в мире трендовой торговли. Индикатор разработан для того, чтобы переосмыслить производительность и поднять ваш торговый опыт на беспрецедентную высоту. Наш индикатор может похвастаться уникальным сочетанием передовых функций, которые отличают его от конкурентов. Передовая технология "Real Pricing Factors" обеспечивает непревзойденную устойчивость даже в самых сложных и изменчивых рыночных условиях. Попрощайтесь с неустойчивыми
Cycles Plotter Индикатор настраиваемых циклов со скользящими средними и датой начала Cycles Plotter — это продвинутый технический индикатор, который строит два полностью настраиваемых синусоидальных цикла только на основе ввода пользователя. Он не генерирует циклы автоматически: все циклы рассчитываются исключительно на основе параметров, установленных пользователем, предоставляя трейдерам визуальный инструмент для изучения ценовых колебаний и потенциальных изменений тренда, без создания автомат
Mahra Pro Indicator MT5
Mahra Said Mohammed Al Kaabi
Mahra Pro Indicator MT5 Overview Mahra Pro is a MetaTrader 5 chart indicator designed to support structured analysis of XAUUSD (Gold). It combines trend, momentum, volatility and price-structure conditions to identify potential buy and sell setups and display them directly on the chart. The indicator does not open, modify or close trades. All trading decisions and order execution remain under the user's control. Main features • Buy and sell signal arrows on the chart. • Fast and slow EMA lines w
The Oracle Pro
Ottaviano De Cicco
5 (1)
The Oracle Pro: синтетический мульти-таймфрейм движок направленного смещения для MT5 ️ Летнее предложение к запуску — получите The Oracle Pro за 199 USD (для ранних покупателей). Цена растёт по мере спроса; финальная цена 399 USD. The Oracle Pro — это премиальный мульти-таймфрейм движок направленного смещения (bias) для MetaTrader 5, созданный для требовательных и профессиональных трейдеров. Он дисциплинированно отвечает на один вопрос: каково направленное смещение на каждом таймфрейме прямо се
IQ FX Gann Levels a precision trading indicator based on W.D. Gann’s square root methods . It plots real-time, non-repainting support and resistance levels to help traders confidently spot intraday and scalping opportunities with high accuracy. William Delbert Gann (W.D. Gann) was an exceptional market analyst, whose trading technique was based on a complex blend of mathematics, geometry, astrology, and ancient mathematics which proved to be extremely accurate. We don't offer free or bonus indic
Quant Direction — это инструмент трехмерного анализа рынка. Он обеспечивает полностью объективный, основанный на алгоритмах анализ рынка, одновременно вычисляя точные процентные отклонения по нескольким параметрам. Разработанный с использованием передовых инструментов моделирования на основе искусственного интеллекта и тщательно протестированный, алгоритм предназначен для интерпретации рынка с уникальной точностью. Он может анализировать любую валютную пару или финансовый инструмент на вашей пла
Azimuth Pro
Ottaviano De Cicco
5 (7)
Azimuth Pro V2: Синтетический фрактальный структурный анализ и подтверждённые входы для MT5 Обзор Azimuth Pro — многоуровневый индикатор свинговой структуры от Merkava Labs . Четыре вложенных уровня свингов, привязанный к свингам VWAP, определение ABC-паттернов, трёхтаймфреймная структурная фильтрация и подтверждённые входы на закрытой свече — один график, один рабочий процесс от микро-свингов до макро-циклов. Это не слепой сигнальный продукт. Это рабочий процесс, основанный на структуре, для т
First time on MetaTrader, introducing IQ Star Lines, an original Vedic Astrology Based Intraday Trading Indicator. We don't offer free or bonus indicators in exchange of reviews from you. You won't need any free products with this indicator to make it work. ;) Enjoy! Welcome to the new and updated  IQ Star Lines , the ultimate fusion of ancient planetary cycles and modern quantitative trading, published for the first time on Metatrader. This is an indicator built by the developer, who has spent
Precision Spike Detector
Francisco Mandomo Simbine
5 (2)
Precision Spike Detector V3 – Institutional-Grade AI Trading System Attention: The price increases by US$50 for every 10 purchases.  Final price: US$599 Precision Spike Detector V3   is a   state-of-the-art, institutional-grade market analysis system   for   MetaTrader 5 , designed to detect   high-probability market movements   in synthetic indices such as   Boom, Crash, GainX, and PainX . After purchase, send me a private message to receive the optimized configuration files,  the installation
PainX 400 FAKEOUT DETECTOR MT5 Custom Indicator  ·  Sell-Side Bias  ·  Scalping  ·  RSI(6) Filtered   OVERVIEW   The Spike Fakeout Detector is a non repaint precision technical indicator built exclusively for Crash / PainX synthetic indices on the platform. It is engineered around one of the most consistent and exploitable patterns on this instrument — the false breakout above resistance followed by a sharp price drop. Crash/PainX is a growing index that produces a significant price drop appr
Smart Market Structure Pro by G-Labs — ICT and Smart Money Concepts toolkit with built-in multi-symbol scanner for MetaTrader 5. Break of structure, change of character, order blocks, fair value gaps, liquidity sweeps, premium and discount zones, ICT sessions, confluence scoring, AI trade ideas, and a traffic-light scanner across up to 30 pairs and four timeframes from one chart. Map SMC and ICT on the active chart while the built-in scanner monitors your full watchlist. Each cell shows BUY, S
Turn every candle into a bid x ask footprint built from real tick data. See who is actually trading at each price, with delta, volume profile, imbalance zones and a scored setup engine that prints entry, stop and target Order Flow Footprint Chart Pro Most indicators tell you what price did. This one tells you who did it. Order Flow Footprint Chart Pro rebuilds every candle on your chart from raw tick data and shows you the volume that traded at each individual price inside it, split into the am

ARICoin is a powerful trading companion designed to generate high-probability entry signals with dynamic TP/SL/DP levels based on volatility. Built-in performance tracking shows win/loss stats, PP1/PP2 hits, and success rates all updated live. Key Features: Buy/Sell signals with adaptive volatility bands Real-time TP/SL/DP levels based on ATR Built-in MA Filter with optional ATR/StdDev volatility Performance stats panel (Success, Profit/Loss, PP1/PP2) Alerts via popup, sound, push, or email Cust

TPA True Price Action indicator reveals the true price action of the market makers through 100% non-repainting signals strictly at the close of a candle! TPA shows entries and re-entries, every time the bulls are definitely stronger than the bears and vice versa. Not to confuse with red/green candles. The shift of power gets confirmed at the earliest stage and is ONE exit strategy of several. There are available now two free parts of the TPA User Guide for our customers. The first "The Basics"
Quantum Momentum Guard (QMG) Advanced Breakout & Momentum Indicator for MetaTrader 5 Quantum Momentum Guard (QMG) is a next-generation MetaTrader 5 trading indicator designed to identify high-probability breakout opportunities using a powerful combination of advanced momentum analysis and high-level mathematical calculations . Unlike ordinary indicators that generate signals based on a single condition, QMG confirms every breakout with momentum strength and mathematical validation , ensuring
GEM Signal Pro GEM Signal Pro — это трендовый индикатор для MetaTrader 5, созданный для трейдеров, которым нужны более понятные сигналы, более структурированные торговые сетапы и более практичное управление рисками прямо на графике. Вместо того чтобы показывать только простую стрелку, GEM Signal Pro помогает представить всю торговую идею в более наглядной и удобной форме. Когда условия подтверждены, индикатор может отображать на графике цену входа, stop loss и цели take profit, помогая трейдеру
Другие продукты этого автора
CRT Pro is a complete Candle Range Theory toolkit for MetaTrader 5. It finds the CRT model on up to three timeframes and adds the tools needed to read it: higher-timeframe candles, structure shifts, fair value gaps, liquidity sweeps, a bias table and SSMT divergence. Every module can be switched on or off. 1. CRT Model A CRT model is built from two candles of the chosen CRT timeframe. C1 is the range candle. C2 is the sweep candle: it takes the high or the low of C1 and closes back inside the
CRT MTF is a multi-timeframe Candle Range Theory indicator for MetaTrader 5. It finds the CRT model on up to two higher timeframes, draws its range on the chart you trade and shows the higher-timeframe candles next to the price. 1. CRT Model A CRT model is built from two candles of the chosen timeframe. The first is the range candle. The second is the trap candle: it takes one side of the range candle and closes back inside the range. - Bearish CRT: the trap candle trades above the high of t
FREE
CRT + Daily Bias – Milana Trades A clean tool for Candle Range Theory (CRT). It marks the CRT range on your chart and shows the daily and weekly bias in one small table. WHAT IS CRT One candle sets a range: its high and its low. The next candle takes out one side of that range and closes back inside. This is the sweep. After the sweep, the opposite side of the range becomes the target. WHAT THE INDICATOR DRAWS - CRT H and CRT L – the high and low of the range candle. - 0.5 – the middle of th
FREE
Key Liquidity Levels and Confirmation shows where liquidity is resting on the chart and marks the moment it is taken. It combines three steps of one trading idea in a single tool: the key level, the sweep of that level, and the confirmation that follows. KEY LEVELS - Asia, London and New York session highs and lows - Previous day high and low (PDH / PDL) - Previous week high and low (PWH / PWL) - Previous month high and low - All-time high and all-time low Levels that share the same price are
FREE
MSNR is a Malaysian SNR indicator for MetaTrader 5. It finds support and resistance levels from candle bodies on D1, H4 and H1, shows which of them are fresh, and adds a dashboard with the current session and the storyline. 1. A and V Levels Levels are taken from candle bodies, the same points that form peaks and valleys on a line chart. - A shape (resistance): a bullish candle followed by a bearish one. The level is the higher of the first close and the second open. - V shape (support): a b
FREE
SMT + PSP/PCP MTF compares your chart with correlated instruments and highlights where their behavior diverges What it shows SMT divergence. The indicator draws lines between swing highs or lows where one asset takes liquidity and the correlated asset does not. Bullish and bearish lines have separate colors, styles and widths. PSP / PCP signals. The indicator marks candles where the correlated assets diverge at swing points. You can use text labels, candle coloring (aqua for bullish, orange for
FREE
MSS Levels HTF - Milana Trades Higher-timeframe Market Structure Shift levels that turn into Support / Resistance and Mirror levels as price interacts with them. THE IDEA When price breaks a swing high or swing low on a higher timeframe, that swing becomes an important reference level. The indicator marks it, then follows how price reacts to it: first touch, retest, and finally a flip to the other side. Everything is drawn on your current chart, so you can work on a lower timeframe, while the
FREE
Swings · Milana Trades Swings shows the most recent swing highs and swing lows on your chart without clutter. Each swing gets a small dot at the extreme and a short dotted line to the right, so you can see key levels and the structure of the move at a glance. How to read it Blue dot and line: the swing is higher than the previous swing of its kind. A higher high or a higher low is a rising structure. Grey dot and line: the swing is lower than the previous swing of its kind. A lower high or a low
FREE
Average Range Projection (ADR / AWR / AMR) – Milana Trades This indicator shows how far price can still move today, this week or this month, based on its average range. THE IDEA Every market has a normal size of a day. If the market usually moves 100 points a day and the low of the day is already in, the high of the day is likely to be about 100 points above that low. The indicator draws this for you. WHAT MAKES IT DIFFERENT Most ADR tools draw fixed levels from the open. This indicator uses
FREE
Фильтр:
Нет отзывов
Ответ на отзыв