Manzano SMC Institutional Pro
- Индикаторы
-
Patricia Manzano Gomez
 Founder of Manzano Trading | Algorithmic Trading Developer | Quantitative Research & Financial Technology
I am the founder of Manzano Trading, a company specializing in the development of professional trading software, algorithmic systems, and advanced financial market analysis tools. - Версия: 1.12
- Активации: 5
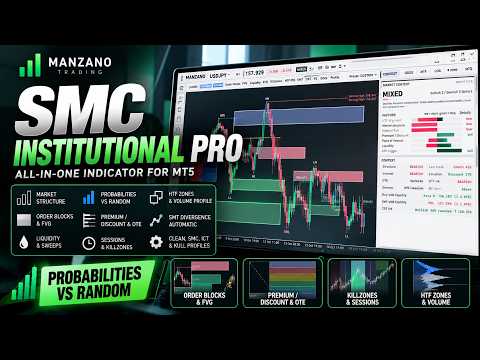
Smart Money Concepts, ICT, historical statistics, market structure and liquidity analysis for MetaTrader 5.
Any SMC indicator can draw zones. Manzano SMC Institutional Pro measures how those zones have performed in your market and compares their results against randomly selected price levels.
See the structure. Examine the historical evidence. Understand the market context.
Manzano SMC Institutional Pro combines Smart Money Concepts (SMC), ICT methodology, Market Structure, Order Blocks, Fair Value Gaps, Liquidity Sweeps, SMT Divergence and Multi-Timeframe analysis in a single interactive platform.
Its key difference is that it goes beyond identifying patterns. It provides historical statistics showing how specific setups have behaved on the current instrument, together with a market context system based on seven technical factors.
ODDS — Historical Statistics Compared Against Random Levels
Not all Order Blocks or Fair Value Gaps behave the same way. The ODDS module measures their historical performance using data from the current symbol and compares the results against random reference levels.
ATR-Based Zone Statistics
For each zone type — Order Blocks, Fair Value Gaps (FVG), Inversion Fair Value Gaps (IFVG) and Breaker Blocks — the indicator examines historical price interactions and evaluates what happened after price touched the zone.
The test measures:
-
How often price moved 1 ATR in the favorable direction.
-
Whether that move occurred before price traveled 1 ATR in the opposite direction.
-
The historical frequency with which this condition was met.
The test is symmetric: 1 ATR favorable versus 1 ATR adverse, using equal distances in both directions.
Comparison Against Random Levels
The system repeats the analysis using randomly selected price levels on the same chart under comparable conditions.
-
If identified zones clearly outperform random reference levels, the comparison reveals a measurable historical advantage.
-
If their behavior is similar to random levels, the results show that as well.
-
Unfavorable results are neither hidden nor replaced with optimistic estimates.
The historical percentage appears directly on each zone label, while the ODDS tab provides additional details.
Historical Retracement Depth
The module analyzes how far price has historically retraced before establishing a new extreme.
The following levels are included:
-
50%
-
61.8%
-
70.5%
-
78.6%
-
100%
Historical Liquidity Target Probabilities
ODDS calculates how frequently price has reached specific liquidity levels before the end of the corresponding trading day or week:
-
Previous Day High (PDH).
-
Previous Day Low (PDL).
-
Previous Week High (PWH).
-
Previous Week Low (PWL).
The calculation selects comparable historical situations based on the same time of day, levels that had not yet been reached, and similar distances expressed in average trading ranges.
Nearby Zones and SMT Divergence
The ODDS tab also displays the zones closest to the current price, together with the historical frequency of favorable outcomes for that type of zone visit.
SMT Divergence includes its own historical statistical analysis, comparing observed results against random references.
ODDS values represent frequencies measured from available historical data, not predictions of future market behavior.
MARKET CONTEXT — Seven Alignment Factors
The dashboard describes the current market environment using three states:
BULLISH | BEARISH | MIXED
Instead of assigning a conventional score, it shows how many of seven technical factors are aligned in the same direction.
For example: Bullish 5/7.
The seven factors are:
-
Higher-timeframe alignment.
-
Main market structure.
-
Internal flow or internal market structure.
-
Premium/Discount position.
-
Nearby Points of Interest (POI).
-
Liquidity.
-
Candle Range Theory (CRT) model.
Each factor has a green bar for the buying side or a red bar for the selling side.
The dashboard highlights agreement and disagreement between technical conditions. It describes the market context rather than generating automatic entry signals.
MARKET STRUCTURE — BOS, CHoCH and Price Action
Identify main and internal market structure through:
-
Break of Structure (BOS).
-
Change of Character (CHoCH).
-
Main and internal structure.
-
Higher Highs (HH), Higher Lows (HL), Lower Highs (LH) and Lower Lows (LL).
-
Protected structural highs and lows.
-
Bullish and bearish structural continuations and transitions.
The indicator uses closed candles to confirm structures and prevent confirmed historical structural information from repainting.
ORDER BLOCKS, FVG AND BREAKER BLOCKS
Detection and visualization of key zones used in Smart Money Concepts and ICT:
-
Bullish and bearish Order Blocks.
-
Breaker Blocks.
-
Fair Value Gaps (FVG).
-
Inversion Fair Value Gaps (IFVG).
-
Consequent Encroachment (50%).
-
Zone boundaries and midpoint levels.
-
Historical ODDS percentages displayed directly on zone labels.
These zones are integrated with market structure, liquidity analysis and the historical statistics engine.
LIQUIDITY ANALYSIS
Identify important liquidity levels and events:
-
Buy-Side Liquidity (BSL).
-
Sell-Side Liquidity (SSL).
-
Equal Highs (EQH) and Equal Lows (EQL).
-
Liquidity Sweeps.
-
Previous Day High and Low.
-
Previous Week High and Low.
-
Previous Month High and Low.
-
Asian session highs and lows.
Liquidity Sweeps can be analyzed alongside BOS, CHoCH, Order Blocks and FVG to provide structural context for price movements.
ICT CONCEPTS — OTE, Killzones and Power of 3
The platform integrates several concepts from ICT methodology:
-
Premium, Discount and Equilibrium.
-
Optimal Trade Entry (OTE), including the 62%–79% retracement zone.
-
Fibonacci retracements and extensions with selectable range anchoring.
-
ICT Killzones.
-
London and New York trading sessions.
-
ICT Silver Bullet.
-
New Day Opening Gap (NDOG) and New Week Opening Gap (NWOG).
-
NDOG and NWOG 50% midpoint levels.
-
New York Midnight Open.
-
Weekly and monthly opening prices.
-
Candle Range Theory (CRT).
-
Turtle Soup.
-
Power of 3 (Power of Three).
Power of 3
The system displays the developing higher-timeframe candle to the right of the current price.
The visualization uses the New York opening price as a reference and projection, connecting current price action with the developing higher-timeframe candle.
SMT DIVERGENCE — Automatic Instrument Matching
The SMT module compares price structure between related instruments and supports both direct and inverse correlations.
It automatically recognizes different broker naming conventions, including:
-
US100, NAS100, USTEC and NDX.
-
GER40, DE40 and GDAXI.
-
US30, DJ30 and WS30.
-
Common suffixes such as .cash, .pro and m.
If no predefined matching instrument is found, the indicator searches Market Watch for the available symbol with the highest correlation.
SMT also includes historical statistics compared against random references within the ODDS module.
Its functionality depends on the broker providing the required symbols and historical price data.
MULTI-TIMEFRAME ANALYSIS
Analyze market structure and direction across up to six configurable timeframes.
The MTF dashboard displays:
-
Trend direction for each timeframe.
-
Latest structural break.
-
Premium/Discount position.
-
Higher-timeframe context.
-
Two higher-timeframe miniature charts.
-
Structural range and OTE zone for each miniature chart.
The two higher timeframes are selected automatically according to the active chart.
INTERACTIVE TRADING DASHBOARD
Manzano SMC Institutional Pro features an interactive interface that brings market information and analysis controls together in one workspace.
Interactive Top Bar
-
Symbol selector with search functionality, without leaving the chart.
-
Timeframe selector.
-
Current price and daily price change.
-
BULLISH, BEARISH or MIXED context label.
-
Direct access to the CONTEXT tab by clicking the label.
-
Trend arrows for up to six timeframes.
-
Active trading session.
-
Chart zoom and navigation buttons.
Layer Bar
A dedicated button for each module lets you instantly enable or disable individual analysis layers.
On-Chart Module Settings
A vertical icon bar on the left opens each module's settings directly on the chart, without opening the standard MetaTrader indicator properties window.
Five Dashboard Tabs
CONTEXT
-
BULLISH, BEARISH or MIXED market state.
-
Seven-factor alignment display.
-
Context details button.
-
Main and internal market structure.
-
Latest structural break.
-
Premium/Discount position expressed as a percentage.
-
OTE zone.
-
Higher-timeframe trend.
-
Active trading session.
-
Price position relative to New York Open.
-
Nearest liquidity above and below current price.
-
Current CRT status.
ODDS
-
Historical ATR-based zone statistics.
-
Comparison against random price levels.
-
Order Block, FVG, IFVG and Breaker Block frequencies.
-
Nearest zones and historical visit frequencies.
-
Historical retracement depth.
-
PDH, PDL, PWH and PWL target probabilities.
-
SMT Divergence statistics.
MTF
-
Trend, latest structural break and Premium/Discount position by timeframe.
-
Two automatically selected higher-timeframe miniature charts.
-
Higher-timeframe ranges and OTE zones.
LOG
-
Chronological record of technical events.
-
Clicking an event moves the chart directly to the corresponding candle.
INFO
-
Historical data status.
-
Broker server time.
-
New York time.
-
Active visual theme.
-
Settings reset controls.
PERFORMANCE AND NON-REPAINTING VISUALIZATION
The indicator uses a single canvas to render its visual elements, avoiding the creation of large numbers of independent chart objects.
This architecture supports responsive chart interaction even when multiple modules are active.
Confirmed analysis uses closed candles, so confirmed historical structures and events do not repaint.
ONE-CLICK PROFILES AND CUSTOMIZATION
Four profiles adapt the platform to different analysis workflows:
-
CLEAN: Market Structure and ODDS statistics.
-
SMC: Classic Smart Money Concepts modules.
-
ICT: ICT concepts, including Power of 3 and SMT Divergence.
-
FULL: All available modules.
Switch between profiles with a single click.
The indicator remembers its configuration between sessions and includes:
-
Light theme.
-
Dark theme.
-
One-click theme switching.
-
Multiple bullish and bearish color palettes.
-
Individual module visibility controls.
STATUS BAR AND ALERTS
The status bar displays:
-
Countdown to the current candle close.
-
New York time.
-
Active trading session.
-
Next ICT Killzone.
-
Historical data status.
-
Alert status.
Configurable alerts include:
-
BOS and CHoCH.
-
Liquidity Sweeps.
-
Interactions with Order Blocks and FVG.
-
Entry into OTE zones.
-
CRT events.
-
Market context changes.
Notifications are available through pop-up alerts, sound, push notifications and email, depending on the MetaTrader 5 terminal configuration.
VISIBLE RANGE VOLUME PROFILE
The indicator includes a Visible Range Volume Profile calculated from tick-volume data available in MetaTrader 5.
It displays an estimated distribution of market activity across price levels within the visible range.
It is not a real traded-volume Footprint and does not provide information about private institutional orders.
TECHNICAL INFORMATION
Platform: MetaTrader 5.
Type: Interactive technical analysis indicator.
Methodologies: Smart Money Concepts, ICT, Market Structure, Price Action and Liquidity Analysis.
Markets: Forex, indices, metals and other instruments available through the broker, subject to data availability.
Expert Advisor integration: The current version does not expose indicator buffers for direct access through CopyBuffer().
Trade execution: The indicator does not open, modify or close trades.
Data: Analysis uses price history and tick-volume information available in MetaTrader 5.
IMPORTANT NOTICE
Manzano SMC Institutional Pro is a technical analysis tool, not an automated trading system. It does not open, modify or close trades and does not guarantee trading results. Institutional analysis concepts are calculated from available price and tick-volume data, not private institutional orders.
Manzano SMC Institutional Pro — Market structure, historical evidence and technical context in one integrated MetaTrader 5 platform.
Developed by Manzano Trading, a Spanish company specializing in algorithmic trading and professional trading software development.