Manzano Volume Profile VWAP Levels

Manzano Volume Profile VWAP Levels

Professional futures traders read the market through volume: where the session VWAP sits, where value was built, which levels price has not revisited yet and who is really pushing, buyers or sellers. On platforms like Sierra Chart all of this sits on one chart. On MetaTrader 5 it usually means five or six separate indicators, each with its own style, that do not talk to each other.

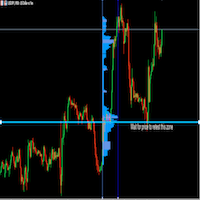
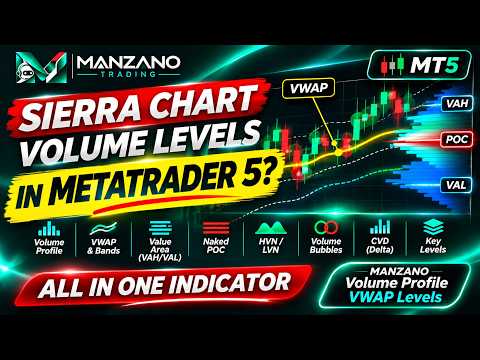
Manzano Volume Profile VWAP Levels brings that complete volume map to MT5 in a single indicator. It includes session, weekly and monthly VWAP with deviation bands; session and composite volume profiles; value areas of the day, week and month; naked POC bands; HVN and LVN zones; opening range and initial balance; tick-by-tick volume bubbles; and a session cumulative delta pane. All of it lives in one professional interface where every layer can be switched on or off with a click.

This is not a basic profile with a VWAP added on top. It is a complete workstation for reading value, acceptance and pressure, designed for intraday traders of indices, gold, FX and futures CFDs.

What you see at a glance

When you open a chart, the indicator answers the questions that matter before every trade:

  • Is price above or below the fair value of the day (VWAP), and how stretched is it in standard deviations?
  • Is price trading inside, above or below yesterday's value area?
  • Where are the high volume nodes that tend to attract and hold price, and the low volume areas price tends to cross quickly?
  • Which POCs from previous sessions are still untouched?
  • Where are the overnight range, the opening range and the initial balance?
  • Are aggressive buyers or aggressive sellers in control of the session right now?

The top bar shows this context permanently with three chips: price position in VWAP deviations, position against the previous value area, and today's volume compared with the average of the last sessions.

Session VWAP with deviation bands

The session VWAP is the volume weighted average price of the day: the reference institutions use to judge whether they are buying expensive or cheap. It is drawn with up to three standard deviation bands (1, 2 and 3 sigma), all of them volume weighted. When price reaches the second band it is statistically stretched, and these areas are often where moves slow down or rotate.

  • Anchor at the session start or at the cash open (for example 16:30 broker time for US indices)
  • Bands of 1, 2 and 3 deviations, each switchable
  • Line tags at the end of each curve (VWAP, SD1+, SD2-...) so the chart stays readable
  • Hover the VWAP to see its value, the sigma and where price sits in deviations

Weekly and monthly VWAP

The weekly VWAP starts with the first session of the week and shows the average price of the week, with an optional 1 deviation band. The monthly VWAP does the same for the month. Together they tell you whether the intraday move goes with or against the value of larger participants.

Volume profiles: session, composite and history

A volume profile shows how much was traded at each price. It is the clearest picture of where the market accepted value and where it rejected it.

  • Session profile: drawn next to the last bar and updated live, with today's POC, VAH and VAL
  • Composite profile: drawn on the right edge, covering the current week, the current month, the previous session or the last N sessions (2 to 20)
  • Value area (70% of the volume) highlighted and POC row marked in red
  • Heat colours: rows coloured by intensity, from blue (little volume) to red (heavy volume), so the nodes stand out immediately
  • Optional profile behind every past session, to see how value migrated day by day
  • Optional volume heatmap: each session's volume by price painted as heat stripes behind the candles
  • Automatic row size (based on the average daily range) with fine, normal, coarse and very coarse settings, or a fixed size in price
  • Adjustable composite width, with the profile placed next to the label column so it never covers the level tags

Value areas of day, week and month

The indicator draws the VAH, VAL and POC of five periods, each clearly labelled on the right edge:

  • Today (developing): VAH, VAL, POC
  • Previous session: PD VAH, PD VAL, PD POC
  • Current week: WK VAH, WK VAL, WK POC
  • Previous week: PW VAH, PW VAL, PW POC
  • Current month: M VAH, M VAL, M POC

Labels are stacked automatically so they never overlap. Opening inside, above or below yesterday's value, and accepting or rejecting the edges of value, are central ideas of auction market theory. Here they are visible without drawing a single line by hand.

Naked POC bands: the levels price has not revisited

The coloured horizontal bands are one of the most recognisable features of professional volume charts. They mark the POC of previous sessions that price has not traded back to (naked POCs). Many traders watch them as magnets and targets. Each band starts at its session, carries its date and disappears automatically as soon as price trades through it, so your chart only shows levels that are still open.

  • Naked POC bands, plus optional naked VAH and VAL bands
  • Number of recent sessions with bands, adjustable from 1 to 15
  • Hover a band to see its exact price and the session it comes from

HVN and LVN zones

From the composite profile the indicator extracts high volume nodes (HVN), areas of strong acceptance where price tends to slow down and rotate, and low volume nodes (LVN), thin areas price tends to travel through quickly. They are drawn as wide zones across the chart, with an adjustable number of zones of each type.

Lines or heat bands: your choice

Every level can be drawn as a classic line, as a heat band that glows in the centre and fades out, or as both at once. Heat bands give the chart the soft, layered look of professional order flow platforms and make the important levels stand out without visual noise.

Key intraday levels

  • Previous session high, low and close (PDH, PDL, PDC)
  • Overnight high and low before the cash open (ONH, ONL)
  • Opening range high and low (ORH, ORL), with configurable minutes
  • Initial balance high and low (IBH, IBL), with configurable minutes
  • Previous week high and low (PWH, PWL)
  • Session open and cash open

Levels that are still forming (opening range, initial balance) carry an asterisk until they are complete. Session start, cash open and cash close are set in broker time, so the indicator adapts to any broker and any market.

Tick-by-tick volume bubbles

The bubbles are calculated from real ticks with an aggressor engine, the same approach used in order flow footprints. For each bar the indicator finds the exact prices where volume concentrated and draws a bubble there, sized by volume and coloured by the aggressor imbalance at that price: green for aggressive buyers, red for aggressive sellers, neutral grey when both sides were balanced. Hovering a bubble shows its volume, the imbalance percentage, how many times larger it is than the average row, and the time.

  • Minimum size adjustable as a multiple of the average row volume
  • Volume printed inside the bubble, optional
  • On charts above H1, bubbles switch to bars with abnormal volume

Session cumulative delta (CVD) pane

At the bottom of the chart, a dedicated pane shows the cumulative delta of each session as candles: aggressive buying minus aggressive selling, reset at every session start. With one click it switches to the delta of each bar as a histogram, to compare the pressure of individual bars. The vertical scale of the price chart adjusts automatically so the pane never covers the candles.

  • Calculated tick by tick where ticks are available (bright colours)
  • Estimated from M1 bars outside the tick history (dimmed colours), so the source is always clear
  • Adjustable pane height, cumulative or per-bar mode, automatic candle scale on or off
  • Hover any bar to see its delta, the session total and the data source

Options levels

If you follow options positioning, you can add your call wall, put wall, gamma flip and three custom levels with your own names. Click PLACE and then click the chart, or type the prices in the inputs. They are drawn as purple tags and saved per symbol. MT5 does not provide options data, so these levels are entered by you from your own source.

Side dock with four tabs

  • Levels: the nearest levels above and below price, with their name, price and distance in ATR. You always know what is next in both directions.
  • Profile: a summary of the session. It shows today's POC, VAH and VAL, range and volume compared with their averages, session delta, profile shape (P, b or D), opening type (inside value, above or below value, out of range), initial balance compared with its average, the weekly and monthly value areas, and a plain-words reading of the context.
  • Log: the key events of the last sessions. These are initial balance and opening range breaks, closes beyond the previous VAH or VAL, returns inside the previous value, VWAP 2 sigma band touches and naked POCs being filled. Click an event and the chart jumps to that bar and highlights it.
  • Info: data used, number of sessions, row size, volume type, session times and calculation time, plus language, theme and reset buttons.

Interface designed for speed

  • Layers bar: nine layers (VWAP, weekly and monthly VWAP, profiles, value areas, bands, key levels, bubbles, options, CVD) switchable with one click
  • Presets: Sierra (everything), VWAP, Profile and Clean (levels only)
  • Left rail with an options panel for every layer, so nearly every setting can be changed without opening the inputs
  • Symbol selector with search (Market Watch or all symbols) and timeframe menu in the top bar
  • Price, daily change and context chips always visible
  • Hover cards with the details of every level, zone, profile and bubble
  • Built-in legend explaining every colour and mark
  • Status bar with bar countdown, broker time, number of levels, row size and volume type
  • Dark and light themes, nine bullish and bearish colour sets, three dock widths
  • English and Spanish interface
  • Settings saved automatically and restored the next time
  • Everything drawn on one canvas, without chart objects, so the object list stays clean and the chart stays responsive

Data and calculation

All calculations use your broker's own data. Profiles and VWAPs are built from M1 history (10 to 60 sessions, plus the current month and the previous week), using real volume when the broker provides it and tick volume otherwise. The tick engine for bubbles and CVD loads 1 to 5 sessions of ticks and works on charts up to H1. The indicator works on any symbol and timeframe. It is designed especially for intraday trading on M1 to M30 charts of indices, gold, FX and futures CFDs.

Input parameters

The inputs are grouped into clear blocks:

  • Language and appearance: language, theme, colour set, start-up preset, fonts, dock
  • Sessions: session start, cash open and close, opening range and initial balance minutes, sessions of history
  • Volume data: volume source, row size, tick engine and tick sessions
  • Layers: start-up state of the nine layers
  • VWAP, profiles, value areas and bands, key levels, bubbles and CVD: start-up options of each block
  • Options levels: prices and names of the manual levels
  • Colours: every element can be recoloured

Strategy Tester

The indicator runs in the visual Strategy Tester with the full interface. Use "Every tick based on real ticks" to see the tick-by-tick bubbles and CVD. Zoom and scrolling are done with the tester chart's own controls.

Who it is for

  • Intraday traders of indices, gold, FX and futures CFDs who work with VWAP, volume profile and auction market concepts
  • Traders coming from Sierra Chart, NinjaTrader or ATAS who want the same volume levels on MetaTrader 5
  • Discretionary traders who want context before every decision: value, acceptance, untouched levels and pressure

Important

Manzano Volume Profile VWAP Levels is a visual analysis tool. It does not generate trading signals, alerts or orders, and it does not promise any result: trading decisions remain yours. For questions or suggestions, contact me through MQL5 private messages.

Prodotti consigliati
Footprint Zones MT5 – Supply and Demand with Order Flow Analysis Footprint Zones is a MetaTrader 5 technical indicator designed to help traders study supply and demand areas, buying and selling activity, volume imbalance, price rejection and potential trading opportunities. The indicator combines price structure analysis with footprint calculations to provide additional information about market activity around important price levels. It identifies potential demand and supply zones, evaluates pri

The 4 headed dragon is an indicator that has two functions. 1) Set the background trend. 2) Mark the predominant trend. By combining these two indicator signals, we will be able to trade for or against the trend, adapting the signals to your reading of the market. You can download the demo and test it yourself. 1) Set the background trend.    Define four possibilities of trend that are the four heads of the dragon, marked by colors on the indicator, marking a) Powerful buying trend. b) Weak
With Fixed Range Volume Profile,The traces left by the big players will not go unnoticed by you. Professional   Volume Profile   Indicator reveals Institutional order flow. This advanced market indicator will teach you to spot the buying and selling. Dont want to say more because its well known by most professionals  trader. This Indicator : -  Quickly Identify the Strongest Institutional S/R Zones. - W orks with all Trading Instruments (Forex, Futures, Indexes, Commodities, Stocks, Cryptocurr
Smart Adaptive Trend Flow MT5 Professional adaptive trend, market structure, price levels and flow analysis indicator for MetaTrader 5. Would you like to test it before purchasing? You can request a fully functional trial version by sending us a private message through the MQL5 messaging system . This allows you to evaluate the indicator and all its features before making a purchase decision. A Complete Market View in a Single Chart Smart Adaptive Trend Flow MT5 has been developed to provide a
Fixed Volume Profile
Carlos Pascual Perez Maturano
This indicator, titled "Fixed Volume Profile.mq5", is a custom tool for MetaTrader 5 (MQL5) designed to calculate and display a Volume Profile over a user-defined fixed time range. The Volume Profile shows the distribution of trading volume at different price levels during a specific period, helping to identify areas of high activity (such as Points of Control or POCs) and volume-based support/resistance areas. Main Functionality: Interactive Range: The indicator creates two vertical lines on
FREE
Indicatore Crypto_Forex "HTF Bollinger Bands" per MT5. - Migliora i tuoi metodi di trading con l'indicatore professionale "HTF Bollinger Bands" per MT5. HTF significa "Higher Time Frame". - Le Bande di Bollinger sono uno dei migliori indicatori sul mercato, uno strumento perfetto per il trading. - Circa il 90% dell'andamento dei prezzi si verifica tra le due bande. - L'indicatore HTF Bollinger Bands è eccellente per i sistemi di trading multi-time frame con ingressi di Price Action o in combina
The indicator calculates ZigZag using the classic algorithm with three parameters: Depth, Deviation, and Backstep. Its main function is detecting and visualizing repaints — moments when the last ZigZag point shifts to a new bar. Upon loading, the indicator performs a simulation over the specified history depth. The algorithm sequentially recalculates ZigZag for each bar, comparing the current position of the last point with the previous one. If a shift is detected, a repaint line appears on the
FREE
Gold Signal Swing Pro XAUUSD with Auto TP SL — Sistema a 7 filtri + Garanzia RR per il trading swing su XAUUSD Nessun repaint. Nessun redraw. Nessun ritardo. Tutti i segnali sono bloccati dopo la conferma. Bonus per gli acquirenti: Ricevi AI Zone Radar (valore $59) + manuale PDF gratis con l'acquisto. Inviami un messaggio su MQL5 dopo l'acquisto. AI Zone Radar: https://www.mql5.com/en/market/product/175834 Versione MT4 anche disponibile: https://www.mql5.com/ja/market/product/177778?source=Site
Session Volume Profile Pro draws a horizontal volume histogram for each trading session and highlights the price levels where the market spent the most activity. It gives you the three key reference levels professional volume traders rely on: the Point of Control (POC), the Value Area High (VAH) and the Value Area Low (VAL). KEY FEATURES Point of Control (POC): the highest-activity price of the session, acting as a fair-value magnet. Value Area (default 70%, configurable): the price range contai
Killshot Spike Indicator
Hendrik Lodewyk Coetsee
The Killshot Spike Indicator is a premium, institutional-grade tool developed by Coetsee Digital, specifically engineered to catch violent algorithmic spikes. Crafted for traders focusing on Weltrade, Deriv, and SpaceMarkets synthetic indices, this indicator is optimized to operate on the 3-minute (M3) and 5-minute (M5) timeframes. Equipped with an intelligent Auto-Market Detection system, the indicator seamlessly adapts its algorithm based on the chart you apply it to. It supports Bullish-spiki
RSIScalperPro
PATRICK WENNING
Introducing RSIScalperPro - the revolutionary RSI-based indicator for Metatrader 5, specifically designed for scalping in the one-minute chart. With RSIScalperPro, you'll have a powerful toolkit for precise entry and exit signals to take your trading to the next level. RSIScalperPro utilizes two different RSI indicators that provide clear signals for overbought and oversold areas. You can customize the time periods and limit values of the two RSIs according to your preferences to achieve the be
Here   our more valuable tools SMC Trend Trading   ,  Easy SMC Trading  ,  Institutional SMC Architect Volume Analysis Tools  ,  Volume flow Profile  ,  Market volume profile  , FVG with Volume  , Liquidity Heatmap Profile  ,  Volume Spread Analysis The Trading Guide MT5 Indicator is a powerful psychological trading assistant designed to keep traders disciplined, focused, and emotionally balanced. This innovative indicator displays real-time motivational messages, trading rules, and analysis
FREE
CRV Z-Score Engine is a professional market structure indicator that transforms raw price into normalized,  multi-horizon statistical structure model   It reveals: When price is statistically stretched When the market is transitioning between regimes When a move is structurally aligned across multiple horizons This is not a lagging oscillator . It is a multi-horizon statistical structure model built for serious traders. WHAT IS Z-SCORE? Z-Score measures how far price deviates from its n
CRT + Volume Profile  Candle Range Theory levels on several timeframes, filtered by the previous session's volume profile, with lower-timeframe entries (CISD / MSS) and strips of higher-timeframe candles drawn right of price. One indicator for the whole CRT workflow: where the range is, whether the sweep happened at a level that matters, and where the entry shift is. HOW THE CRT MODEL IS DETECTED - C1 is the range candle. Its high and low become CRT H and CRT L, with the 0.5 level between the
NeuroTrend Dashboard – Advanced Multi-Asset Market Intelligence NeuroTrend Dashboard is a professional-grade technical analysis suite designed to provide a high-level, "bird’s-eye view" of market momentum across multiple symbols and timeframes simultaneously. By synthesizing complex proprietary momentum, real-time currency strength, and volume flow data, NeuroTrend distills the pulse of the market into a clean, actionable interface. Stop wasting time switching between individual chart windows. N
Ziva LSE System
Hassan Abdullah Hassan Al Balushi
ZIVA LSE System A Professional Liquidity & Structure Execution Framework Executive Overview ZIVA LSE System is a professionally engineered analytical framework designed to interpret market behavior through structural logic and liquidity dynamics. It is not positioned as a conventional indicator. Rather, it functions as a structured execution environment that organizes price action into a clear, disciplined decision-making model. The system is built to deliver consistency, clarity, and controlled
Title: Smart VP: Buy/Sell Bars + POC Description: Enhance your trading with the Right Anchored Volume Profile. Visualize buy and sell volumes per price level with near-bar numbers and identify the Point of Control (POC) instantly. Perfect for traders who want clear market structure at a glance. Features: Right Anchored Volume Profile Buy/Sell volume bars Near-bar volume numbers POC (Point of Control) line Customizable colors and display settings
ModGod Scalp Pullback - Precision Trend & Reversion Engine LAUNCH PROMOTION: Only $49 for the first 10 copies! The official price will be $490. Buy before the price goes up! The   ModGod Scalp Pullback   is an advanced, all-in-one indicator designed for professional scalpers and day traders. It combines the extreme smoothness of Triangular Moving Averages (TMA) with Heikin-Ashi trend filtering to provide highly accurate pullback entries and extreme exhaustion reversals. By mapping the natu
Volume Profile FREE — Multi-Session Heatmap (POC · VAH · VAL) See where trading activity actually occurs—not just where price moves. This indicator builds a clear, color-coded Volume Profile Heatmap directly on your chart and highlights the market's most important price levels: the Point of Control (POC) and the Value Area (VAH/VAL) , where price is most likely to react.
FREE
Emotions are a weakness. QHO mathematics is the future of your trading! You know what really truly frustrating?  Information garbage and noise. All those legacy, lagging indicators on the charts look like an attempt to steer a rocket ship with a steam engine. They are useless. They look at the past while the market is already flying forward on next-gen tech. We created QHO. This is not just another indicator. This is pure mathematics crushing market chaos right on your chart. Imagine completely
Narval
Adier Antonio Pereira
Narval identifica dove il prezzo viene “compresso” tra il macro e il micro. Fa ciò che nessun indicatore convenzionale fa: crea un campo di pressione che parte ampio nel passato e termina calibrato sulla candela attuale. Quando il prezzo entra in questo campo, perde forza. È proprio qui che Narval cerca il comportamento istituzionale che precede un’esplosione: il rifiuto e la trappola strutturale W/M. **Cosa vedi sul grafico:** **L'Institutional Check:** 3 linee che rappresentano l'accordo d
FREE
This Indicator adding power to traditional zigzag indicator. With High-Low numbers in vision it will be easier to estimate change of trend by knowing the depth of each wave. Information including points, pips, percentage%, and #bars can be displayed based on configuration. All information is real-time update. This indicator is especially useful in sideway market to buy low sell high.
The indicator colors the candles relative to their volume delta. The calculation of the candles delta is based on the tick history or on the deals tape history (see below for a description of the input variable "Volumes"). Coloring is performed by two parameters : by delta sign, as candle color, by delta value, as candle color contrast against chart window background color. In addition to coloring the candles, the indicator also displays the delta profile on the interval specified by the user
Astral Volume
Ottaviano De Cicco
Astral Volume Leggi il momentum ponderato per volume nel contesto. Offerta di lancio — $78 · Risparmia il 35% · $120 dopo il lancio. Un movimento locale intenso può apparire diverso su un timeframe superiore. Per chi affianca il volume al prezzo, Astral Volume riunisce la lettura locale e il quadro più ampio prima di valutare un cambio di direzione. Inquadra il movimento. Osserva il momentum ponderato per tick volume e confronta la sua intensità con la storia recente. Individua accordi e diverge
Sistema di tendenza per Oro, Bitcoin, Argento e Nasdaq: ingressi in breakout nella direzione del trend principale, stop che segue il prezzo, calcolatore di lotto e statistiche reali di ogni simbolo sul tuo storico. PREZZO DI LANCIO 39 USD – prossimo prezzo 49 USD. Dopo l'acquisto: guida PDF e aiuto personale per la configurazione. RGT Trend Rider – cavalca i grandi movimenti di Oro e Bitcoin Un piano chiaro sul grafico: dove entrare, dove si trova lo stop, quale lotto usare e come si sono compor
Horizontal Volumes Indicator - using a histogram, displays the volume of transactions at a certain price without reference to time. At the same time, the histogram appears directly in the terminal window, and each column of the volume is easily correlated with the quote value of the currency pair. The indicator practically does not require changing the settings, and if desired, any trader can figure them out. The volume of transactions is of great importance in exchange trading, usually an inc
NQX Deviation Return Calm
Marcel De Oliveira Farias
NQX Deviation Return Calm è un indicatore di segnali per MetaTrader 5: segnali di ritorno dalla deviazione (segnala solo in condizioni calme, quando la volatilità è sotto la sua media recente). Logica NQX proprietaria che rileva il prezzo che ritorna da una deviazione estrema. Segnala solo in condizioni calme, quando la volatilità è sotto la sua media recente. Disegna l'ingresso suggerito, uno stop corto e target ampi (3:1, 5:1, 10:1, fino a 20:1 in swing); decidi tu. Cosa disegna sul grafico -
See every hour against its own past Session Pulse measures how each hour of the week usually behaves. It reads the symbol's H1 history on your broker and builds a weekday by hour fingerprint, Monday to Friday, hour by hour. For each hour of each weekday it stores the usual range, the usual spread and how often that hour produced a spike. Then it puts the live market next to that fingerprint. Main features 1. Weekday by hour fingerprint. Monday 09:00 and Friday 09:00 are different hours, and S
SessionFlowMap — Profilo multi-sessione di volume e delta con livelli POC SessionFlowMap costruisce un profilo di volume e un profilo di delta (squilibrio tra acquisti e vendite) per le sessioni della giornata forex: Asia, Londra, New York e, facoltativamente, Sydney e una sessione personalizzata. Per ogni sessione individua il POC (Point of Control: il prezzo con il maggior volume scambiato) e la Value Area (VAH e VAL: l'intervallo che concentra la maggior parte del volume) e prolunga questi li
Market structures, Market balance, Range breakouts This tools helps to identify areas of market ranges, structures and plots colored boxes on breakout of those areas. User is given the option to receive alerts and notifications on the formation of the blocks. The tool has the ability to become an essential part of a technical trading system or even pure price action trading. Usage:- An essential tool for price action or technical traders.  More information in the blog
Gli utenti di questo prodotto hanno anche acquistato
Trend Sniper X
Sarvarbek Abduvoxobov
4.87 (46)
Trend Sniper X è un indicatore trend-following multi-timeframe per MetaTrader 5 che aiuta i trader a identificare la direzione del trend e i potenziali punti di inversione con chiarezza e precisione. per MT4: https://www.mql5.com/en/market/product/193245 Informazioni sul prezzo: Il prezzo attuale è promozionale ed è soggetto a modifiche con il rilascio di futuri aggiornamenti e nuove funzionalità. Offerta Bonus: Per ricevere GRATIS l'Auto-Trade Assistant EA per questo indicatore, invia un messa
Entry Points Pro è un indicatore per MT5 che non si ridisegna e vi mostra il prezzo di ingresso, lo stop loss, la dimensione del lotto e il rischio stimato in denaro prima di piazzare un ordine. Impostate il vostro deposito e il rischio per operazione. Il pannello calcola la dimensione del lotto al posto vostro. Nello screenshot, 4357.65 è il livello di ingresso in rottura, 4324.53 è lo stop e con 0.04 lotti il rischio stimato è di $132. Provatelo gratis nel tester di strategia di MT5. Seleziona
Gann Made Easy è un sistema di trading Forex professionale e facile da usare che si basa sui migliori principi del trading utilizzando la teoria di mr. WD Gann. L'indicatore fornisce segnali ACQUISTA e VENDI accurati, inclusi i livelli di Stop Loss e Take Profit. Puoi fare trading anche in movimento utilizzando le notifiche PUSH. CONTATTAMI DOPO L'ACQUISTO PER RICEVERE GRATUITAMENTE LE ISTRUZIONI DI TRADING E OTTIMI INDICATORI EXTRA! Probabilmente hai già sentito parlare molte volte dei metodi d
Ultra Indicator
Ihor Otkydach
5 (1)
ULTRA è un indicatore tecnico che funziona secondo un approccio “tutto in uno”: analizza autonomamente il mercato, genera segnali di trading, visualizza i livelli per l’impostazione degli ordini stop-loss e suggerisce quando chiudere le operazioni per realizzare profitti o ridurre al minimo le perdite. In altre parole, non importa se non sai come analizzare il mercato, determinare i livelli — dove impostare lo stop-loss — o se hai difficoltà con la gestione del capitale. ULTRA farà tutto questo
Currency Strength Wizard   è un indicatore molto potente che ti fornisce una soluzione all-in-one per un trading di successo. L'indicatore calcola la potenza di questa o quella coppia forex utilizzando i dati di tutte le valute su più intervalli di tempo. Questi dati sono rappresentati in una forma di indice di valuta facile da usare e linee elettriche di valuta che puoi utilizzare per vedere il potere di questa o quella valuta. Tutto ciò di cui hai bisogno è collegare l'indicatore al grafico ch
RelicusRoad Pro MT5
Relicus LLC
4.96 (25)
Basta andare a intuito nei tuoi trade. Sai quando entrare, dove uscire e da che parte va il mercato, tutto su un solo grafico. RelicusRoad Pro riunisce quasi venti strumenti in un unico indicatore, e attivi quelli che si adattano al tuo modo di operare. Ingressi chiari. Uscite chiare. Un piano su ogni grafico. Ti suona familiare? Compri, e un minuto dopo il prezzo ti va contro. Chiudi troppo presto, poi guardi il movimento proseguire senza di te. Cinque indicatori sul grafico, cinque risposte di
Indicatore multi-valuta di forza e momentum MT5 Dynamic Forex28 Navigator è l'evoluzione dei nostri indicatori popolari da lunga data, che riunisce la potenza di cinque in uno: Advanced Currency Strength28 Indicator (700 recensioni) Advanced Currency IMPULSE with ALERT (530 recensioni) Currency Strength EXOTICS GOLD Impulse with Alert CS28 Combo Signals (bonus attuale) Non serve acquistare quattro indicatori e impilarli sui grafici. Tutto è riunito in un solo indicatore potente: la forza delle 2
Azimuth Pro
Ottaviano De Cicco
5 (7)
Azimuth Pro V2: Synthetic Fractal Structure and Confirmed Entries for MT5 Overview Azimuth Pro is a multi-level swing structure indicator by Merkava Labs . Four nested swing layers, swing-anchored VWAP, ABC pattern detection, three-timeframe structural filtering, and closed-bar confirmed entries — one chart, one workflow from micro-swings to macro-cycles. This is not a blind signal product. It is a structure-first workflow for traders who care about location, context, and timing. 1. What Change
Boba Analysis Suite
Trade Ready Solutions LLC
5 (2)
Boba Analysis Suite Boba Analysis Suite è un indicatore di analisi per MetaTrader 5. Riunisce la struttura del mercato, le zone di prezzo rilevanti e il contesto generale del mercato in un’unica visualizzazione del grafico. Sviluppato sulla base dell’esperienza pratica come trader e formatore di trading, supporta un processo di analisi strutturato: valutare la direzione del mercato, individuare livelli importanti e analizzare congiuntamente più intervalli temporali. Analisi nel contesto del merc
Fx Levels Premium Indicator Support and Resistance are important concepts in trading. Fx Levels Premium was created to easily draw important levels of support and resistance for the active trader. The indicator will give you all important levels (support/resistance) to watch for a wide range of assets. Trading without these levels on your chart is like driving a car for a long journey without a roadmap. You would be confused and blind. Support and resistance levels should be used as guideline
Meridian Pro
Ottaviano De Cicco
4 (3)
Meridian Pro 2.00: Professional Multi-Timeframe Trend Matrix for MT5 Meridian Pro 2.00 is a professional adaptive trend matrix for MetaTrader 5. It combines the original Meridian trend engine, a clean chart ribbon, closed-bar signal arrows, an 8-timeframe dashboard, Fuel momentum, weighted consensus, synthetic HTF processing and chart-native higher-timeframe context lines. The goal is simple: read current trend, multi-timeframe structure, strength, momentum and EA-ready state from one discipline
Neuro Poseidon MT5
Daria Rezueva
4.68 (53)
Neuro Poseidon is a new indicator by Daria Rezueva. It combines precise trading signals with adaptive TP/SL levels - creating best possible trades as a result! Message me and get  Neuro Poseidon Assistant  as a gift to automize your trading process! What makes it stand out? 1. Proven profitability on all assets and timeframes 2. Only confirmed BUY and SELL signals present on the chart 3. Adaptive TP & SL levels generated by the software for each trade 4. Easy to understand - suitable for al
Bill Williams Advanced
Siarhei Vashchylka
5 (11)
Bill Williams Advanced is designed for automatic chart analysis using Bill Williams' "Profitunity" system. The indicator analyzes four timeframes at once. Manual (Be sure to read before purchasing) Advantages 1. Analyzes the chart using Bill Williams' "Profitunity" system. Signals are displayed in a table in the corner of the screen and on the price chart. 2. Finds all known AO and AC signals, as well as zone signals. Equipped with a trend filter based on the Alligator. 3. Finds "Divergence Bar
TPA True Price Action indicator reveals the true price action of the market makers through 100% non-repainting signals strictly at the close of a candle! TPA shows entries and re-entries, every time the bulls are definitely stronger than the bears and vice versa. Not to confuse with red/green candles. The shift of power gets confirmed at the earliest stage and is ONE exit strategy of several. There are available now two free parts of the TPA User Guide for our customers. The first "The Basics"
ARICoins
Temirlan Kdyrkhan
ARICoin is a powerful trading companion designed to generate high-probability entry signals with dynamic TP/SL/DP levels based on volatility. Built-in performance tracking shows win/loss stats, PP1/PP2 hits, and success rates all updated live. Key Features: Buy/Sell signals with adaptive volatility bands Real-time TP/SL/DP levels based on ATR Built-in MA Filter with optional ATR/StdDev volatility Performance stats panel (Success, Profit/Loss, PP1/PP2) Alerts via popup, sound, push, or email Cust
Superhero
Ihor Otkydach
5 (3)
L'indicatore SUPERHERO è un sistema di trading multivaluta progettato secondo un approccio "all-inclusive". L'indicatore analizza autonomamente il mercato e fornisce segnali su quando aprire e chiudere le posizioni. Utilizza ordini Stop Loss e Take Profit. Il rapporto R:R è 1:1. Questo sistema è in grado di inviare notifiche push sul tuo smartphone, consentendoti di effettuare operazioni "in mobilità" senza dover rimanere incollato al PC. È perfetto per le società di trading proprietario. UN OMA
Apex Patterns PRO Acquista l'indicatore - Ottieni GRATUITAMENTE l'Expert Advisor basato su di esso. Intelligenza auto-ottimizzante per pattern grafici e breakout Gli scanner di pattern tradizionali si basano su input fissi, registrando spesso prestazioni inferiori quando la volatilità e le strutture del mercato cambiano. Apex Patterns PRO è progettato per adattarsi alle mutevoli condizioni di mercato combinando il riconoscimento dei pattern grafici strutturali, il filtraggio del momentum e l'au
Precision Spike Detector
Francisco Mandomo Simbine
5 (2)
Precision Spike Detector V3 – Institutional-Grade AI Trading System Attention: The price increases by US$50 for every 10 purchases.  Final price: US$599 Precision Spike Detector V3   is a   state-of-the-art, institutional-grade market analysis system   for   MetaTrader 5 , designed to detect   high-probability market movements   in synthetic indices such as   Boom, Crash, GainX, and PainX . After purchase, send me a private message to receive the optimized configuration files,  the installation
Divergence Bomber
Ihor Otkydach
4.89 (94)
Ogni acquirente dell’indicatore riceverà inoltre gratuitamente: L’utilità esclusiva “Bomber Utility”, che gestisce automaticamente ogni operazione, imposta i livelli di Stop Loss e Take Profit e chiude le posizioni secondo le regole della strategia I file di configurazione (set file) per adattare l’indicatore a diversi asset I set file per configurare il Bomber Utility in tre modalità: “Rischio Minimo”, “Rischio Bilanciato” e “Strategia di Attesa” Una guida video passo-passo per installare, con
The Oracle Pro
Ottaviano De Cicco
5 (1)
The Oracle Pro: Synthetic Multi-Timeframe Bias Engine for MT5 The Oracle Pro is a premium multi-timeframe bias engine for MetaTrader 5, built for demanding and professional traders. It answers one question with discipline: what is the directional bias on each timeframe right now, how strong is it, and how much do the timeframes agree? Everything is computed on closed bars only - no repainting. The Oracle Pro is a multi-factor consensus system. It combines proprietary indicators and optimized alg
ScalpPoint
Temirlan Kdyrkhan
ScalpPoint is a powerful trading companion designed to generate high-probability entry signals with dynamic TP/SL/DP levels based on volatility. Built-in performance tracking shows win/loss stats, PP1/PP2 hits, and success rates — all updated live. Key Features: Buy/Sell signals with adaptive volatility bands Real-time TP/SL/DP levels based on ATR Built-in MA Filter with optional ATR/StdDev volatility Performance stats panel (Success, Profit/Loss, PP1/PP2) Alerts via popup, sound, push, or emai
AriFocus
Temirlan Kdyrkhan
AriFocus - Non-Repainting Buy/Sell Signals AriFocus - one clear signal. AriFocus marks buy and sell signals directly on the chart and suggests a stop-loss level for each one. Every signal is confirmed on bar close and never repaints. - Buy/sell arrows, confirmed on bar close - Suggested stop-loss level for every signal - Trend band and candle coloring to show direction at a glance - 10 ready-made presets, or your own settings (14 calculation methods) - Pop-up, push and email alerts with entr
ARIPoint
Temirlan Kdyrkhan
1 (4)
ARIPoint is a powerful trading companion designed to generate high-probability entry signals with dynamic TP/SL/DP levels based on volatility. Built-in performance tracking shows win/loss stats, PP1/PP2 hits, and success rates all updated live. Key Features: Buy/Sell signals with adaptive volatility bands Real-time TP/SL/DP levels based on ATR Built-in MA Filter with optional ATR/StdDev volatility Performance stats panel (Success, Profit/Loss, PP1/PP2) Alerts via popup, sound, push, or email Cu
Zain Gold Scalping
Ahmed Gamal Abdel Nasser Mohamed
Uno strumento completo di analisi della price action basato su una doppia logica di ingresso indipendente – ciascuna confermata da una banda di volatilità – e integrato da un set configurabile di nove filtri di conferma opzionali, che consentono di modulare con precisione il comportamento dei segnali, rendendoli più conservativi o più aggressivi. Strategia Fondamentale Due configurazioni di ingresso indipendenti, ciascuna delle quali si attiva solo quando il prezzo esce da una banda di volatil
SQN Max indicator for MT5 by ITC
Renaud Herve Francois Candel
Sqn Max Indicator Sqn Max is an exclusive indicator to trade the market with high effectiveness. The indicator is based on price action, volatility and trend. This indicator is as simple as possible but not too simple. The indicator can generate alerts to ease the trading process. You don't have to stay all day in front of your screen. The indicator can be used with any class of assets and with any time frame. It is possible to achieve better results trading our list of selected assets. We achi
Volatility Master for MetaTrader is a real-time dashboard tool that scans up to  50 symbols  to identify high-volatility , trending markets instantly. With bullish/bearish signals, customizable alerts, and a user-friendly interface, it helps you avoid range-bound conditions and focus on high-probability trades. Clarity leads to confidence. Trade confidently and protect your capital effectively with this powerful dashboard. We don't offer free or bonus indicators in exchange of reviews from you.
Naked Forex Tweezer Pro Indicator Tweezer Pro Indicator is a pattern recognition indicator for Forex, Stocks, Indices, Futures, Commodities and Cryptos. The standard Tweezer is a two bar pattern. Our enhanced version is a multi-bar pattern. We filter the patterns for you so that you only get the     best and most effective patterns   and ignore the noise. The Tweezer pattern is a simple and effective pattern to trade. The strategy that comes with the Tweezer is based on price action. The Twe
Advance AI Scanner
Mohamed Samsudeen
5 (1)
Advance AI Scanner is a multi-symbol analysis indicator for MetaTrader 5. It scans Forex pairs, metals, energy, stock indices and cryptocurrencies at the same time and rates each instrument with its own self-training model. It explains in plain English what moved each market and why, and it estimates how far upcoming economic news usually moves each symbol, measured on your broker's own price history. $199 instead of $499. 10 copies left at this price. One time purchase  Installation and User
Fibonacci Expansion and Retracement PRO Fibonacci retracing and extended line tools for the MT5 platform, ideal for traders who use the  Golden Section trading Demo: https://www.mql5.com/zh/market/product/35884 The main function: 1. You can draw multiple sets of Fibonacci retracements directly, and the relationship between important return points is clear at a glance. 2. Can draw Fibonacci extensions 3. The Fibonacci foldback and extension of the line can be moved left and right for easy ob
CGE Trading Suite
Carl Gustav Johan Ekstrom
5 (3)
Institutional-Grade Analytics for MT5 The full analytical edge of a professional trading desk, built into your MT5 chart. A full guided tour walks you through every feature step by step. Standard retail platforms lack the depth required for professional market analysis. The CGE Trading Suite bridges this gap, transforming MetaTrader 5 into a comprehensive workspace. By integrating 18 proprietary modules into a single, unified chart interface, the suite eliminates fragmented analysis. It provide
Altri dall’autore
Manzano Footprint Order Flow
Patricia Manzano Gomez
5 (1)
MANZANO FOOTPRINT ORDER FLOW Footprint, Order Flow and Volume Analysis for MetaTrader 5 Manzano Footprint Order Flow is an analytical indicator for MetaTrader 5 that brings together Footprint charts, Bid x Ask, Delta, Cumulative Delta (CVD), Imbalances, Volume Profile, VWAP, Market Depth and Time & Sales in an interactive environment. It allows traders to examine activity within individual candles, identify volume concentrations, compare buying and selling pressure, and analyse how market partic
Manzano Risk Box
Patricia Manzano Gomez
Manzano Risk Reward Box You can download the Pro version, featuring a comprehensive control panel, order management, trailing stop, break-even functionality, and funded account protection features, here: https://www.mql5.com/es/market/product/202156 Manzano Risk Reward Box is a visual trade planning and risk management tool for MetaTrader 5, designed to help traders prepare their positions directly on the chart before execution. It allows users to create visual BUY and SELL scenarios, define the
FREE
Harmonic Pattern Suite Pro Introduction Harmonic Pattern Suite Pro is an indicator designed to identify and display harmonic structures on the chart based on X-A-B-C-D sequences. Its purpose is to present pattern formations that meet geometric and proportional criteria, providing a clear visual representation directly on the chart. The indicator automates the detection process, removing the need for manual measurement of ratios and allowing the user to review the structural configuration withou
FREE
Manzano SMC Institutional Pro Smart Money Concepts, ICT, historical statistics, market structure and liquidity analysis for MetaTrader 5. Any SMC indicator can draw zones. Manzano SMC Institutional Pro measures how those zones have behaved in your market and compares their results with randomly chosen levels. See the structure. Check the historical evidence. Understand the market context. Manzano SMC Institutional Pro brings Smart Money Concepts (SMC), ICT methodology, Market Structure, Order B
Smart Adaptive Trend Flow MT4 Professional adaptive trend, market structure, price levels and flow analysis indicator for MetaTrader 4. Would you like to test it before purchasing? Request a fully functional trial version by sending us a private message through MQL5.com and evaluate the indicator directly on your own charts. A Complete Market View Smart Adaptive Trend Flow MT4 combines several analytical components in a single indicator: Adaptive trend analysis. BULLISH and BEARISH market regim
Smart Adaptive Trend Flow MT5 Professional adaptive trend, market structure, price levels and flow analysis indicator for MetaTrader 5. Would you like to test it before purchasing? You can request a fully functional trial version by sending us a private message through the MQL5 messaging system . This allows you to evaluate the indicator and all its features before making a purchase decision. A Complete Market View in a Single Chart Smart Adaptive Trend Flow MT5 has been developed to provide a
Manzano Trade Manager Pro
Patricia Manzano Gomez
Plan, execute and protect every trade in MetaTrader 5: exact risk-based lot size, automatic management, baskets and Prop Firm rules in a single panel. Manzano Trade Manager Pro is a professional trade manager for MetaTrader 5, designed especially for traders who trade funded accounts (Prop Firms) and need advanced control over risk, execution and position management. It brings together in one tool visual trade planning, automatic lot size calculation, individual, collective and basket managemen
Manzano Index Intelligence Analysis of the underlying constituents of the Nasdaq 100, S&P 500 and Dow Jones 30 for MetaTrader 5 It is not just about knowing where an index is moving, but understanding what is driving that move. BEFORE BUYING OR TRYING: CHECK YOUR BROKER The indicator requires your broker to provide both the index CFD and CFDs for its constituent stocks within the same MT5 account. Having a Nasdaq 100, S&P 500 or Dow Jones 30 CFD does not necessarily mean the broker also offers i
Filtro:
Nessuna recensione
Rispondi alla recensione