
Manzano Footprint Order Flow
- Индикаторы
-
Patricia Manzano Gomez
 Founder of Manzano Trading | Algorithmic Trading Developer | Quantitative Research & Financial Technology
I am the founder of Manzano Trading, a company specializing in the development of professional trading software, algorithmic systems, and advanced financial market analysis tools. - Версия: 5.1
- Обновлено: 12 октября 2026
- Активации: 5
MANZANO FOOTPRINT ORDER FLOW
Footprint, Order Flow and Volume Analysis for MetaTrader 5
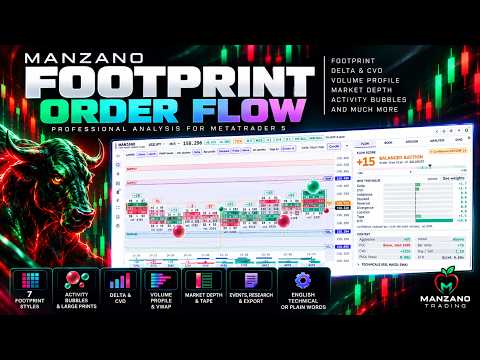
Manzano Footprint Order Flow is an analytical indicator for MetaTrader 5 that brings together Footprint charts, Bid x Ask, Delta, Cumulative Delta (CVD), Imbalances, Volume Profile, VWAP, Market Depth and Time & Sales in an interactive environment.
It allows traders to examine activity within individual candles, identify volume concentrations, compare buying and selling pressure, and analyse how market participation relates to price movement.
The indicator includes seven Footprint visualisation styles, activity bubbles, five analytical panels and two display modes. The interface is available in technical English or plain English, using the same underlying data and calculations.
FOOTPRINT AND DISPLAY MODES
The indicator offers two display modes.
Workspace Mode: an analytical environment with Footprint charts, statistics and a tabbed side panel. Market activity, liquidity information, trading sessions, detected events and data diagnostics can be examined from the same interface.
On Candles Mode: displays Footprint information directly over standard MetaTrader 5 candles, preserving the traditional chart structure and allowing traders to use their existing chart tools.
Both modes use the same analytical engine.
Seven Footprint visualisation styles are available:
-
Colour Matrix: Bid x Ask activity represented by colour intensity.
-
Heat Map: volume intensity at individual price levels.
-
Imbalances Only: displays detected imbalances with reduced visual information.
-
Delta: buying and selling activity differences at each price level.
-
Mirror: opposing distributions of buying and selling activity.
-
Histogram: volume distribution displayed within each candle.
-
Classic: traditional Bid x Ask numerical representation.
An optional thin candle can be displayed to preserve the visibility of price structure.
VOLUME ACTIVITY, DELTA AND MICROSTRUCTURE
Activity Bubbles
Activity bubbles highlight concentrations of volume or tick-derived activity at specific price levels.
They can help identify unusual participation, activity near candle extremes, potential absorption areas and changes in market activity.
When the broker provides real trade volume, the indicator can use it for activity analysis. Otherwise, activity concentrations are calculated from the available tick information.
Activity bubbles do not necessarily represent individual institutional transactions or verified executions.
Delta and Cumulative Delta
The indicator provides Delta measurements at individual price levels and for complete candles.
Available measurements include candle Delta, Delta percentage, Cumulative Delta (CVD) and price/CVD divergences.
These measurements allow traders to compare price movement with buying and selling activity identified or estimated from the available data.
Imbalances and Microstructure
The microstructure engine includes diagonal imbalances with three strength levels, relative and absolute filters, percentile-based detection, Stacked Imbalances and projected levels.
Additional analytical features include Unfinished Auctions, absorption and exhaustion detection, candle Point of Control (POC), POC migration and tracking of projected levels until mitigation.
Detection thresholds and filters can be configured according to the instrument and available market activity.
Flow Ribbon
A statistics ribbon below the chart displays information for visible candles, including time, volume, Delta, Delta percentage and CVD.
This provides a compact way to compare consecutive candles and observe changes in activity.
VOLUME PROFILE AND VWAP
Manzano Footprint Order Flow includes Volume Profile and VWAP tools for analysing volume distribution and price reference levels.
Available measurements include:
-
Volume Profile and Point of Control (POC).
-
Value Area High (VAH) and Value Area Low (VAL).
-
Developing POC and previous day's POC.
-
Volume Weighted Average Price (VWAP).
-
Optional VWAP deviation bands at one and two standard deviations.
These measurements provide additional context for evaluating where activity has concentrated relative to the current price.
FLOW INTELLIGENCE AND MARKET INTERPRETATION
Flow Intelligence combines different measurements of market activity into an analytical assessment.
Flow Score summarises the current alignment of the components evaluated by the indicator.
Confidence provides an internal measure of the consistency of that assessment.
See Weights displays the components contributing to the calculation and their relative influence.
Context Reading presents an explanation of current market conditions using the information available to the system.
These tools allow users to examine the measurements behind an assessment rather than relying exclusively on a directional indication.
Flow Score and Confidence are analytical measurements. They do not represent verified probabilities of successful trades or forecasts of future profitability.
Interface Language
The indicator offers two English presentation options.
Technical English uses terminology commonly associated with Order Flow analysis, including Delta, CVD, Imbalances, Absorption, Exhaustion, POC and Market Depth.
Plain English provides more accessible explanations of the same measurements for users who prefer less specialised terminology.
Both options use identical market data and calculations. Only the presentation of the information changes.
ANALYTICAL PANELS AND MARKET DEPTH
Five integrated panels organise the available information.
-
FLOW: Flow Score, Confidence, market interpretation and component contributions.
-
BOOK: available Market Depth, liquidity ladder, Time & Sales, activity concentrations and flow speed.
-
SESSION: measurements for the Asia, London and New York sessions, including volume, Delta and economic calendar context.
-
ANALYSIS: detected events, historical observations and subsequent price behaviour.
-
DIAGNOSTICS: data sources, historical data quality, MarketBook availability, measurement classification and processing information.
Market Depth and Time & Sales
When the broker provides MarketBook information, the indicator can display available order-book levels and liquidity distribution.
The Time & Sales panel presents activity reconstructed from the available tick stream, including changes in activity intensity and speed.
Real broker-provided Market Depth is distinguished from tick-derived measurements. The indicator does not generate artificial order-book liquidity when MarketBook data is unavailable.
HISTORICAL ANALYSIS, EXPORT AND CUSTOMISATION
Historical Reconstruction
Footprint information is reconstructed from the tick history available in MetaTrader 5.
The indicator includes a persistent cache that stores previously processed information, reducing repeated calculations during subsequent sessions.
The amount and quality of historical information depend on the broker's data availability and the configured processing limits. Initial reconstruction may require additional processing time.
Event Analysis
The historical analysis tools allow traders to review detected events and examine subsequent price behaviour.
Available functions include event logging, navigation to the corresponding candle, historical observations and data export.
Export and Interface Controls
The indicator provides snapshot exports, CSV research logs for closed candles, configurable event alerts, a built-in timeframe selector and historical navigation.
Additional options include light and dark themes, chart-based display controls, colour and symbol legends, visual configuration and adjustable detection filters.
DATA SOURCES AND LIMITATIONS
The information available for Order Flow analysis varies between instruments and brokers.
Forex and many CFD markets do not provide a centralised record of all executed transactions. For these instruments, certain measurements must be derived or estimated from the tick data supplied by the broker.
Depending on data availability, Manzano Footprint Order Flow can use real trade volume, tick volume, estimated buying and selling activity, and broker-provided MarketBook information.
The Diagnostics panel identifies available data sources and provides information about their characteristics and limitations.
Estimated buying and selling activity must not be interpreted as verified exchange transaction data. Likewise, activity bubbles and inferred classifications do not establish the identity of market participants.
The interpretation and accuracy of individual measurements depend on the available market data.
DOCUMENTATION, PRESETS AND REQUIREMENTS
User documentation and reference configuration presets are available for NAS100, US30, XAUUSD, EURUSD, USDJPY and GBPUSD.
These presets provide starting configurations for the respective instruments. Adjustments may be necessary depending on the broker, symbol specifications, trading conditions and available historical data.
System Requirements
-
MetaTrader 5.
-
Sufficient tick history for historical Footprint reconstruction.
-
Broker-provided MarketBook data for real Market Depth functionality.
-
Full HD screen resolution or higher recommended for Workspace Mode.
-
Sufficient processing resources for the selected historical reconstruction depth.
Manzano Footprint Order Flow is a market analysis indicator. It does not execute trades automatically and does not guarantee trading performance or financial results.




































I rarely write reviews , especially this soon after utilizing a product, but in this case a 5 star review is warranted. This is an exceptionally designed product, and for what its worth I've traded institutionally for many years, a hobby now. This is the first MQL5 product of this type that particularly caught my attention. There is tremendous detail and information, unusually so for the retail market, a clean and fast interface, but what really stood out as well is the customer service, providing a customized set for the instrument /TF I primarily trade without even asking for it. I would suggest testing this for yourself.