Manzano Volume Profile VWAP Levels
- Indicateurs
-
Patricia Manzano Gomez
 Founder of Manzano Trading | Algorithmic Trading Developer | Quantitative Research & Financial Technology
I am the founder of Manzano Trading, a company specializing in the development of professional trading software, algorithmic systems, and advanced financial market analysis tools. - Version: 1.6
- Activations: 5
Manzano Volume Profile VWAP Levels
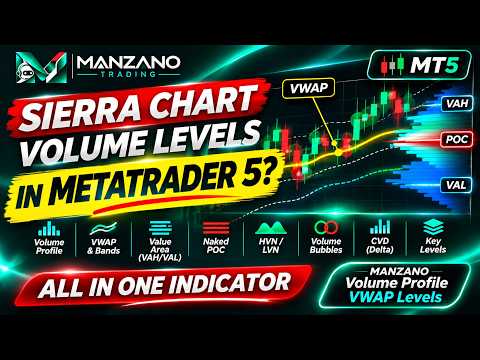
Professional futures traders read the market through volume: where the session VWAP sits, where value was built, which levels price has not revisited yet and who is really pushing, buyers or sellers. On platforms like Sierra Chart all of this sits on one chart. On MetaTrader 5 it usually means five or six separate indicators, each with its own style, that do not talk to each other.
Manzano Volume Profile VWAP Levels brings that complete volume map to MT5 in a single indicator. It includes session, weekly and monthly VWAP with deviation bands; session and composite volume profiles; value areas of the day, week and month; naked POC bands; HVN and LVN zones; opening range and initial balance; tick-by-tick volume bubbles; and a session cumulative delta pane. All of it lives in one professional interface where every layer can be switched on or off with a click.
This is not a basic profile with a VWAP added on top. It is a complete workstation for reading value, acceptance and pressure, designed for intraday traders of indices, gold, FX and futures CFDs.
What you see at a glance
When you open a chart, the indicator answers the questions that matter before every trade:
- Is price above or below the fair value of the day (VWAP), and how stretched is it in standard deviations?
- Is price trading inside, above or below yesterday's value area?
- Where are the high volume nodes that tend to attract and hold price, and the low volume areas price tends to cross quickly?
- Which POCs from previous sessions are still untouched?
- Where are the overnight range, the opening range and the initial balance?
- Are aggressive buyers or aggressive sellers in control of the session right now?
The top bar shows this context permanently with three chips: price position in VWAP deviations, position against the previous value area, and today's volume compared with the average of the last sessions.
Session VWAP with deviation bands
The session VWAP is the volume weighted average price of the day: the reference institutions use to judge whether they are buying expensive or cheap. It is drawn with up to three standard deviation bands (1, 2 and 3 sigma), all of them volume weighted. When price reaches the second band it is statistically stretched, and these areas are often where moves slow down or rotate.
- Anchor at the session start or at the cash open (for example 16:30 broker time for US indices)
- Bands of 1, 2 and 3 deviations, each switchable
- Line tags at the end of each curve (VWAP, SD1+, SD2-...) so the chart stays readable
- Hover the VWAP to see its value, the sigma and where price sits in deviations
Weekly and monthly VWAP
The weekly VWAP starts with the first session of the week and shows the average price of the week, with an optional 1 deviation band. The monthly VWAP does the same for the month. Together they tell you whether the intraday move goes with or against the value of larger participants.
Volume profiles: session, composite and history
A volume profile shows how much was traded at each price. It is the clearest picture of where the market accepted value and where it rejected it.
- Session profile: drawn next to the last bar and updated live, with today's POC, VAH and VAL
- Composite profile: drawn on the right edge, covering the current week, the current month, the previous session or the last N sessions (2 to 20)
- Value area (70% of the volume) highlighted and POC row marked in red
- Heat colours: rows coloured by intensity, from blue (little volume) to red (heavy volume), so the nodes stand out immediately
- Optional profile behind every past session, to see how value migrated day by day
- Optional volume heatmap: each session's volume by price painted as heat stripes behind the candles
- Automatic row size (based on the average daily range) with fine, normal, coarse and very coarse settings, or a fixed size in price
- Adjustable composite width, with the profile placed next to the label column so it never covers the level tags
Value areas of day, week and month
The indicator draws the VAH, VAL and POC of five periods, each clearly labelled on the right edge:
- Today (developing): VAH, VAL, POC
- Previous session: PD VAH, PD VAL, PD POC
- Current week: WK VAH, WK VAL, WK POC
- Previous week: PW VAH, PW VAL, PW POC
- Current month: M VAH, M VAL, M POC
Labels are stacked automatically so they never overlap. Opening inside, above or below yesterday's value, and accepting or rejecting the edges of value, are central ideas of auction market theory. Here they are visible without drawing a single line by hand.
Naked POC bands: the levels price has not revisited
The coloured horizontal bands are one of the most recognisable features of professional volume charts. They mark the POC of previous sessions that price has not traded back to (naked POCs). Many traders watch them as magnets and targets. Each band starts at its session, carries its date and disappears automatically as soon as price trades through it, so your chart only shows levels that are still open.
- Naked POC bands, plus optional naked VAH and VAL bands
- Number of recent sessions with bands, adjustable from 1 to 15
- Hover a band to see its exact price and the session it comes from
HVN and LVN zones
From the composite profile the indicator extracts high volume nodes (HVN), areas of strong acceptance where price tends to slow down and rotate, and low volume nodes (LVN), thin areas price tends to travel through quickly. They are drawn as wide zones across the chart, with an adjustable number of zones of each type.
Lines or heat bands: your choice
Every level can be drawn as a classic line, as a heat band that glows in the centre and fades out, or as both at once. Heat bands give the chart the soft, layered look of professional order flow platforms and make the important levels stand out without visual noise.
Key intraday levels
- Previous session high, low and close (PDH, PDL, PDC)
- Overnight high and low before the cash open (ONH, ONL)
- Opening range high and low (ORH, ORL), with configurable minutes
- Initial balance high and low (IBH, IBL), with configurable minutes
- Previous week high and low (PWH, PWL)
- Session open and cash open
Levels that are still forming (opening range, initial balance) carry an asterisk until they are complete. Session start, cash open and cash close are set in broker time, so the indicator adapts to any broker and any market.
Tick-by-tick volume bubbles
The bubbles are calculated from real ticks with an aggressor engine, the same approach used in order flow footprints. For each bar the indicator finds the exact prices where volume concentrated and draws a bubble there, sized by volume and coloured by the aggressor imbalance at that price: green for aggressive buyers, red for aggressive sellers, neutral grey when both sides were balanced. Hovering a bubble shows its volume, the imbalance percentage, how many times larger it is than the average row, and the time.
- Minimum size adjustable as a multiple of the average row volume
- Volume printed inside the bubble, optional
- On charts above H1, bubbles switch to bars with abnormal volume
Session cumulative delta (CVD) pane
At the bottom of the chart, a dedicated pane shows the cumulative delta of each session as candles: aggressive buying minus aggressive selling, reset at every session start. With one click it switches to the delta of each bar as a histogram, to compare the pressure of individual bars. The vertical scale of the price chart adjusts automatically so the pane never covers the candles.
- Calculated tick by tick where ticks are available (bright colours)
- Estimated from M1 bars outside the tick history (dimmed colours), so the source is always clear
- Adjustable pane height, cumulative or per-bar mode, automatic candle scale on or off
- Hover any bar to see its delta, the session total and the data source
Options levels
If you follow options positioning, you can add your call wall, put wall, gamma flip and three custom levels with your own names. Click PLACE and then click the chart, or type the prices in the inputs. They are drawn as purple tags and saved per symbol. MT5 does not provide options data, so these levels are entered by you from your own source.
Side dock with four tabs
- Levels: the nearest levels above and below price, with their name, price and distance in ATR. You always know what is next in both directions.
- Profile: a summary of the session. It shows today's POC, VAH and VAL, range and volume compared with their averages, session delta, profile shape (P, b or D), opening type (inside value, above or below value, out of range), initial balance compared with its average, the weekly and monthly value areas, and a plain-words reading of the context.
- Log: the key events of the last sessions. These are initial balance and opening range breaks, closes beyond the previous VAH or VAL, returns inside the previous value, VWAP 2 sigma band touches and naked POCs being filled. Click an event and the chart jumps to that bar and highlights it.
- Info: data used, number of sessions, row size, volume type, session times and calculation time, plus language, theme and reset buttons.
Interface designed for speed
- Layers bar: nine layers (VWAP, weekly and monthly VWAP, profiles, value areas, bands, key levels, bubbles, options, CVD) switchable with one click
- Presets: Sierra (everything), VWAP, Profile and Clean (levels only)
- Left rail with an options panel for every layer, so nearly every setting can be changed without opening the inputs
- Symbol selector with search (Market Watch or all symbols) and timeframe menu in the top bar
- Price, daily change and context chips always visible
- Hover cards with the details of every level, zone, profile and bubble
- Built-in legend explaining every colour and mark
- Status bar with bar countdown, broker time, number of levels, row size and volume type
- Dark and light themes, nine bullish and bearish colour sets, three dock widths
- English and Spanish interface
- Settings saved automatically and restored the next time
- Everything drawn on one canvas, without chart objects, so the object list stays clean and the chart stays responsive
Data and calculation
All calculations use your broker's own data. Profiles and VWAPs are built from M1 history (10 to 60 sessions, plus the current month and the previous week), using real volume when the broker provides it and tick volume otherwise. The tick engine for bubbles and CVD loads 1 to 5 sessions of ticks and works on charts up to H1. The indicator works on any symbol and timeframe. It is designed especially for intraday trading on M1 to M30 charts of indices, gold, FX and futures CFDs.
Input parameters
The inputs are grouped into clear blocks:
- Language and appearance: language, theme, colour set, start-up preset, fonts, dock
- Sessions: session start, cash open and close, opening range and initial balance minutes, sessions of history
- Volume data: volume source, row size, tick engine and tick sessions
- Layers: start-up state of the nine layers
- VWAP, profiles, value areas and bands, key levels, bubbles and CVD: start-up options of each block
- Options levels: prices and names of the manual levels
- Colours: every element can be recoloured
Strategy Tester
The indicator runs in the visual Strategy Tester with the full interface. Use "Every tick based on real ticks" to see the tick-by-tick bubbles and CVD. Zoom and scrolling are done with the tester chart's own controls.
Who it is for
- Intraday traders of indices, gold, FX and futures CFDs who work with VWAP, volume profile and auction market concepts
- Traders coming from Sierra Chart, NinjaTrader or ATAS who want the same volume levels on MetaTrader 5
- Discretionary traders who want context before every decision: value, acceptance, untouched levels and pressure
Important
Manzano Volume Profile VWAP Levels is a visual analysis tool. It does not generate trading signals, alerts or orders, and it does not promise any result: trading decisions remain yours. For questions or suggestions, contact me through MQL5 private messages.