Key Level Zone
- Индикаторы
- Версия: 1.0

Key Level Mapper MT5
Multi-timeframe support and resistance zones with strength rating, trend bias and a scenario panel.
support resistance, key levels, supply demand, zones, multi timeframe, price action, levels, trading plan.
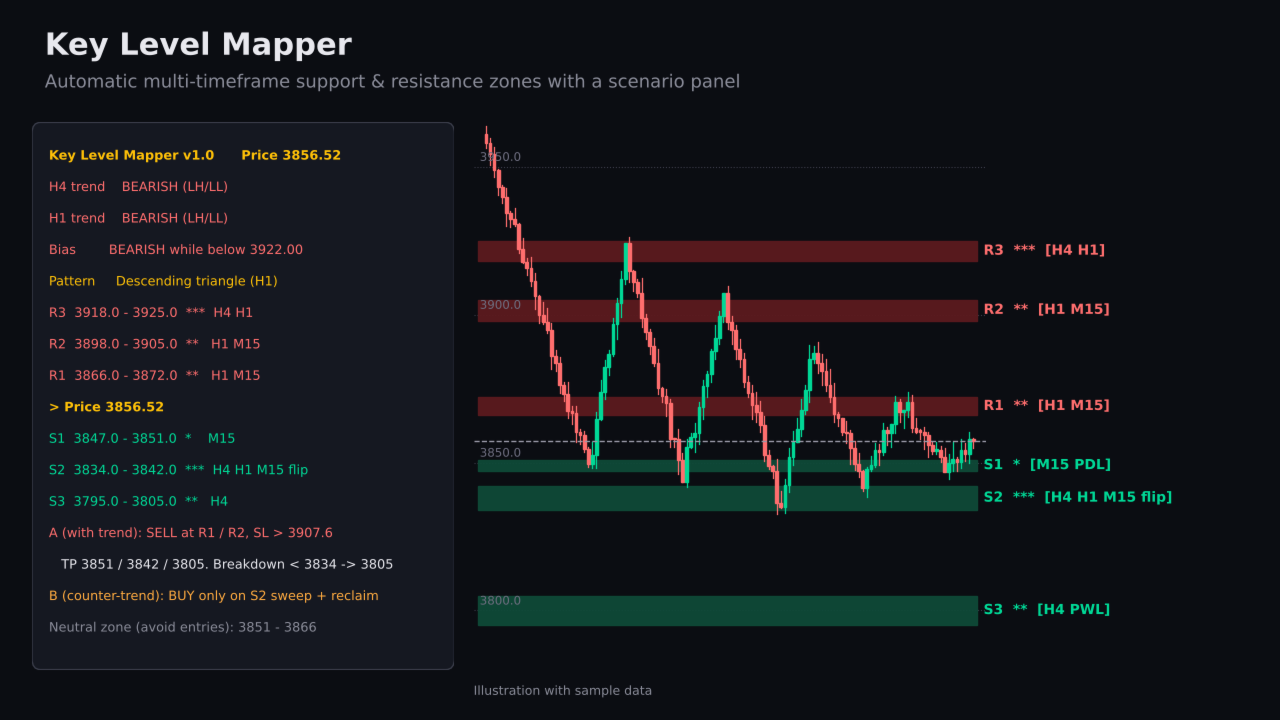
Key Level Mapper finds the price zones that matter on your chart and arranges them into a simple trading plan. Instead of drawing support and resistance by hand on several timeframes, the indicator scans H4, H1 and M15 swing points, merges the ones that sit close together, rates each zone, and shows the nearest levels above and below price together with the current trend and two possible scenarios.
It is an analysis tool. It does not open trades and does not repaint closed history: zones are rebuilt from confirmed swing points on every new M15 candle.
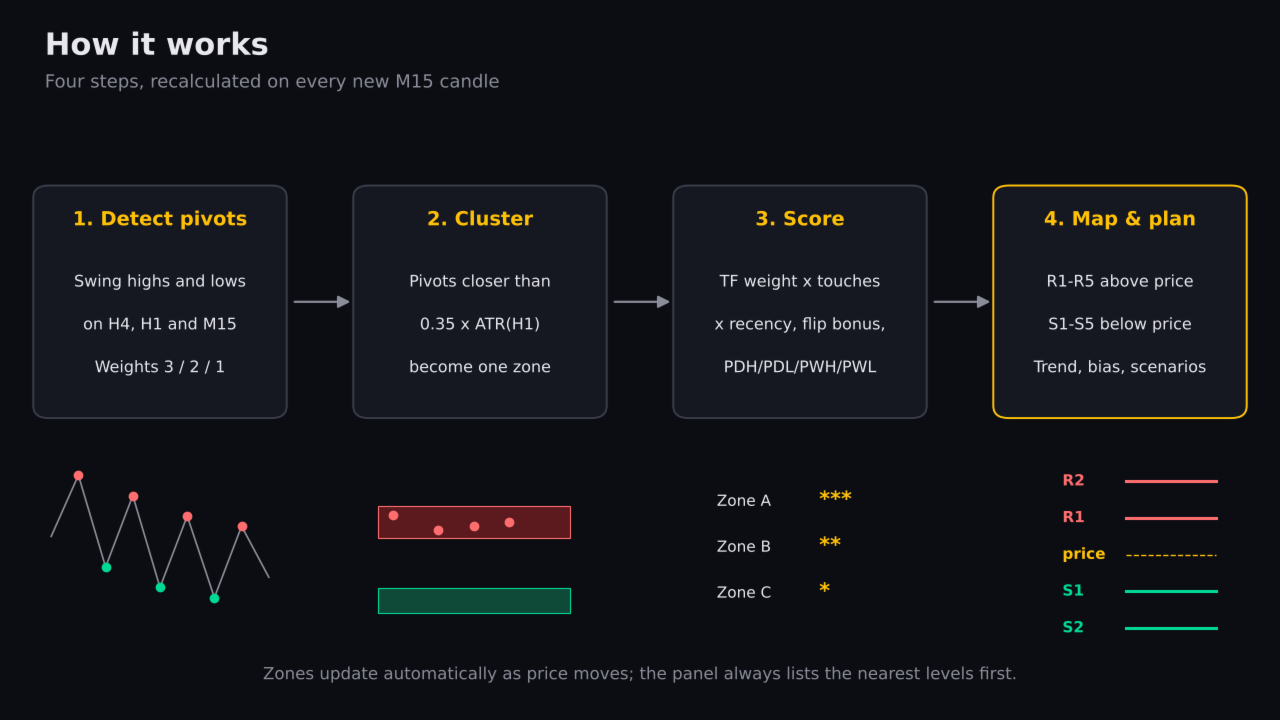
HOW IT WORKS
1. Detect pivots
Swing highs and lows are collected from H4, H1 and M15. Each timeframe has its own weight (default 3 / 2 / 1), so higher-timeframe levels count more.
2. Cluster
Pivots that lie within a set distance of each other (default 0.35 x ATR H1) are merged into one zone. Zone thickness is kept between a minimum and maximum ATR-based size.
3. Score
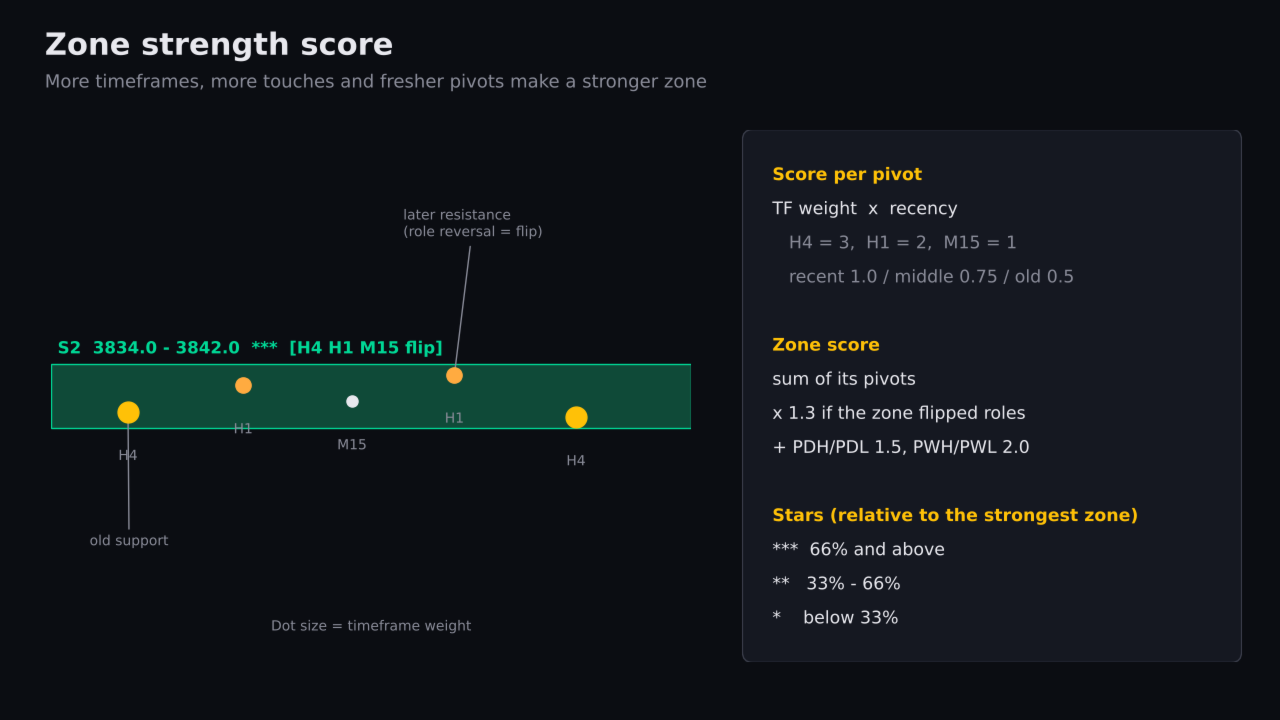
Every pivot adds its timeframe weight multiplied by a recency factor (recent 1.0, middle 0.75, older 0.5). A zone that acted as both support and resistance (role reversal / flip) gets a bonus. Previous day high/low and previous week high/low are added as extra levels.
4. Map and plan
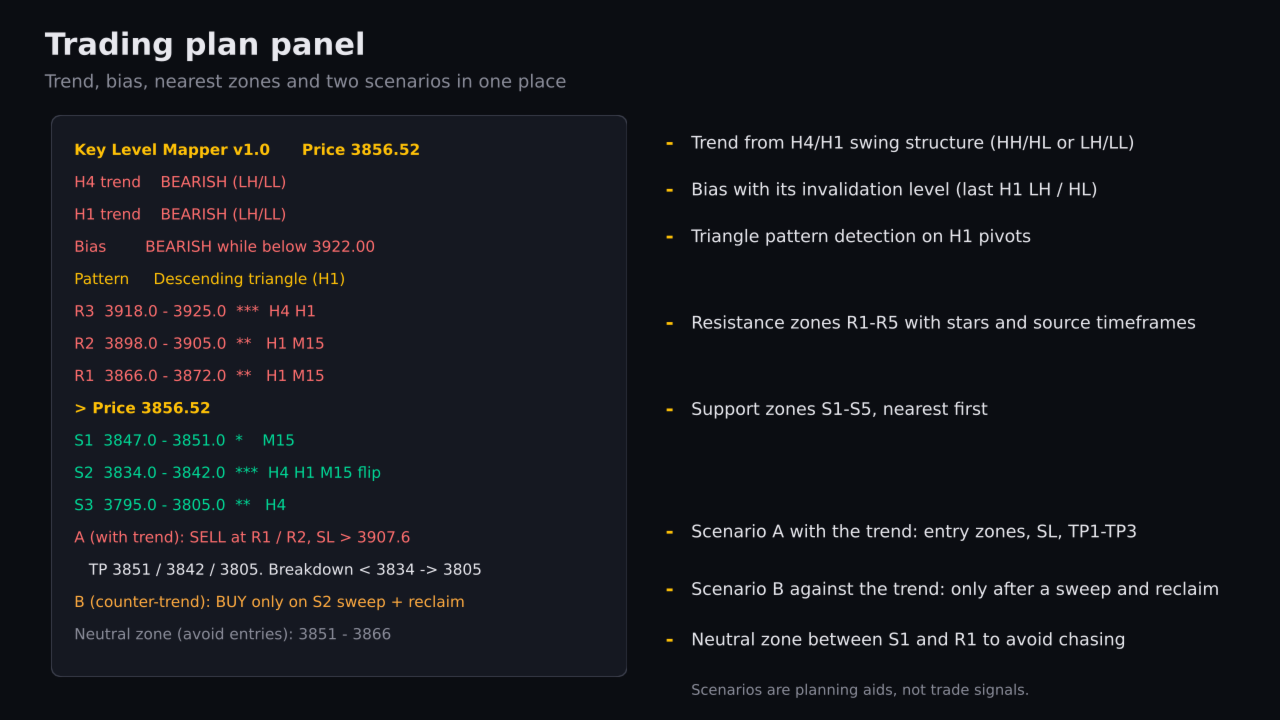
Zones are split into resistance (R1-R5) above price and support (S1-S5) below price, nearest first. Each zone receives 1 to 3 stars relative to the strongest zone on the chart. The panel then shows trend, bias, pattern and two scenarios built from the map.
MAIN FEATURES
- Automatic multi-timeframe zones from H4, H1 and M15, visible on any chart timeframe
- Strength rating with stars and the list of source timeframes for each zone (for example [H4 H1 flip PDH])
- Previous day and previous week high/low
- Round numbers with an automatic step based on daily ATR (or a fixed step)
- H4 and H1 trend from swing structure (HH/HL or LH/LL)
- Bias with an invalidation level taken from the last H1 lower high or higher low
- Ascending, descending and symmetrical triangle detection on H1 pivots
- Scenario panel: Scenario A with the trend (entry zones, stop level, targets, breakout level), Scenario B against the trend (only after a sweep and reclaim), and the neutral zone between S1 and R1
- Alerts when price enters a zone and when an M15 candle closes through a zone (popup and push notification); the same zone is not alerted twice in a row
- ATR-based sizing, so the default settings adapt to forex, gold, indices and crypto
- Optional dark chart theme and customizable colors
INPUT PARAMETERS
Timeframes and pivots
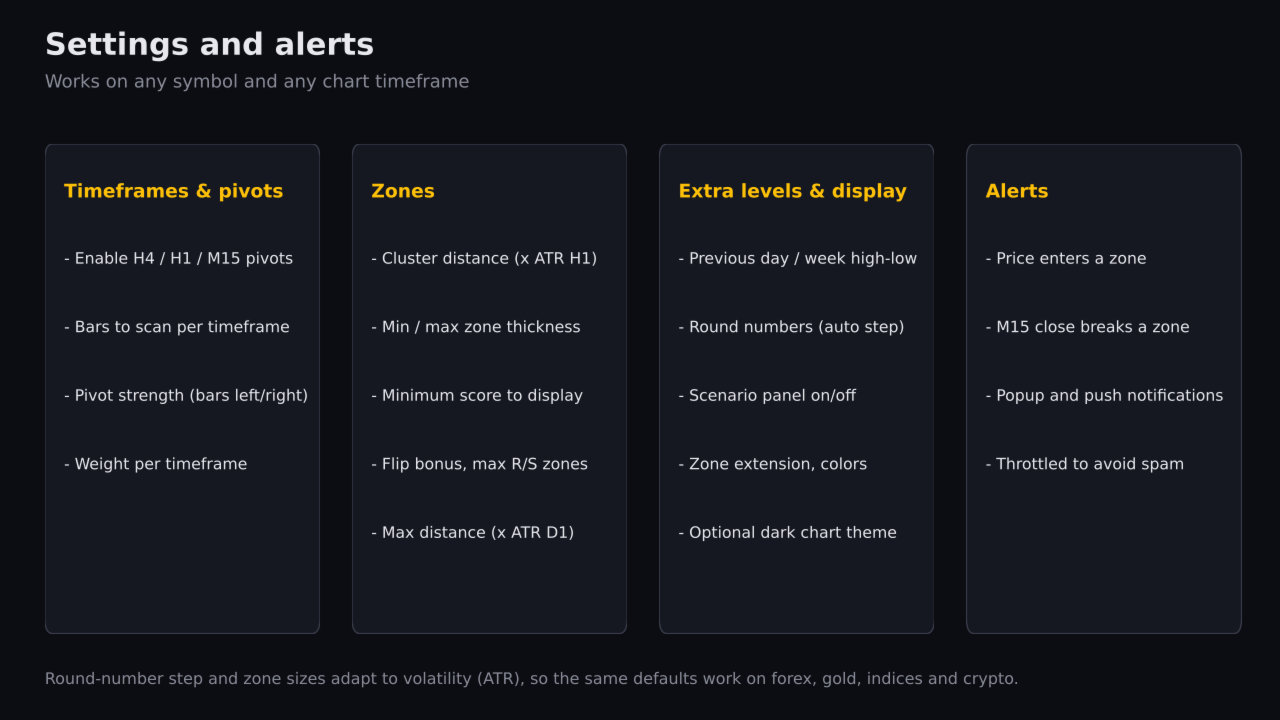
- Use H4 / H1 / M15 pivots: enable or disable each timeframe
- Bars to scan: history depth per timeframe (300 / 400 / 500)
- Pivot strength: bars on each side needed to confirm a swing (3 / 4 / 5)
- Weight: importance of each timeframe (3.0 / 2.0 / 1.0)
Zones
- Cluster distance (x ATR H1): how close pivots must be to merge (0.35)
- Minimum / maximum zone width (x ATR H1): 0.12 / 0.80
- Minimum score: zones below this score are hidden (3.0)
- Flip bonus: multiplier for zones that changed role (1.3)
- Maximum resistance / support zones shown: 5 / 5
- Maximum distance from price (x ATR D1): 6.0
Extra levels
- Previous day high/low, previous week high/low
- Round numbers and round number step (0 = automatic)
Display
- Show panel, zone extension to the right, colors, apply dark theme
Alerts
- Popup, push notification, alert on zone touch, alert on M15 close through a zone
RECOMMENDED USE
- Works on any symbol. Default settings were designed with XAUUSD and major forex pairs in mind.
- Use M15, H1 or H4 charts to read the map; zones stay the same on every chart timeframe.
- Treat three-star zones and zones marked "flip" as the main areas of interest, and wait for your own confirmation (candle pattern, structure break, etc.) before acting.
- The terminal needs enough history for H4, H1, M15 and D1. On first load, allow a few seconds for the data to download.
NOTES
- The indicator does not place orders.
- Levels are calculated from closed candles only.
- Scenarios are generated automatically from the zone map and are planning aids, not trade signals.
- Trading involves risk. Past price behavior around a level does not guarantee future reactions. Test the indicator on a demo account before using it on a live account.