Rolling Percentile Indicator

Rolling Percentiles Indicator

1. What the indicator does

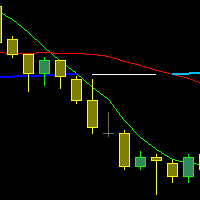
Rolling Percentiles draws three lines on the price chart. Each line is a percentile of the last N prices (the rolling window):

  • Upper line (green): the upper percentile, 75th by default.
  • Median (white, thick): the 50th percentile, always fixed.
  • Lower line (red): the lower percentile, 25th by default.

It is a non-parametric channel. Where Bollinger Bands assume price is roughly bell-shaped and measure it with a mean and standard deviation, this indicator simply ranks the recent prices and reads off where the chosen percentiles sit. It makes no distribution assumption, and one extreme bar cannot drag the lines the way it drags a standard deviation.

2. How it is calculated

For every bar i the indicator does the following:

  1. Collects the selected price from the last InpPeriod bars, ending at and including bar i .
  2. Sorts those prices from lowest to highest.
  3. For each percentile p , computes the position pos = (p / 100) × (N − 1) .
  4. If pos falls between two sorted values, it interpolates linearly between them. Otherwise it takes the value at pos directly.

This is the same “linear” method used by pandas rolling().quantile() and NumPy’s default percentile. I reproduced the algorithm in Python and compared it with pandas on a 500-bar series: the largest difference was about 2×10⁻¹³, which is floating-point noise. The first InpPeriod − 1 bars have no values, exactly like pandas with a full-window requirement.

For reference, with the default window of 50 the 25th percentile sits at sorted position 12.25 and the 75th at position 36.75, so both are interpolated values and not actual prices.

3. Inputs

Input

Default

Meaning

Valid range

InpPeriod

50

Rolling window size in bars.

Integer of at least 2 (see section 8)

InpP75

75.0

Upper percentile. Despite the name, it can be set to 90, 95, 99, etc.

Above InpP25 , at most 100

InpP25

25.0

Lower percentile.

At least 0, below InpP75

InpPriceType

PRICE_CLOSE

Price series ranked: Open, High, Low, Close, Median, Typical or Weighted.

Any ENUM_APPLIED_PRICE

The median percentile is fixed at 50 and has no input.

Important: version 1.00 does not validate these inputs. Values outside the ranges above can stop the indicator with an array-out-of-range error. See section 8.

4. Choosing your settings

Percentile pair

Pair

Band contains

Typical use

25 / 75

The middle 50% of prices (interquartile range)

Value area and equilibrium. Price is outside it about half the time, so it is a context tool, not a trigger.

10 / 90

Middle 80%

Balanced: frequent enough to be useful, selective enough to mean something.

5 / 95

Middle 90%

Stretch zones for fade or sweep setups.

1 / 99

Middle 98%

Near-extremes. With N = 50 these are almost the window high and low, so the channel behaves like a Donchian channel.

Window length

Window

Character

20–30

Fast, reacts to the current leg, noisier.

50 (default)

Intraday swing context.

100–200

Structural range or dealing-range context, slower and smoother.

The percentile of a window needs enough observations to be meaningful: below about 20 bars the 5th and 95th percentiles collapse onto the extreme values and add nothing.

Applied price

  • Close: the default and the cleanest for closing-basis rules.
  • Typical or Median: smoother, less sensitive to wicks.
  • High and Low together: attach two copies, one on High (for the upper line) and one on Low (for the lower line), to build a range channel that respects wicks. This is a common configuration when you want liquidity-sweep references.

5. Installing and attaching

  1. Save RollingPercentiles.mq5 in your terminal’s MQL5\Indicators folder.
  2. Open it in MetaEditor and compile (F7). It must report 0 errors.
  3. Attach it to a chart from the Navigator. It draws in the main chart window, not a sub-window.

Color note: the median is white by default. On a light chart template it is invisible, so change it in the indicator’s Colors tab.

6. Reading the three lines

Median (equilibrium). The middle of recent price. Price above a rising median means buyers have controlled the window; price below a falling median means sellers have. The median is robust, so a single spike barely moves it.

Band width (volatility regime). The distance between the upper and lower lines is a volatility gauge. A narrowing band means compression; a widening band means expansion. Because percentiles ignore tails, the width responds to sustained volatility rather than to one outlier bar.

Position inside the window (premium and discount). Price above the median is trading in the upper half of the recent window (premium); below it, in the lower half (discount). This maps neatly onto an equilibrium framework.

Buffer indices for EA or iCustom use: buffer 0 is the upper percentile, buffer 1 is the median and buffer 2 is the lower percentile. Note that the upper line is index 0 and the lower line is index 2.

One property you must understand

The window includes the current bar, and the bands are percentiles of price itself. By construction, price spends roughly 25% of the time above the 75th percentile and 25% below the 25th. A close above the upper line is therefore common and is not a breakout signal on its own. Use a high percentile (95 or 99), or combine the lines with market structure.

7. Example trading frameworks

These are process templates, not signals. Every one of them requires confirmation from market structure and session context, and a clear invalidation.

A. Range fade at the extreme (ranging regime)

  • Context: band width flat or contracting, median roughly flat, no break of structure on the higher timeframe.
  • Setup: price sweeps beyond the 5th or 95th percentile line, takes obvious liquidity (equal highs or lows), and closes back inside the band.
  • Entry: on the close back inside the band.
  • Stop: beyond the sweep extreme plus 0.5 × ATR(14).
  • Target 1: the median (close roughly half the position). Target 2: the opposite 25th or 75th line.
  • Risk: fixed fractional, 0.25–0.50% of equity per trade. Skip the trade if the target is under 1.5R.

B. Trend continuation off the median (trending regime)

  • Context: median sloping clearly, band width expanding, higher-timeframe structure making HH/HL (or LH/LL).
  • Setup: pullback to the median in discount (long) or premium (short), with a CHoCH or an order-block reaction on the lower timeframe.
  • Entry: on the confirmation candle’s close.
  • Stop: beyond the pullback swing, or beyond the structural low or high, with ATR padding.
  • Target: the 90th or 95th percentile line, then trail behind structure.
  • Risk: 0.25–0.75% per trade, with hard daily and weekly loss limits. No averaging down.

Avoid: trading every touch of the 25/75 lines. The lines say where price is in its recent distribution, not why it will reverse.

8. Comparison with the nearest similar indicator

The nearest built-in MT5 equivalent is Bollinger Bands. It has the same structure: three lines, one window, one applied price, a centre line and an upper and lower envelope. Donchian Channel is the limiting case of this indicator (percentiles 0 and 100 are the window minimum and maximum). I confirmed that numerically in the pandas test: the 100th-percentile line equals the rolling maximum.

Aspect

Rolling Percentiles

Bollinger Bands

Centre line

Median (50th percentile)

Moving average (SMA by default)

Envelope

Chosen percentiles of actual prices

Mean ± k × standard deviation

Distribution assumption

None

Roughly normal

Outlier sensitivity

Low

High: a spike inflates the deviation for the whole window

Band width meaning

Spread of the middle X% of prices

A multiple of dispersion

Fat tails (FX, gold)

Handles naturally

Bands under- or over-estimate real extremes

Coverage

Fixed by design (a 5/95 pair always holds 90% of the window)

Varies with the shape of the distribution

Window weighting

Equal weight, so lag is similar to an SMA

Equal weight (SMA mode)

Parameters

Window, two percentiles, price

Window, deviation multiple, shift, price

Computation cost

Sort per bar (heavier)

Running sums (very light)

Shift and style options

None in v1.00

Yes

Outlier test (synthetic). On a simulated 500-bar random walk with window 50, I added a single 40-point spike inside one window. A standard 2σ Bollinger band width grew from 4.69 to 23.08 (about 4.9 times wider), while the 25/75 percentile band width went from 1.77 to 1.79. For news spikes and stop-run wicks this is the practical advantage: the percentile bands keep describing where most trading happened.

Where Bollinger Bands are still better: very fast computation, built-in shift and style options, and a widely shared convention (20, 2) that other traders recognise. Where Rolling Percentiles is better: skewed or spiky instruments, liquidity-sweep work, and stable range references.

9. Review findings and known limitations in v1.00

The core algorithm is correct. The weaknesses are all in robustness and polish.

#

Finding

Severity

Recommended fix

1

No input validation. InpPeriod of 0 or less gives a negative start index and an array-out-of-range stop. Percentiles above 100 (or below 0) index outside the window. I reproduced this in the pandas-equivalent test: 101 raises an index error.

High

Validate in OnInit and return INIT_PARAMETERS_INCORRECT with a printed reason. Require period of at least 2, 0 ≤ lower < upper ≤ 100.

2

Inverted percentiles are silently accepted (lower input above upper input), so the colours and labels lie.

Medium

Same validation, or swap automatically.

3

Per-bar allocation and full sort. A new array is created and re-filled for every bar, with the applied price recomputed for each element. Cost is roughly bars × window × log(window), noticeable on large windows and long history.

Medium

Compute the price once per bar into an array. Reuse one window buffer. For heavy use, keep an incrementally sorted window (binary search insert/remove), which makes each bar roughly linear in the window.

4

Static plot labels. The Data Window always says “75th” and “25th”, even if you set 90 and 10.

Low

Set labels in OnInit with PlotIndexSetString(..., PLOT_LABEL, ...) .

5

No PLOT_DRAW_BEGIN and no explicit empty-value fill for the warm-up bars. It works because the terminal initialises buffers to the empty value, but it is better to be explicit.

Low

Set PLOT_DRAW_BEGIN to InpPeriod − 1 and PLOT_EMPTY_VALUE to EMPTY_VALUE .

6

White median is invisible on light templates.

Low

Choose a neutral colour such as gold or dodger blue.

7

No short name.

Low

IndicatorSetString(INDICATOR_SHORTNAME, ...) showing the period and percentiles.

8

Live-bar behaviour (by design). The newest bar is included in its own window, so the lines at the last bar move every tick. Closed bars do not change.

Info

Use bar-close values (shift 1) in any EA or rule.

What is correct and worth keeping: the series direction handling (arrays are used oldest to newest, consistently), the incremental recalculation from prev_calculated − 1 , the clean OnCalculate return value, and the interpolation math.

10. Troubleshooting

The indicator disappears right after attaching, with an “array out of range” message in the Experts or Journal log. Check the inputs against the table in section 3. This is the unvalidated-input issue.

No lines are drawn. Either the chart has fewer bars than InpPeriod , or history is still loading. Scroll back or wait for the history to finish downloading.

I can’t see the median. It is white on a white chart. Change its colour in the Colors tab.

The last value keeps changing. Expected: the live bar is still inside its own window. Closed bars never change.

Terminal is slow with a big window. Reduce InpPeriod , reduce the number of bars loaded on the chart, or ask for the optimised incremental version.

11. Quick reference

Item

Value

Window

Chart (main)

Plots and buffers

3 and 3

Buffer 0

Upper percentile (green line)

Buffer 1

Median (white thick line)

Buffer 2

Lower percentile (red line)

Method

Sorted window, linear interpolation (pandas-compatible)

First valid bar

InpPeriod − 1

Repaints

Last bar only, until it closes

Safe starting settings

50 bars, 10 / 90, Close


Рекомендуем также
Round Level MT5
Szymon Palczynski
3.5 (2)
The fact that round number levels have a significant influence on the market cannot be denied and should not be overlooked. These psychological levels are used by both retail Forex traders and major banks that deal in Forex.  Very simple and effective indicator and most importantly free. ////////////////////////////////////////////////////////////////////////////////////////////////////////////////////////////////////////////////////////////// The program does not work in the strategy tester.
FREE
Free automatic Fibonacci is an indicator that automatically plots a Fibonacci retracement based on the number of bars you select on the BarsToScan setting in the indicator. The Fibonacci is automatically updated in real time as new highest and lowest values appears amongst the selected bars. You can select which level values to be displayed in the indicator settings. You can also select the color of the levels thus enabling the trader to be able to attach the indicator several times with differe
FREE
MT4 Version Most indicators draw lines. This one draws the battlefield. If you ever bought an EA or indicator based on a perfect equity curve — and then watched it bleed out live — you’re not alone. The problem? Static logic in a dynamic market. Fibonacci Bollinger Bands   adapts. It combines Bollinger structure with customizable Fibonacci levels to mark   zones of control   — where price reacts, pauses, or reverses. No magic. Just logic that follows volatility. Why this tool matters   It
FREE
Стандартный индикатор Bollinger Bands усовершенствован путем интеграции в него дополнительных показаний от индикатора Standard Deviation (StdDev), которые являются дополнительным фильтром для подтверждения торговых сигналов. Кроме того, индикатор цветом своих линий указывает о начале тренда, его развитии и истощении. Индикатор имеет сигнальный блок, который оповещает трейдера о начале тренда на любом таймфрейме, к которому он подключен. Н‌астройки Type of messages‌ - настройка способа оповещени
FREE
TS Time Remaining
Aurelio Manuel Peral Garcia
TS Time Remaining - Indicador de Cuenta Regresiva para Velas en MetaTrader 5 El TS Time Remaining es un indicador gratuito diseñado para la plataforma MetaTrader 5 que permite a los traders visualizar en tiempo real el tiempo restante de la vela actual. Esta herramienta es especialmente útil para aquellos operadores que trabajan con estrategias basadas en la acción del precio y patrones de velas japonesas, ya que les permite anticiparse al cierre de la vela y tomar decisiones con mayor precisión
FREE
TrendVision AI
Murtadha Majid Jeyad Al-Khuzaie
TrendVision AI – Smart Trend Channels & Price Forecasting for MetaTrader 5 Discover market structure and explore potential future price direction with TrendVision AI, an advanced technical indicator for MetaTrader 5 that combines automatic trendline analysis with a machine-learning-based price forecasting model. How Does TrendVision AI Work? TrendVision AI analyzes historical candlestick data within a configurable lookback window. It automatically draws two trendlines directly on the chart:
FREE
Развитие предыдущей версии индикатора  ZigZag WaveSize MT4 ZigZag WaveSize -  модифицированный стандартный индикатор ZigZag с добавлением информации о длине волны в пунктах, уровней и разной логики алертов Общие улучшения: Адаптация кода под MetaTrader 5 Оптимизирована работа с графическими объектами Новое: Горизонтальные уровни на экстремумах Выбор типа уровней: горизонт/лучи/отрезки Фильтр ликвидных уровней (не пробитых ценой) Буфер для пробоев: настройка чувствительности к ложным пробоям На
FREE
Easy GOLD MT5
Franck Martin
3.87 (45)
Easy Gold is the latest addition to the BotGPT family. It is surprising and very powerful. It is ideal for beginners due to its simplicity.  There is absolutely nothing to do, it's 100% automated, simply indicate the percentage of risk you want to take per trade and the EA is ready. Whatever your capital, the EA takes care of everything. Optimized on (XAUUSD).  Unleash all the power with the professional version (AGI Gold) and its connection to the neural network, available in my store. My othe
FREE
Important Lines
Terence Gronowski
4.88 (24)
Индикатор отображает линии пивот, уровни максимума, минимума и закрытия предыдущего дня, а также минимум и максимум предыдущего часа. Нужно просто установить этот индикатор на график, чтобы отобразить все эти важные линии, нет необходимости настраивать множество отдельных индикаторов. Почему важны определенные линии Максимум и минимум предыдущего дня : эти уровни используются для торговли на дневном графике. Очень часто, если цена становится выше или ниже минимума/максимума предыдущего дня, про
FREE
Goldcrest Indicator — Free Gold Trading Signals for MetaTrader 5 Engineered for Gold. Built for Precision. Goldcrest Indicator is a free, powerful, and easy-to-use MetaTrader 5 indicator designed to help traders identify potential trading opportunities in the gold market (XAUUSD). Built using the proprietary Goldcrest signal-detection framework, the indicator monitors market conditions and displays clear BUY and SELL signals with entry prices and initial SL references directly on your chart , he
FREE
Fibonacci Moving Averages
Brendan Jonathan Stoyanowski-campbell
2 (1)
OVERVIEW The Fibonacci Moving Averages are a toolkit which allows the user to configure different types of Moving Averages based on key Fibonacci numbers. Moving Averages are used to visualise short-term and long-term support and resistance which can be used as a signal where price might continue or retrace. Moving Averages serve as a simple yet powerful tool that can help traders in their decision-making and help foster a sense of where the price might be moving next. The aim of this scrip
FREE
Alpha Edge Pro
Jestoni Santiago
5 (2)
Alpha Edge Pro – The Manual Trader’s Edge - If you prefer trading manually without stress, this indicator is for you. Get your copy now. Tired of missing the big moves or holding on to losing trades too long? Alpha Edge Pro is your new secret weapon. This high-performance, plug-and-play MT5 indicator gives you crystal-clear BUY and SELL signals — so you can trade with confidence, precision, and speed. If you prefer manual trading profitably , this indicator is made for you. Alpha Edge Pro does
FREE
Automatic fibonacci with alerts is an indicator that automatically plots a fibonacci retracement based on the number of bars you select on the BarsToScan setting in the indicator. The fibonacci is automatically updated in real time as new highest and lowest values appear amongst the selected bars. You can select which level values to be displayed in the indicator settings. You can also select the color of the levels thus enabling the trader to be able to attach the indicator several times with d
FREE
FibRetrace Zones Зоны коррекции Фибоначчи последнего свинг-движения FibRetrace Zones: бесплатный визуальный помощник к советнику FibRetrace. Индикатор строит уровни коррекции Фибоначчи и выделяет зону отката на последнем свинг-движении, чтобы вы видели, где находятся входы на откате, ещё до сделки. Зона окрашивается по направлению: зелёная для бычьих сетапов, красная для медвежьих. Работает на любом символе и любом таймфрейме. ОСНОВНЫЕ ВОЗМОЖНОСТИ Автоматическое определение свингов с настраиваем
FREE
PZ Penta O MT5
PZ TRADING SLU
3.8 (5)
The Penta-O is a 6-point retracement harmonacci pattern which usually precedes big market movements. Penta-O patterns can expand and repaint quite a bit. To make things easier this indicator implements a twist: it waits for a donchian breakout in the right direction before signaling the trade. The end result is an otherwise repainting indicator with a very reliable trading signal. The donchian breakout period is entered as an input. [ Installation Guide | Update Guide | Troubleshooting | FAQ | A
FREE
Индикатор   "Haven Key Levels PDH PDL"   помогает трейдерам визуализировать ключевые уровни на графике. Он автоматически отмечает следующие уровни: DO (Daily Open)   — уровень открытия дня. NYM (New York Midnight)   — уровень полуночи Нью-Йорка. PDH (Previous Day High)   — максимум предыдущего дня. PDL (Previous Day Low)   — минимум предыдущего дня. WO (Weekly Open)   — уровень открытия недели. MO (Monthly Open)   — уровень открытия месяца. PWH (Previous Week High)   — максимум предыдущей недел
FREE
RSI with alerts BDA
Laron Demetris Burrows
4.89 (28)
Этот алгоритм предсказывает краткосрочные изменения цены с точностью 86%*. Когда происходит большое движение, определяемое ATR, во время состояния перекупленности или перепроданности, индикатор предупредит вас. Предсказывает, будет ли цена выше или ниже сигнальной свечи. Идеально подходит для торговли со средней реверсией, бинарными опционами или фьючерсными контрактами на больших временных рамках. Индикатор был протестирован на данных за 5 лет и имеет точность 90% для прогнозирования разворото
FREE
Обзор продукта KMB Smart Pattern Analyzer PRO — это продвинутый индикатор технического анализа, предназначенный для обнаружения и ранжирования рыночных паттернов с высокой степенью соответствия внутри выбранного пользователем диапазона графика. Индикатор объединяет несколько аналитических механизмов в одном профессиональном инструменте: Анализ свечных паттернов Распознавание классических графических моделей Обнаружение гармонических структур Анализ структуры рынка / SMC Вместо отображения случай
FREE
Renko subwindow
Alexandre Vincent Traber
Overview Renko SubWindow строит график Renko в виде цветных свечей в отдельном окне индикатора, не затрагивая основной график. Размер кирпича можно задать фиксированным в пунктах или рассчитывать динамически по ATR для адаптивных кирпичей на основе волатильности. How it works Реконструирует кирпичи Renko на основе цен закрытия текущего символа/таймфрейма. Новый кирпич формируется, когда цена превышает заданный размер кирпича от закрытия предыдущего. Кирпичи отображаются как цветные свечи: бычий
FREE
MAs crossing
Roman Ogorodnikov
5 (1)
Индикатор рисует три Moving Average. Два коротких, пересекают длинную. При этом длинная MA меняет цвет: если два коротких выше длинной - один цвет; если два коротких ниже длинной - второй цвет; если две коротких по разные стороны от длинной - третий цвет. Все три MA построены по ценам закрытия с методом сглаживания - simple. cross MA cross 3 MA cross three Moving Average across Moving cross Moving crossing  MA crossing MA across MA  Мувинг пересекающиеся Мувинг пересекает Мувинг два пересечен
FREE
This indicator is an automated version of the Fibonacci retracement (Fib) indicator. Deciding the best areas to use when drawing the fib can be tricky and this  indicator was made with that in mind. When you drop it on the chart it will automatically choose the best points to draw the fib with, but in case you aren't satisfied with those regions, you can adjust it as you wish.
FREE
Trend Arrow NR Простые стрелки buy/sell на графике MetaTrader 5. 1. Что делает Рисует стрелки при пересечении быстрой и медленной EMA, с опциональным минимальным расхождением в множителях ATR. Это визуальный ориентир — не готовая торговая система. 2. Как устроен сигнал (без перерисовки) • Стрелки только на закрытых барах • На текущей (формирующейся) свече стрелки нет • История не сдвигается при новых тиках • Опциональные алерты: popup / push / email (один раз на бар сигнала) 3. Основные входы •
FREE
AC Expert
Nikolaos Pantzos
AC_Expert is structured based on a specific technical analysis indicator ( Accelerator Oscillator ) . It has many parameters so that each user can find the appropriate settings that suit their investment profile. It can work on 28 different pairs. The default parameter settings are indicative, I recommend that each user experiment to find their own settings.
FREE
Asian Range BreakOut
Wachinou Lionnel Pyrrhus Sovi Guidi
Полностью настраиваемый – Адаптируйте индикатор под свой стиль торговли, изменяя параметры, такие как время диапазона, цвета, стили линий и настройки риск-доходности. Визуализация торговых уровней – Автоматически отображает цену входа, стоп-лосс (SL) и тейк-профит (TP) на основе условий пробоя. Бесшовная интеграция с советниками (EAs) – Возьмите полный контроль над своими автоматическими стратегиями, добавляя дополнительные подтверждения, такие как RSI, скользящие средние, пробой структуры
FREE
OrderBlockZones.mq5 is an MT5 chart indicator that automatically detects and draws Order Block support/resistance zones as colored rectangles. What it identifies: - Support (bullish OB): the last down candle before a strong upward impulse move. - Resistance (bearish OB): the last up candle before a strong downward impulse move. The zone spans that origin candle's full high-to-low range. How it filters zones: - Unbroken only — a zone is discarded once a later bar closes beyond it (below a
FREE
Индикатор показывает на графике   круглые уровни . Их еще называют   психологическими , банковскими или уровнями основных игроков. На этих уровнях происходит настоящая борьба быков и медведей, накопление множества ордеров, что приводит к повышенной волатильности. Индикатор   автоматически   подстраивается под любой инструмент и таймфрейм. При пробитии и последующем тесте уровня   80 - покупаем . При пробитии и последующем тесте уровня   20 - продаём . Цель - 00. Внимание. Из-за сильных уровней
FREE
Follow The Line MT5
Oliver Gideon Amofa Appiah
4.6 (35)
This indicator obeys the popular maxim that: "THE TREND IS YOUR FRIEND" It paints a GREEN line for BUY and also paints a RED line for SELL. (you can change the colors). It gives alarms and alerts of all kinds. IT DOES NOT REPAINT and can be used for all currency pairs and timeframes. Yes, as easy and simple as that. Even a newbie can use it to make great and reliable trades. NB: For best results, get my other premium indicators for more powerful and reliable signals. Get them here: https://www.m
FREE
CandlePro X
Murtadha Majid Jeyad Al-Khuzaie
CandlePro X — Free Professional Candle Visualizer for MetaTrader 5 CandlePro X is a free chart visualization indicator for MetaTrader 5, designed to make candlestick charts cleaner, sharper, and easier to read. If you find it difficult to quickly distinguish bullish and bearish candles, especially on busy charts, CandlePro X helps solve this problem by giving your candles stronger colors, clearer contrast, and a more professional appearance. CandlePro X does not generate trading signals, pred
FREE
Totz Smart Money Concepts (FVG + Supply/Demand + Liquidity) Totz SMC is an all-in-one Smart Money Concepts (SMC) visual indicator engineered to clean up your charts, standardise market structure identification, and highlight high-probability institutional entry zones automatically. Key Features Fair Value Gaps (FVG): Automatically plots bullish and bearish imbalance zones with custom opacity and minimum size filtering. Supply & Demand Zones: Pinpoints explosive institutional displacement b
FREE
TV MACD Pro + SNR Support/Resistance is a professional trading tool that combines TradingView-style MACD with adaptive Support & Resistance detection. This indicator includes two core modules that can be turned on or off independently. MACD Module: Features authentic TradingView MACD color scheme, teal/red histogram with volume and shrinkage differentiation. Adjustable parameters include Fast EMA (default 12), Slow EMA (default 26), Signal SMA (default 9), and histogram scale. SNR Module: Au
FREE
С этим продуктом покупают
Trend Sniper X
Sarvarbek Abduvoxobov
4.86 (42)
Trend Sniper X — это трендовый индикатор для MetaTrader 5, работающий на нескольких таймфреймах, который помогает трейдерам точно и ясно определять направление тренда и потенциальные точки разворота. для MT4: https://www.mql5.com/en/market/product/193245 Информация о цене: Текущая цена является промо-ценой и может измениться по мере выхода предстоящих обновлений и новых функций. Бонусное предложение: Чтобы получить БЕСПЛАТНЫЙ авто-трейд советник Assistant EA для этого индикатора, пожалуйста, на
Новый король в городе — Индикатор + управление ордерами (TP1 + TP2 + TP3) + опциональный Telegram-сигнал-сендер ВКЛЮЧЁН (БЕСПЛАТНО) (ПОЛНОЦЕННАЯ ТОРГОВАЯ И СИГНАЛЬНАЯ СИСТЕМА) Gold Slayer EA Этот индикатор включает в себя продвинутую стратегию, торговую систему с настраиваемым управлением ордерами и систему mean reversion, которая сочетает расширения Envelope и поддерживается несколькими интеллектуальными фильтрами подтверждения, такими как RSI, для поиска высоковероятных точек разворота с сигн
Smart Trend Trading System — MetaTrader 5 После покупки напишите мне на MQL5, чтобы БЕСПЛАТНО получить Smart Universal Expert Advisor, а также доступ к онлайн-курсу, руководство в формате PDF и доступ к закрытой группе. STTS объединяет направление тренда, сигналы входа и выхода, зоны разворота и важные ценовые уровни прямо на графике. Торгуйте по системе вручную или подключите отдельный совместимый советник для автоматического исполнения с выбранными вами настройками. ОДНА СИСТЕМА. ЧЕТЫРЕ ТОРГОВ
Zoryk Gold
Reda El Koutbane
4.76 (17)
Скидка заканчивается через 24 часа — следующая цена $ 69 ZORYK — продвинутая сигнальная система для XAUUSD в MetaTrader 5 Вам знакомо это чувство. Вы долго анализируете золото. Ждёте подходящего момента для входа. Наконец открываете сделку — и цена сразу начинает двигаться против вас. Вы закрываете позицию слишком рано, передвигаете Stop Loss или сомневаетесь всего несколько секунд. После этого рынок достигает именно той цели, которую вы ожидали изначально, но уже без вас. Проблема не всегда за
Получите своё торговое преимущество в поле зрения! M5 Sniper — это новый индикатор от MeanFX. Он сочетает точные торговые сигналы с адаптивными уровнями TP/SL — в результате создавая лучшие возможные статистические сделки! Цена увеличивается каждые 5 покупок, следующая цена — 69$ Напишите мне после покупки, чтобы получить советы/руководство и бонусного EA Что выделяет его среди других? Проверенная статистическая эффективность на Gold XAUUSD ( работает практически на каждом активе , с акцентом н
SuperScalp Pro
Van Minh Nguyen
4.54 (37)
SuperScalp Pro - Professional Multi-Layer Confluence Scalping System SuperScalp Pro — это продвинутый индикатор для скальпинга, который расширяет возможности классического Supertrend с помощью нескольких интеллектуальных фильтров подтверждения. Он помогает выявлять торговые возможности Buy/Sell с более высокой вероятностью успеха и значительно сокращать количество ложных сигналов. Чёткие стрелки Buy и Sell отображаются непосредственно на графике вместе с автоматически рассчитываемыми в реальном
SMC Intraday Formula
VividMind Digital Solutions
5 (26)
Давайте сначала будем честны. Ни один индикатор сам по себе не сделает вас прибыльным. Если кто-то говорит вам обратное — он продаёт вам мечту. Любой индикатор, который показывает идеальные стрелки покупки/продажи, можно сделать безупречным — просто увеличьте нужный участок истории и сделайте скриншот успешных сделок. Мы так делать не будем. SMC Intraday Formula — это инструмент. Он считывает структуру рынка за вас, определяет зоны с наивысшей вероятностью движения цены и точно показывает, как
GoldenX Entry MT5
VividMind Digital Solutions
5 (17)
GoldenX Entry — это индикатор для MT5 с адаптивным алгоритмом Smart Entry Trend, системой оценки сигналов, детектором рыночных режимов и фильтром волатильности. Каждый сигнал включает рассчитанный уровень входа, три уровня Take-Profit (TP1, TP2, TP3) и уровень Stop-Loss. Он построен на нескольких аналитических слоях, предназначенных для адаптации к различным рыночным условиям, объединяя многоуровневую аналитическую систему со встроенным оптимизатором и системой статистического отслеживания. Инди
Entry Points Pro — топ-1 индикатор по количеству отзывов (более 600 отзывов и более 28 000 скачиваний демо обеих версий). Индикатор даёт самые перспективные точки входа в сделки без перерисовки на любых инструментах. Индикатор покажет заранее стрелкой точку входа в сделку, укажет цену входа и нарисует на графике уровень входа и стопа, а так же рассчитает рабочий лот под твой депозит и риск, а панель статистики поможет выбрать самый перспективный инструмент и таймфрейм .  Тебе остаётся поставить
Auto Optimized SpeedAngle — это система векторизации импульса институционального уровня, которая исключает подгонку под исторические данные (curve-fitting) за счет непрерывной форвард-оптимизации (Walk-Forward Optimization, WFO). Вместо того чтобы полагаться на статические входные параметры, которые теряют эффективность при смене рыночных режимов, индикатор динамически перекалибрует свои настройки, используя валидацию на вневыборочных данных (Out-of-Sample, OOS). Это гарантирует, что отображаемы
Gann Made Easy   - это профессиональная, но при этом очень простая в применении Форекс система, основанная на лучших принципах торговли по методам господина У.Д. Ганна. Индикатор дает точные BUY/SELL сигналы, включающие в себя уровни Stop Loss и Take Profit. ПОЖАЛУЙСТА, СВЯЖИТЕСЬ СО МНОЙ ПОСЛЕ ПОКУПКИ, ЧТОБЫ ПОЛУЧИТЬ ТОРГОВЫЕ ИНСТРУКЦИИ И ОТЛИЧНЫЕ ДОПОЛНИТЕЛЬНЫЕ ИНДИКАТОРЫ БЕСПЛАТНО! Вероятно вы уже не раз слышали о торговли по методам Ганна. Как правило теория Ганна отпугивает от себя не только
ARIPoint
Temirlan Kdyrkhan
1 (4)
ARIBot is a powerful trading companion designed to generate high-probability entry signals with dynamic TP/SL/DP levels based on volatility. Built-in performance tracking shows win/loss stats, PP1/PP2 hits, and success rates — all updated live. Key Features: Buy/Sell signals with adaptive volatility bands Real-time TP/SL/DP levels based on ATR Built-in MA Filter with optional ATR/StdDev volatility Performance stats panel (Success, Profit/Loss, PP1/PP2) Alerts via popup, sound, push, or email Cus
Adaptive Price Action Engine Купи индикатор — получи советник (EA) к нему бесплатно Самооптимизирующийся мульти-таймфреймовый анализ тренда и свечных моделей Рынок постоянно меняется — и не каждая модель Price Action имеет одинаковую ценность в разных рыночных режимах. Adaptive Price Action Engine создан для адаптации к изменяющимся рыночным условиям, объединяя трендовую структуру, мульти-таймфреймовый анализ, свечные модели и статистическую оптимизацию в единой аналитической системе. Два адапти
M1 SNIPER   — это простая в использовании торговая система. Это стрелочный индикатор, разработанный для тайм фрейма M1. Индикатор можно использовать как отдельную систему для скальпинга на тайм фрейме M1, а также как часть вашей существующей торговой системы. Хотя эта торговая система была разработана специально для торговли на M1, ее можно использовать и с другими тайм фреймами. Первоначально я разработал этот метод для торговли XAUUSD и BTCUSD. Но я считаю этот метод полезным и для торговли на
Индикатор Tokyo Indicator обеспечивает наглядное представление о направлении тренда, потенциальных торговых сигналах и текущей рыночной ситуации. Его ступенчатая линия тренда с цветовой индикацией позволяет различать «бычьи» фазы (выделены синим цветом) и «медвежьи» фазы (выделены пурпурным цветом). Соответствующие стрелки указывают на возможные точки входа в рынок (покупку или продажу) при смене тренда. Встроенная информационная панель объединяет данные о текущем сигнале, рыночном настроении,
Gold Entry Sniper – Профессиональная Мульти-Таймфрейм ATR Панель для Скальпинга и Свинг-Трейдинга на Золоте Gold Entry Sniper — это передовой индикатор для MetaTrader 5, разработанный для точных сигналов на покупку/продажу по XAUUSD и другим инструментам. Основан на логике ATR Trailing Stop и мульти-таймфрейм анализе , этот инструмент идеально подходит как для скальперов, так и для среднесрочных трейдеров, обеспечивая чёткие точки входа с высокой вероятностью . Основные возможности и преимуществ
Следующее обновление — версия 2.52 уже скоро! [НОВОЕ] Приготовьтесь к 4 новым важным функциям, призванным улучшить ваш анализ рынка и торговый процесс. Мы выводим анализ рынка на новый уровень с помощью 4 новых функций, разработанных с учётом ваших потребностей в трейдинге. Представляем: 1. TRADE OVERVIEW DASHBOARD 2. CONFLUENCE AT ZONE 3. STRONG & WEAK HIGH/LOW 4. OTE 1. TRADE OVERVIEW DASHBOARD Панель, которая помогает легче понимать общую картину рынка, предоставляя рекомендации для поддержк
Boba Analysis Suite
Trade Ready Solutions LLC
5 (2)
Boba Analysis Suite Boba Analysis Suite — аналитический индикатор для MetaTrader 5. Он объединяет структуру рынка, значимые ценовые зоны и общий рыночный контекст в одном представлении на графике. Индикатор разработан на основе практического опыта трейдера и наставника по трейдингу. Он помогает выстроить последовательный процесс анализа: оценивать направление рынка, определять важные уровни и рассматривать несколько таймфреймов в совокупности. Анализ с учётом контекста Значение отдельных сигнало
FiboSniper Pro – Multi-Filter Fibonacci System with Auto SL/TP and Control Panel FiboSniper Pro — это технический индикатор, который объединяет динамические Fibonacci Envelopes с несколькими фильтрами подтверждения для формирования отборных сигналов Buy и Sell. Уровни Fibonacci рассчитываются на основе Moving Average и ATR, а затем фильтруются с помощью ADX, EMA, RSI, ATR, Volume, Time и структуры свечи. Индикатор отображает на графике автоматические уровни Stop Loss и Take Profit на основе ATR,
Break and Retest Hunter is a powerful MetaTrader 5 indicator designed to automatically identify support and resistance levels, breakout structures, and potential retest opportunities in real time. Bonus Indicator: After purchasing Break and Retest Hunter , contact me to receive Trade Indicator Assistant EA completely free as a bonus utility. $65 for the next 10 copies . Next price is $120.  Combining adaptive market analysis, clear BUY/SELL signals, Fibonacci-based profit targets, and a premiu
Trend Catcher   анализирует движения рыночных цен, используя комбинацию собственных и индивидуально разработанных адаптивных индикаторов анализа тренда. Он определяет истинное направление рынка, отфильтровывая краткосрочные шумы и фокусируясь на силе импульса, расширении волатильности и поведении ценовой структуры. Он также использует комбинацию сглаживающих и фильтрующих тренд индикаторов, таких как скользящие средние, RSI и фильтры волатильности. Мониторинг реальных операций, а также другие
Power Candles V3 — самооптимизирующийся индикатор силы Power Candles V3 преобразует силу валюты и инструмента в готовый к использованию торговый план на каждом графике, к которому он прикреплен. Вместо того, чтобы просто раскрашивать свечи, он выполняет автоматическую оптимизацию в режиме реального времени в фоновом режиме и предоставляет вам оптимальные значения Stop Loss, Take Profit и порог сигнала для выбранного вами символа. Один клик — и все готово для реальной торговли: на графике появляю
Gold Trend Coach MT5
Cristhian Alexander Gaibor Cuasquer
5 (2)
Gold Trend Coach — трендовый индикатор по золоту (XAUUSD) для MetaTrader 5 с сигналами на покупку и продажу, стоп-лоссом и тремя целями тейк-профита, подтверждёнными на закрытии бара, мультитаймфреймовой панелью коуча и оповещениями на телефон и в Telegram. Создан для скальпинга на M5 и интрадея на M15 в лондонскую и нью-йоркскую сессии. Gold Trend Coach: трендовые сигналы по золоту XAUUSD с входом, стопом и тремя целями. Стартовая цена $39 за первые 20 копий, далее $59. Напишите мне после поку
Neuro Poseidon - новый индикатор от Дарьи Резуевой. Он сочетает точные торговые сигналы с адаптивными уровнями TP/SL , в результате создавая максимально выгодные сделки! TO SWITCH TO   ENG   PLEASE CHOOSE IT IN THE UPPER-RIGHT CORNER OF THE WEBSITE Напишите мне и получите  Neuro Poseidon Assistant  в подарок для автоматизации вашей торговли! Что отличает его от других индикаторов? 1. Доказанная прибыльность на всех активах и таймфреймах 2. На графике присутствуют только подтвержденные сигналы н
Unix Scalper — MetaTrader 5 После покупки напишите мне на MQL5, чтобы БЕСПЛАТНО получить Smart Universal Expert Advisor, а также доступ к онлайн-курсу, руководство в формате PDF и доступ к закрытой группе. Найдите торговую ситуацию. Оцените план. Выберите способ торговли. UNIX Scalper объединяет анализ рынка, решения BUY/SELL/WAIT и уровни Entry, Stop Loss, TP1 и TP2 в одной удобной панели. УВИДЬТЕ СИГНАЛ И ТОРГОВЫЙ ПЛАН • Понятные решения: BUY, SELL или WAIT. • Определённые уровни: Entry, Stop
Представляем       Quantum Breakout PRO   , новаторский индикатор MQL5, который меняет ваш способ торговли в зонах прорыва! Разработан командой опытных трейдеров со стажем торговли более 13 лет,       Квантовый прорыв PRO       разработан, чтобы поднять ваше торговое путешествие к новым высотам с его инновационной и динамичной стратегией зоны прорыва. Quantum Breakout Indicator покажет вам сигнальные стрелки на зонах прорыва с 5 целевыми зонами прибыли и предложением стоп-лосса на основе поля
FX Trend NG: Следующее поколение интеллектуального анализа трендов на разных рынках Обзор FX Trend NG — это профессиональный инструмент анализа трендов и мониторинга рынка с поддержкой нескольких таймфреймов. Он позволяет за секунды получить полное структурное понимание текущего состояния рынка. Вместо переключения между десятками графиков вы мгновенно видите, какие инструменты находятся в тренде, где импульс ослабевает и где наблюдается сильная синхронизация между таймфреймами. Специальное пр
Мультивалютный индикатор силы и импульса MT5 Dynamic Forex28 Navigator — это развитие наших давних популярных индикаторов, объединяющее силу трёх в одном: Advanced Currency Strength28 Indicator (700 отзывов) Advanced Currency IMPULSE with ALERT (530 отзывов) CS28 Combo Signals (недавний бонус) Оба индикатора-предшественника вместе получили более 1,200 отзывов на MQL5 Market и с 2016 года являются неотъемлемой частью сообщества MT4. Dynamic Forex28 Navigator MT5 переносит ту же проверенную логику
Scalper Vault — это мощная, полноценная торговая система, созданная для трейдеров, которые стремятся к стабильным результатам в внутридневной торговле. Этот высокоточный индикатор представляет собой комплексное, самостоятельное торговое решение, обеспечивающее аналитику профессионального (институционального) уровня как для торговли на рынке Forex, так и для работы с бинарными опционами. Пожалуйста, свяжитесь со мной после покупки, чтобы получить мои торговые советы, а также отличный бонус! Исклю
Volatility Master for MetaTrader is a real-time dashboard tool that scans up to  50 symbols  to identify high-volatility , trending markets instantly. With bullish/bearish signals, customizable alerts, and a user-friendly interface, it helps you avoid range-bound conditions and focus on high-probability trades. Clarity leads to confidence. Trade confidently and protect your capital effectively with this powerful dashboard. We don't offer free or bonus indicators in exchange of reviews from you.
Другие продукты этого автора
Zenova – Futuristic Zen Trading for EURUSD H1 (Introductory Release) Discover the calm power of disciplined, patient trading. Slowly but surely. Zenova is a premium Expert Advisor meticulously crafted and extensively tested exclusively for the EURUSD pair on the H1 timeframe . It combines precise trend detection (ADX strength + RSI divergence filters) with intelligent price action confirmation to enter only high-probability, slow-moving trends—delivering a proven win rate of ~89% and a solid pro
QuietPip — EURUSD Volatility-Regime Scalper High Historical Profit Factor. Low Historical Drawdown. Selective Trading. QuietPip is a specialized Expert Advisor for MetaTrader 5, designed to trade EURUSD when market conditions are favorable and stand aside when volatility expands. Rather than chasing every market movement, QuietPip waits for specific price-action conditions, applies a volatility filter, and manages each position with a predefined stop loss and an automated trailing stop. The obj
Фильтр:
Нет отзывов
Ответ на отзыв