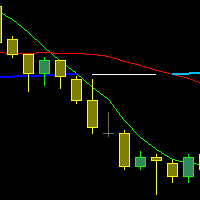
Rolling Percentile Indicator

Rolling Percentiles Indicator

1. What the indicator does

Rolling Percentiles draws three lines on the price chart. Each line is a percentile of the last N prices (the rolling window):

  • Upper line (green): the upper percentile, 75th by default.
  • Median (white, thick): the 50th percentile, always fixed.
  • Lower line (red): the lower percentile, 25th by default.

It is a non-parametric channel. Where Bollinger Bands assume price is roughly bell-shaped and measure it with a mean and standard deviation, this indicator simply ranks the recent prices and reads off where the chosen percentiles sit. It makes no distribution assumption, and one extreme bar cannot drag the lines the way it drags a standard deviation.

2. How it is calculated

For every bar i the indicator does the following:

  1. Collects the selected price from the last InpPeriod bars, ending at and including bar i .
  2. Sorts those prices from lowest to highest.
  3. For each percentile p , computes the position pos = (p / 100) × (N − 1) .
  4. If pos falls between two sorted values, it interpolates linearly between them. Otherwise it takes the value at pos directly.

This is the same “linear” method used by pandas rolling().quantile() and NumPy’s default percentile. I reproduced the algorithm in Python and compared it with pandas on a 500-bar series: the largest difference was about 2×10⁻¹³, which is floating-point noise. The first InpPeriod − 1 bars have no values, exactly like pandas with a full-window requirement.

For reference, with the default window of 50 the 25th percentile sits at sorted position 12.25 and the 75th at position 36.75, so both are interpolated values and not actual prices.

3. Inputs

Input

Default

Meaning

Valid range

InpPeriod

50

Rolling window size in bars.

Integer of at least 2 (see section 8)

InpP75

75.0

Upper percentile. Despite the name, it can be set to 90, 95, 99, etc.

Above InpP25 , at most 100

InpP25

25.0

Lower percentile.

At least 0, below InpP75

InpPriceType

PRICE_CLOSE

Price series ranked: Open, High, Low, Close, Median, Typical or Weighted.

Any ENUM_APPLIED_PRICE

The median percentile is fixed at 50 and has no input.

Important: version 1.00 does not validate these inputs. Values outside the ranges above can stop the indicator with an array-out-of-range error. See section 8.

4. Choosing your settings

Percentile pair

Pair

Band contains

Typical use

25 / 75

The middle 50% of prices (interquartile range)

Value area and equilibrium. Price is outside it about half the time, so it is a context tool, not a trigger.

10 / 90

Middle 80%

Balanced: frequent enough to be useful, selective enough to mean something.

5 / 95

Middle 90%

Stretch zones for fade or sweep setups.

1 / 99

Middle 98%

Near-extremes. With N = 50 these are almost the window high and low, so the channel behaves like a Donchian channel.

Window length

Window

Character

20–30

Fast, reacts to the current leg, noisier.

50 (default)

Intraday swing context.

100–200

Structural range or dealing-range context, slower and smoother.

The percentile of a window needs enough observations to be meaningful: below about 20 bars the 5th and 95th percentiles collapse onto the extreme values and add nothing.

Applied price

  • Close: the default and the cleanest for closing-basis rules.
  • Typical or Median: smoother, less sensitive to wicks.
  • High and Low together: attach two copies, one on High (for the upper line) and one on Low (for the lower line), to build a range channel that respects wicks. This is a common configuration when you want liquidity-sweep references.

5. Installing and attaching

  1. Save RollingPercentiles.mq5 in your terminal’s MQL5\Indicators folder.
  2. Open it in MetaEditor and compile (F7). It must report 0 errors.
  3. Attach it to a chart from the Navigator. It draws in the main chart window, not a sub-window.

Color note: the median is white by default. On a light chart template it is invisible, so change it in the indicator’s Colors tab.

6. Reading the three lines

Median (equilibrium). The middle of recent price. Price above a rising median means buyers have controlled the window; price below a falling median means sellers have. The median is robust, so a single spike barely moves it.

Band width (volatility regime). The distance between the upper and lower lines is a volatility gauge. A narrowing band means compression; a widening band means expansion. Because percentiles ignore tails, the width responds to sustained volatility rather than to one outlier bar.

Position inside the window (premium and discount). Price above the median is trading in the upper half of the recent window (premium); below it, in the lower half (discount). This maps neatly onto an equilibrium framework.

Buffer indices for EA or iCustom use: buffer 0 is the upper percentile, buffer 1 is the median and buffer 2 is the lower percentile. Note that the upper line is index 0 and the lower line is index 2.

One property you must understand

The window includes the current bar, and the bands are percentiles of price itself. By construction, price spends roughly 25% of the time above the 75th percentile and 25% below the 25th. A close above the upper line is therefore common and is not a breakout signal on its own. Use a high percentile (95 or 99), or combine the lines with market structure.

7. Example trading frameworks

These are process templates, not signals. Every one of them requires confirmation from market structure and session context, and a clear invalidation.

A. Range fade at the extreme (ranging regime)

  • Context: band width flat or contracting, median roughly flat, no break of structure on the higher timeframe.
  • Setup: price sweeps beyond the 5th or 95th percentile line, takes obvious liquidity (equal highs or lows), and closes back inside the band.
  • Entry: on the close back inside the band.
  • Stop: beyond the sweep extreme plus 0.5 × ATR(14).
  • Target 1: the median (close roughly half the position). Target 2: the opposite 25th or 75th line.
  • Risk: fixed fractional, 0.25–0.50% of equity per trade. Skip the trade if the target is under 1.5R.

B. Trend continuation off the median (trending regime)

  • Context: median sloping clearly, band width expanding, higher-timeframe structure making HH/HL (or LH/LL).
  • Setup: pullback to the median in discount (long) or premium (short), with a CHoCH or an order-block reaction on the lower timeframe.
  • Entry: on the confirmation candle’s close.
  • Stop: beyond the pullback swing, or beyond the structural low or high, with ATR padding.
  • Target: the 90th or 95th percentile line, then trail behind structure.
  • Risk: 0.25–0.75% per trade, with hard daily and weekly loss limits. No averaging down.

Avoid: trading every touch of the 25/75 lines. The lines say where price is in its recent distribution, not why it will reverse.

8. Comparison with the nearest similar indicator

The nearest built-in MT5 equivalent is Bollinger Bands. It has the same structure: three lines, one window, one applied price, a centre line and an upper and lower envelope. Donchian Channel is the limiting case of this indicator (percentiles 0 and 100 are the window minimum and maximum). I confirmed that numerically in the pandas test: the 100th-percentile line equals the rolling maximum.

Aspect

Rolling Percentiles

Bollinger Bands

Centre line

Median (50th percentile)

Moving average (SMA by default)

Envelope

Chosen percentiles of actual prices

Mean ± k × standard deviation

Distribution assumption

None

Roughly normal

Outlier sensitivity

Low

High: a spike inflates the deviation for the whole window

Band width meaning

Spread of the middle X% of prices

A multiple of dispersion

Fat tails (FX, gold)

Handles naturally

Bands under- or over-estimate real extremes

Coverage

Fixed by design (a 5/95 pair always holds 90% of the window)

Varies with the shape of the distribution

Window weighting

Equal weight, so lag is similar to an SMA

Equal weight (SMA mode)

Parameters

Window, two percentiles, price

Window, deviation multiple, shift, price

Computation cost

Sort per bar (heavier)

Running sums (very light)

Shift and style options

None in v1.00

Yes

Outlier test (synthetic). On a simulated 500-bar random walk with window 50, I added a single 40-point spike inside one window. A standard 2σ Bollinger band width grew from 4.69 to 23.08 (about 4.9 times wider), while the 25/75 percentile band width went from 1.77 to 1.79. For news spikes and stop-run wicks this is the practical advantage: the percentile bands keep describing where most trading happened.

Where Bollinger Bands are still better: very fast computation, built-in shift and style options, and a widely shared convention (20, 2) that other traders recognise. Where Rolling Percentiles is better: skewed or spiky instruments, liquidity-sweep work, and stable range references.

9. Review findings and known limitations in v1.00

The core algorithm is correct. The weaknesses are all in robustness and polish.

#

Finding

Severity

Recommended fix

1

No input validation. InpPeriod of 0 or less gives a negative start index and an array-out-of-range stop. Percentiles above 100 (or below 0) index outside the window. I reproduced this in the pandas-equivalent test: 101 raises an index error.

High

Validate in OnInit and return INIT_PARAMETERS_INCORRECT with a printed reason. Require period of at least 2, 0 ≤ lower < upper ≤ 100.

2

Inverted percentiles are silently accepted (lower input above upper input), so the colours and labels lie.

Medium

Same validation, or swap automatically.

3

Per-bar allocation and full sort. A new array is created and re-filled for every bar, with the applied price recomputed for each element. Cost is roughly bars × window × log(window), noticeable on large windows and long history.

Medium

Compute the price once per bar into an array. Reuse one window buffer. For heavy use, keep an incrementally sorted window (binary search insert/remove), which makes each bar roughly linear in the window.

4

Static plot labels. The Data Window always says “75th” and “25th”, even if you set 90 and 10.

Low

Set labels in OnInit with PlotIndexSetString(..., PLOT_LABEL, ...) .

5

No PLOT_DRAW_BEGIN and no explicit empty-value fill for the warm-up bars. It works because the terminal initialises buffers to the empty value, but it is better to be explicit.

Low

Set PLOT_DRAW_BEGIN to InpPeriod − 1 and PLOT_EMPTY_VALUE to EMPTY_VALUE .

6

White median is invisible on light templates.

Low

Choose a neutral colour such as gold or dodger blue.

7

No short name.

Low

IndicatorSetString(INDICATOR_SHORTNAME, ...) showing the period and percentiles.

8

Live-bar behaviour (by design). The newest bar is included in its own window, so the lines at the last bar move every tick. Closed bars do not change.

Info

Use bar-close values (shift 1) in any EA or rule.

What is correct and worth keeping: the series direction handling (arrays are used oldest to newest, consistently), the incremental recalculation from prev_calculated − 1 , the clean OnCalculate return value, and the interpolation math.

10. Troubleshooting

The indicator disappears right after attaching, with an “array out of range” message in the Experts or Journal log. Check the inputs against the table in section 3. This is the unvalidated-input issue.

No lines are drawn. Either the chart has fewer bars than InpPeriod , or history is still loading. Scroll back or wait for the history to finish downloading.

I can’t see the median. It is white on a white chart. Change its colour in the Colors tab.

The last value keeps changing. Expected: the live bar is still inside its own window. Closed bars never change.

Terminal is slow with a big window. Reduce InpPeriod , reduce the number of bars loaded on the chart, or ask for the optimised incremental version.

11. Quick reference

Item

Value

Window

Chart (main)

Plots and buffers

3 and 3

Buffer 0

Upper percentile (green line)

Buffer 1

Median (white thick line)

Buffer 2

Lower percentile (red line)

Method

Sorted window, linear interpolation (pandas-compatible)

First valid bar

InpPeriod − 1

Repaints

Last bar only, until it closes

Safe starting settings

50 bars, 10 / 90, Close


Produits recommandés
Round Level MT5
Szymon Palczynski
3.5 (2)
The fact that round number levels have a significant influence on the market cannot be denied and should not be overlooked. These psychological levels are used by both retail Forex traders and major banks that deal in Forex.  Very simple and effective indicator and most importantly free. ////////////////////////////////////////////////////////////////////////////////////////////////////////////////////////////////////////////////////////////// The program does not work in the strategy tester.
FREE
Free automatic Fibonacci is an indicator that automatically plots a Fibonacci retracement based on the number of bars you select on the BarsToScan setting in the indicator. The Fibonacci is automatically updated in real time as new highest and lowest values appears amongst the selected bars. You can select which level values to be displayed in the indicator settings. You can also select the color of the levels thus enabling the trader to be able to attach the indicator several times with differe
FREE
MT4 Version Most indicators draw lines. This one draws the battlefield. If you ever bought an EA or indicator based on a perfect equity curve — and then watched it bleed out live — you’re not alone. The problem? Static logic in a dynamic market. Fibonacci Bollinger Bands   adapts. It combines Bollinger structure with customizable Fibonacci levels to mark   zones of control   — where price reacts, pauses, or reverses. No magic. Just logic that follows volatility. Why this tool matters   It
FREE
The standard Bollinger Bands indicator has been improved by integrating additional indications from the Standard Deviation indicator (StdDev), which gives an additional filter for confirming trading signals. In addition, the color of the indicator's lines shows the beginning of a trend, its development and exhaustion. This indicator has a signal block that notifies the trader of the beginning of the trend on any time frame to which it is attached. Settings Type of messages - select the type of
FREE
TS Time Remaining
Aurelio Manuel Peral Garcia
TS Time Remaining - Indicador de Cuenta Regresiva para Velas en MetaTrader 5 El TS Time Remaining es un indicador gratuito diseñado para la plataforma MetaTrader 5 que permite a los traders visualizar en tiempo real el tiempo restante de la vela actual. Esta herramienta es especialmente útil para aquellos operadores que trabajan con estrategias basadas en la acción del precio y patrones de velas japonesas, ya que les permite anticiparse al cierre de la vela y tomar decisiones con mayor precisión
FREE
TrendVision AI
Murtadha Majid Jeyad Al-Khuzaie
TrendVision AI – Smart Trend Channels & Price Forecasting for MetaTrader 5 Discover market structure and explore potential future price direction with TrendVision AI, an advanced technical indicator for MetaTrader 5 that combines automatic trendline analysis with a machine-learning-based price forecasting model. How Does TrendVision AI Work? TrendVision AI analyzes historical candlestick data within a configurable lookback window. It automatically draws two trendlines directly on the chart:
FREE
Développement de la version précédente de l'indicateur ZigZag WaveSize MT4 ZigZag WaveSize - indicateur standard ZigZag modifié avec ajout d'informations sur la longueur d'onde en points, niveaux et différentes logiques d'alertes Améliorations générales : Adaptation du code pour MetaTrader 5 Travail optimisé avec les objets graphiques Nouveautés : Niveaux horizontaux aux extrêmes Choix du type de niveaux : horizontal/rayons/segments Filtre de niveaux liquides (non percés par le prix) Tampon po
FREE
Easy GOLD MT5
Franck Martin
3.87 (45)
Easy Gold is the latest addition to the BotGPT family. It is surprising and very powerful. It is ideal for beginners due to its simplicity.  There is absolutely nothing to do, it's 100% automated, simply indicate the percentage of risk you want to take per trade and the EA is ready. Whatever your capital, the EA takes care of everything. Optimized on (XAUUSD).  Unleash all the power with the professional version (AGI Gold) and its connection to the neural network, available in my store. My othe
FREE
Important Lines
Terence Gronowski
4.88 (24)
This indicator displays Pivot-Lines, preday high and low, preday close and the minimum and maximum of the previous hour. You just have to put this single indicator to the chart to have all these important lines, no need to setup many single indicators. Why certain lines are important Preday high and low : These are watched by traders who trade in a daily chart. Very often, if price climbs over or falls under a preday low/high there is an acceleration in buying/selling. It is a breakout out of a
FREE
Goldcrest Indicator — Free Gold Trading Signals for MetaTrader 5 Engineered for Gold. Built for Precision. Goldcrest Indicator is a free, powerful, and easy-to-use MetaTrader 5 indicator designed to help traders identify potential trading opportunities in the gold market (XAUUSD). Built using the proprietary Goldcrest signal-detection framework, the indicator monitors market conditions and displays clear BUY and SELL signals with entry prices and initial SL references directly on your chart , he
FREE
Fibonacci Moving Averages
Brendan Jonathan Stoyanowski-campbell
2 (1)
OVERVIEW The Fibonacci Moving Averages are a toolkit which allows the user to configure different types of Moving Averages based on key Fibonacci numbers. Moving Averages are used to visualise short-term and long-term support and resistance which can be used as a signal where price might continue or retrace. Moving Averages serve as a simple yet powerful tool that can help traders in their decision-making and help foster a sense of where the price might be moving next. The aim of this scrip
FREE
Alpha Edge Pro
Jestoni Santiago
5 (2)
Alpha Edge Pro – The Manual Trader’s Edge - If you prefer trading manually without stress, this indicator is for you. Get your copy now. Tired of missing the big moves or holding on to losing trades too long? Alpha Edge Pro is your new secret weapon. This high-performance, plug-and-play MT5 indicator gives you crystal-clear BUY and SELL signals — so you can trade with confidence, precision, and speed. If you prefer manual trading profitably , this indicator is made for you. Alpha Edge Pro does
FREE
Automatic fibonacci with alerts is an indicator that automatically plots a fibonacci retracement based on the number of bars you select on the BarsToScan setting in the indicator. The fibonacci is automatically updated in real time as new highest and lowest values appear amongst the selected bars. You can select which level values to be displayed in the indicator settings. You can also select the color of the levels thus enabling the trader to be able to attach the indicator several times with d
FREE
FibRetrace Zones Zones de retracement de Fibonacci du dernier mouvement FibRetrace Zones est le compagnon visuel gratuit de l'Expert Advisor FibRetrace. Il trace les niveaux de retracement de Fibonacci et met en évidence la zone de repli du dernier mouvement, pour que vous voyiez où se situent les entrées avant de trader. La zone est colorée selon la direction : vert pour les configurations haussières, rouge pour les baissières. Fonctionne sur tout symbole et toute unité de temps. FONCTIONNALITÉ
FREE
PZ Penta O MT5
PZ TRADING SLU
3.8 (5)
The Penta-O is a 6-point retracement harmonacci pattern which usually precedes big market movements. Penta-O patterns can expand and repaint quite a bit. To make things easier this indicator implements a twist: it waits for a donchian breakout in the right direction before signaling the trade. The end result is an otherwise repainting indicator with a very reliable trading signal. The donchian breakout period is entered as an input. [ Installation Guide | Update Guide | Troubleshooting | FAQ | A
FREE
Haven Key Levels PDH PDL
Maksim Tarutin
4.92 (12)
L'indicateur   "Haven Key Levels PDH PDL"   aide les traders à visualiser les niveaux clés sur le graphique. Il marque automatiquement les niveaux suivants : DO (Daily Open)   — Niveau d'ouverture du jour. NYM (New York Midnight)   — Niveau de minuit à New York. PDH (Previous Day High)   — Plus haut du jour précédent. PDL (Previous Day Low)   — Plus bas du jour précédent. WO (Weekly Open)   — Niveau d'ouverture de la semaine. MO (Monthly Open)   — Niveau d'ouverture du mois. PWH (Previous Week
FREE
RSI with alerts BDA
Laron Demetris Burrows
4.89 (28)
Cet algorithme prédit les changements de prix à court terme avec une précision de 86% *. Lorsqu'il y a un mouvement important tel que déterminé par l'ATR, lors d'une condition de surachat ou de survente, l'indicateur vous alertera. Prédit si le prix sera supérieur ou inférieur à la bougie de signal. Parfait pour le trading de réversion moyenne, les options binaires ou les contrats à terme sur des délais plus longs. L'indicateur a été testé sur 5 ans de données et a une précision de 90% pour pré
FREE
KMB Smart Pattern Analyzer PRO
Karwan Msto Mohammed Mohammed
Présentation du produit KMB Smart Pattern Analyzer PRO est un indicateur avancé d'analyse technique conçu pour détecter et classer les configurations de marché présentant un fort niveau de correspondance dans une zone du graphique définie par l'utilisateur. L'indicateur combine plusieurs moteurs d'analyse dans un seul outil professionnel : Analyse des configurations de chandeliers Reconnaissance des figures chartistes classiques Détection des structures harmoniques Analyse de structure de marché
FREE
Renko subwindow
Alexandre Vincent Traber
Overview Renko SubWindow affiche un graphique Renko en bougies colorées dans une fenêtre d'indicateur séparée, sans affecter le graphique principal. La taille de brique peut être fixe en points ou calculée dynamiquement via l'ATR pour des briques adaptatives basées sur la volatilité. How it works Reconstruit les briques Renko à partir des prix de clôture du symbole/timeframe actuel. Une nouvelle brique se forme dès que le prix dépasse la taille définie depuis la clôture de la brique précédente.
FREE
MAs crossing
Roman Ogorodnikov
5 (1)
The indicator draws three Moving Averages. Two short ones cross a long one. At the same time, the long MA changes color: If both short MAs are above the long one - first color; If both short MAs are below the long one - second color; If the two short MAs are on opposite sides of the long one - third color. All three MAs are based on closing prices with a smoothing method of "simple." cross MA cross 3 MA cross three Moving Average across Moving cross Moving crossing  MA crossing MA across MA
FREE
This indicator is an automated version of the Fibonacci retracement (Fib) indicator. Deciding the best areas to use when drawing the fib can be tricky and this  indicator was made with that in mind. When you drop it on the chart it will automatically choose the best points to draw the fib with, but in case you aren't satisfied with those regions, you can adjust it as you wish.
FREE
Trend Arrow NR
Aleksandr Bernes
Trend Arrow NR affiche des flèches d’achat et de vente avec un filtre de tendance simple : croisement d’EMA rapide/lente avec une séparation minimale mesurée en multiples d’ATR. Sans repaint (honnête) Les flèches n’apparaissent que sur les barres fermées (index tampon ≥ 1). La barre en formation ne reçoit jamais de flèche. Les flèches historiques ne bougent pas avec les nouveaux ticks. Les alertes peuvent se déclencher une fois par barre signal (popup / push / e-mail — optionnel). Paramètres - p
FREE
AC Expert
Nikolaos Pantzos
AC_Expert is structured based on a specific technical analysis indicator ( Accelerator Oscillator ) . It has many parameters so that each user can find the appropriate settings that suit their investment profile. It can work on 28 different pairs. The default parameter settings are indicative, I recommend that each user experiment to find their own settings.
FREE
Asian Range BreakOut
Wachinou Lionnel Pyrrhus Sovi Guidi
paramètres tels que le temps de range, les couleurs, les styles de ligne et les réglages risque-récompense. Visualisation des niveaux de trading – Trace automatiquement les niveaux de prix d’entrée, de stop-loss (SL) et de take-profit (TP) en fonction des conditions de breakout. Intégration fluide avec les Expert Advisors (EAs) – Prenez le contrôle total de vos stratégies automatisées en ajoutant des confirmations supplémentaires comme le RSI, les Moyennes Mobiles, la Rupture de Structure (B
FREE
AUTO Zones Order Blocks
Paballo Justice Tsoako
OrderBlockZones.mq5 is an MT5 chart indicator that automatically detects and draws Order Block support/resistance zones as colored rectangles. What it identifies: - Support (bullish OB): the last down candle before a strong upward impulse move. - Resistance (bearish OB): the last up candle before a strong downward impulse move. The zone spans that origin candle's full high-to-low range. How it filters zones: - Unbroken only — a zone is discarded once a later bar closes beyond it (below a
FREE
L'indicateur montre des niveaux ronds sur le graphique. Ils sont également appelés niveaux psychologiques, niveaux de banque ou niveaux des principaux acteurs. À ces niveaux, il y a une véritable lutte entre les haussiers et les baissiers, une accumulation de nombreux ordres, ce qui entraîne une volatilité accrue. L'indicateur s'adapte automatiquement à tout instrument et à toute période. Si le niveau 80 est cassé puis testé, il faut acheter. Si le niveau 20 est cassé puis testé, vendre. L'obje
FREE
Follow The Line MT5
Oliver Gideon Amofa Appiah
4.6 (35)
This indicator obeys the popular maxim that: "THE TREND IS YOUR FRIEND" It paints a GREEN line for BUY and also paints a RED line for SELL. (you can change the colors). It gives alarms and alerts of all kinds. IT DOES NOT REPAINT and can be used for all currency pairs and timeframes. Yes, as easy and simple as that. Even a newbie can use it to make great and reliable trades. NB: For best results, get my other premium indicators for more powerful and reliable signals. Get them here: https://www.m
FREE
CandlePro X
Murtadha Majid Jeyad Al-Khuzaie
CandlePro X — Free Professional Candle Visualizer for MetaTrader 5 CandlePro X is a free chart visualization indicator for MetaTrader 5, designed to make candlestick charts cleaner, sharper, and easier to read. If you find it difficult to quickly distinguish bullish and bearish candles, especially on busy charts, CandlePro X helps solve this problem by giving your candles stronger colors, clearer contrast, and a more professional appearance. CandlePro X does not generate trading signals, pred
FREE
Totz Smart Money Concepts (FVG + Supply/Demand + Liquidity) Totz SMC is an all-in-one Smart Money Concepts (SMC) visual indicator engineered to clean up your charts, standardise market structure identification, and highlight high-probability institutional entry zones automatically. Key Features Fair Value Gaps (FVG): Automatically plots bullish and bearish imbalance zones with custom opacity and minimum size filtering. Supply & Demand Zones: Pinpoints explosive institutional displacement b
FREE
TV MACD Pro + SNR Support/Resistance is a professional trading tool that combines TradingView-style MACD with adaptive Support & Resistance detection. This indicator includes two core modules that can be turned on or off independently. MACD Module: Features authentic TradingView MACD color scheme, teal/red histogram with volume and shrinkage differentiation. Adjustable parameters include Fast EMA (default 12), Slow EMA (default 26), Signal SMA (default 9), and histogram scale. SNR Module: Au
FREE
Les acheteurs de ce produit ont également acheté
Trend Sniper X
Sarvarbek Abduvoxobov
4.86 (42)
Trend Sniper X est un indicateur de suivi de tendance multi-unités de temps pour MetaTrader 5 qui aide les traders à identifier la direction de la tendance et les points d'inversion potentiels avec clarté et précision. pour MT4: https://www.mql5.com/en/market/product/193245 Informations sur le prix : Le prix actuel est un prix promotionnel et est susceptible de changer lors des prochaines mises à jour et nouvelles fonctionnalités. Offre bonus : Pour obtenir GRATUITEMENT l'Auto-Trade Assistant E
Un nouveau Roi en ville - Indicateur + Gestion des ordres (TP1 + TP2 + TP3) + Envoi optionnel de signaux Telegram INCLUS (GRATUIT) (SYSTÈME COMPLET DE TRADING et DE SIGNAUX) Notre meilleur EA pour l’Or : Gold Slayer Cet indicateur inclut une stratégie avancée, un système de trading avec gestion des ordres personnalisable ainsi qu’un système de retour à la moyenne combinant des extensions d’enveloppes, soutenu par plusieurs filtres intelligents de confirmation comme le RSI afin de détecter des en
Smart Trend Trading System — MetaTrader 5 Après votre achat, envoyez-moi un message sur MQL5 pour recevoir GRATUITEMENT Smart Universal Expert Advisor, ainsi que le cours en ligne, le manuel PDF et l’accès au groupe privé. STTS réunit la direction de la tendance, les signaux d’entrée et de sortie, les zones de retournement et les niveaux de prix importants directement sur votre graphique. Suivez le système manuellement ou connectez un EA compatible distinct pour une exécution automatique selon l
Zoryk Gold
Reda El Koutbane
4.76 (17)
ZORYK — Système avancé de signaux XAUUSD pour MetaTrader 5 Vous connaissez certainement cette sensation. Vous passez du temps à analyser l’or. Vous attendez le bon point d’entrée. Vous ouvrez enfin la position, puis le prix commence immédiatement à évoluer contre vous. Vous fermez trop tôt, déplacez le Stop Loss ou hésitez pendant quelques secondes. Ensuite, le marché atteint exactement l’objectif que vous aviez initialement prévu, mais sans vous dans la position. Le problème n’était pas toujour
Gardez votre avantage de trading dans votre ligne de mire ! M5 Sniper est un nouvel indicateur de MeanFX. Il combine des signaux de trading précis avec des niveaux de TP/SL adaptatifs — créant ainsi les meilleures opportunités de trading statistiques possibles ! Le prix augmente tous les 5 achats, le prochain prix est de 69$ Envoyez-moi un message après l’achat pour recevoir des conseils/un guide et un EA bonus Qu’est-ce qui le distingue ? Performance statistique éprouvée sur Gold XAUUSD ( fonct
SuperScalp Pro
Van Minh Nguyen
4.54 (37)
SuperScalp Pro - Professional Multi-Layer Confluence Scalping System SuperScalp Pro est un indicateur de scalping avancé qui améliore le Supertrend classique grâce à plusieurs filtres intelligents de confirmation. Il vous aide à identifier des opportunités de trading Buy/Sell présentant une probabilité de réussite plus élevée, tout en réduisant considérablement les faux signaux. Des flèches Buy et Sell bien visibles apparaissent directement sur le graphique, avec des niveaux de Stop Loss et de T
SMC Intraday Formula
VividMind Digital Solutions
5 (26)
Commençons par être honnêtes. Aucun indicateur ne vous rendra rentable à lui seul. Si quelqu’un vous dit le contraire, il vous vend un rêve. Tout indicateur qui affiche des flèches parfaites d’achat/vente peut être rendu impeccable — il suffit de zoomer sur la bonne partie de l’historique et de capturer uniquement les trades gagnants. Nous ne faisons pas cela.  SMC Intraday Formula est un outil. Il lit la structure du marché pour vous, identifie les zones de prix à la probabilité la plus élevée
GoldenX Entry MT5
VividMind Digital Solutions
5 (17)
GoldenX Entry est un indicateur MT5 doté d’un algorithme adaptatif Smart Entry Trend, d’un système de scoring des signaux, d’un détecteur de régime de marché et d’un filtre de volatilité. Chaque signal inclut un niveau d’entrée calculé, trois niveaux de Take-Profit (TP1, TP2, TP3) ainsi qu’un niveau de Stop-Loss. Il est construit sur plusieurs couches analytiques conçues pour s’adapter à différentes conditions de marché, combinant un système analytique multicouche avec un optimiseur intégré et u
La légende est de retour : Entry Points Pro 10. La relance de l'indicateur légendaire qui s'est maintenu 3 ans dans le Top-3 du MQL5 Market. Plus de 600 avis sur les deux versions, des milliers de traders l'utilisent chaque jour, plus de 28 000 téléchargements de la démo   MT4+MT5 . J'ai lu chacun de vos avis publiés en cinq ans — et au lieu de promettre, j'ai intégré les réponses directement dans la version 10. Par un auteur présent sur les marchés depuis 1999, qui tient à l'honnêteté, à sa rép
Auto Optimized SpeedAngle est un système de vectorisation du momentum de niveau institutionnel qui élimine l'ajustement de courbe ( curve-fitting ) grâce à une optimisation continue par avancement ( Walk-Forward Optimization , WFO). Plutôt que de s'appuyer sur des entrées statiques qui se dégradent lorsque les régimes de marché changent, l'indicateur recalibre dynamiquement ses paramètres en utilisant une validation hors échantillon ( Out-of-Sample , OOS), garantissant ainsi que les signaux affi
Gann Made Easy   est un système de trading Forex professionnel et facile à utiliser qui est basé sur les meilleurs principes de trading en utilisant la théorie de mr. WD Gann. L'indicateur fournit des signaux d'ACHAT et de VENTE précis, y compris les niveaux Stop Loss et Take Profit. Vous pouvez échanger même en déplacement en utilisant les notifications PUSH. VEUILLEZ ME CONTACTER APRÈS L'ACHAT POUR RECEVOIR GRATUITEMENT DES INSTRUCTIONS DE TRADING ET D'EXCELLENTS INDICATEURS SUPPLÉMENTAIRES! V
ARIPoint
Temirlan Kdyrkhan
1 (4)
ARIPoint is a powerful trading companion designed to generate high-probability entry signals with dynamic TP/SL/DP levels based on volatility. Built-in performance tracking shows win/loss stats, PP1/PP2 hits, and success rates all updated live. Key Features: Buy/Sell signals with adaptive volatility bands Real-time TP/SL/DP levels based on ATR Built-in MA Filter with optional ATR/StdDev volatility Performance stats panel (Success, Profit/Loss, PP1/PP2) Alerts via popup, sound, push, or email Cu
Adaptive Price Action Engine Achetez un indicateur, obtenez l'EA gratuitement Analyse auto-optimisée des tendances et des figures de chandeliers Multi-Timeframe Les marchés évoluent constamment, et tous les modèles de Price Action n’ont pas la même valeur dans toutes les conditions de marché. Adaptive Price Action Engine a été conçu pour s’adapter aux changements du marché en combinant structure de tendance, analyse Multi-Timeframe, figures de chandeliers et optimisation statistique au sein d’un
M1 Sniper MT5
Oleg Rodin
5 (7)
M1 SNIPER   est un système d'indicateurs de trading facile à utiliser. Il s'agit d'un indicateur à flèche conçu pour l'unité de temps M1. Cet indicateur peut être utilisé seul pour le scalping sur l'unité de temps M1 ou intégré à votre système de trading existant. Bien que conçu spécifiquement pour le trading sur l'unité de temps M1, ce système peut également être utilisé avec d'autres unités de temps. Initialement, j'avais conçu cette méthode pour le trading du XAUUSD et du BTCUSD. Cependant, j
Tokyo mt5 Indicator
Vasiliy Strukov
5 (12)
Le Tokyo Indicator offre une vue d'ensemble visuelle et claire de l'orientation de la tendance, des signaux de trading potentiels et des conditions du marché. Sa ligne de tendance en escalier, codée par couleur, distingue les phases haussières (en bleu) des phases baissières (en magenta). Des flèches directionnelles associées mettent en évidence les opportunités d'achat et de vente potentielles lors des changements de tendance. Un tableau de bord intégré regroupe le signal actuel, l'orientation
Gold Entry Sniper
Tahir Mehmood
5 (21)
Gold Entry Sniper – Tableau de Bord ATR Multi-Unités de Temps pour Scalping et Swing Trading sur l'Or Gold Entry Sniper est un indicateur avancé pour MetaTrader 5 qui fournit des signaux d'achat/vente précis sur XAUUSD et autres actifs, basé sur la logique de Trailing Stop ATR et l' analyse multi-unités de temps . Caractéristiques et Avantages Clés Analyse Multi-Unités de Temps – Affiche les tendances en M1, M5, M15 sur un seul tableau. Trailing Stop Basé sur l'ATR – Ajuste automatiquement selon
Prochaine mise à jour — Version 2.52 bientôt disponible ! [NOUVEAU] Préparez-vous à découvrir 4 nouvelles fonctionnalités majeures conçues pour améliorer votre analyse du marché et votre flux de travail de trading Nous faisons passer l’analyse du marché au niveau supérieur avec 4 nouvelles fonctionnalités conçues pour répondre à vos besoins en trading. Découvrez : 1. TRADE OVERVIEW DASHBOARD 2. CONFLUENCE AT ZONE 3. STRONG & WEAK HIGH/LOW 4. OTE 1. TRADE OVERVIEW DASHBOARD Un tableau de bord qu
Boba Analysis Suite
Trade Ready Solutions LLC
5 (2)
Boba Analysis Suite Boba Analysis Suite est un indicateur d’analyse pour MetaTrader 5. Il réunit la structure du marché, les zones de prix pertinentes et le contexte général du marché dans une même vue graphique. Développé à partir de l’expérience pratique d’un trader et formateur en trading, il accompagne une démarche d’analyse structurée : évaluer la direction du marché, identifier les niveaux importants et analyser plusieurs unités de temps conjointement. Une analyse en contexte La significat
FiboSniper Pro
Van Minh Nguyen
5 (4)
FiboSniper Pro – Multi-Filter Fibonacci System with Auto SL/TP and Control Panel FiboSniper Pro est un indicateur technique qui combine des Fibonacci Envelopes dynamiques avec plusieurs filtres de confirmation afin de générer des signaux Buy et Sell sélectionnés. Les niveaux de Fibonacci sont calculés à partir de Moving Average et ATR, puis filtrés par ADX, EMA, RSI, ATR, Volume, Time et la structure des bougies. L’indicateur affiche directement sur le graphique les niveaux automatiques de Stop
Break and Retest Hunter
Mohamed Hassan
3.67 (3)
Break and Retest Hunter is a powerful MetaTrader 5 indicator designed to automatically identify support and resistance levels, breakout structures, and potential retest opportunities in real time. Bonus Indicator: After purchasing Break and Retest Hunter , contact me to receive Trade Indicator Assistant EA completely free as a bonus utility. $65 for the next 10 copies . Next price is $120.  Combining adaptive market analysis, clear BUY/SELL signals, Fibonacci-based profit targets, and a premiu
Trend Catcher ind mt5
Ramil Minniakhmetov
5 (18)
INDICATEUR DE DÉTECTEUR DE TENDANCE L'indicateur de détecteur de tendance analyse les mouvements de prix du marché grâce à une combinaison d'indicateurs d'analyse de tendance adaptatifs, propriétaires et personnalisés. Il identifie la véritable direction du marché en filtrant les fluctuations à court terme et en se concentrant sur la force de la dynamique sous-jacente, l'expansion de la volatilité et la structure des prix. Il utilise également une combinaison d'indicateurs personnalisés de lis
Power Candles MT5
Daniel Stein
4.58 (12)
Power Candles V3 - Indicateur de force à optimisation automatique Power Candles V3 transforme la force des devises et des instruments en un plan de trading exploitable sur chaque graphique auquel il est associé. Au lieu de se contenter de colorer les bougies, il effectue une optimisation automatique en temps réel en arrière-plan et vous fournit les meilleurs niveaux de Stop Loss, Take Profit et seuils de signal pour le symbole que vous avez sous les yeux. Un simple clic suffit pour l'adopter en
Gold Trend Coach MT5
Cristhian Alexander Gaibor Cuasquer
5 (2)
Gold Trend Coach est un indicateur de tendance pour l'or (XAUUSD) sur MetaTrader 5 avec des signaux d'achat et de vente, un stop loss et trois objectifs de take profit, confirmés à la clôture de la bougie, un tableau de bord coach multi-unités de temps et des alertes sur votre téléphone et sur Telegram. Conçu pour le scalping en M5 et l'intraday en M15 pendant les sessions de Londres et de New York. Gold Trend Coach : signaux de tendance sur l'or XAUUSD avec entrée, stop et trois objectifs. Prix
Neuro Poseidon MT5
Daria Rezueva
4.75 (52)
Neuro Poseidon is a new indicator by Daria Rezueva. It combines precise trading signals with adaptive TP/SL levels - creating best possible trades as a result! Message me and get  Neuro Poseidon Assistant  as a gift to automize your trading process! What makes it stand out? 1. Proven profitability on all assets and timeframes 2. Only confirmed BUY and SELL signals present on the chart 3. Adaptive TP & SL levels generated by the software for each trade 4. Easy to understand - suitable for al
Unix Scalper
Issam Kassas
4 (4)
Unix Scalper — MetaTrader 5 Après votre achat, envoyez-moi un message sur MQL5 pour recevoir GRATUITEMENT Smart Universal Expert Advisor, ainsi que le cours en ligne, le manuel PDF et l’accès au groupe privé. Repérez la configuration. Consultez le plan. Choisissez comment intervenir. UNIX Scalper réunit l’analyse du marché, les décisions BUY/SELL/WAIT et les niveaux Entry, Stop Loss, TP1 et TP2 dans un panneau organisé. VISUALISEZ LE SIGNAL ET LE PLAN • Des décisions claires : BUY, SELL ou WAIT.
Présentation       Quantum Breakout PRO   , l'indicateur révolutionnaire MQL5 qui transforme la façon dont vous négociez les zones d'évasion ! Développé par une équipe de traders expérimentés avec une expérience commerciale de plus de 13 ans,       Évasion quantique PRO       est conçu pour propulser votre parcours commercial vers de nouveaux sommets grâce à sa stratégie de zone de discussion innovante et dynamique. Quantum Breakout Indicator vous donnera des flèches de signalisation sur les z
FX Trend MT5 NG
Daniel Stein
5 (6)
FX Trend NG : La Nouvelle Génération d’Intelligence de Tendance Multi-Marchés Vue d’ensemble FX Trend NG est un outil professionnel d’analyse de tendance multi-timeframe et de surveillance des marchés. Il vous permet de comprendre la structure complète du marché en quelques secondes. Au lieu de naviguer entre de nombreux graphiques, vous identifiez immédiatement quels instruments sont en tendance, où le momentum s’affaiblit et où plusieurs unités de temps sont alignées. Offre de Lancement – Ob
Indicateur de force et de momentum multi-devises MT5 Dynamic Forex28 Navigator est l'évolution de nos indicateurs populaires de longue date et réunit la puissance de trois outils en un : Advanced Currency Strength28 Indicator (700 avis) Advanced Currency IMPULSE with ALERT (530 avis) CS28 Combo Signals (bonus actuel) Les deux indicateurs précédents totalisent plus de 1 200 avis sur le MQL5 Market et font partie des outils incontournables de la communauté MT4 depuis 2016. Dynamic Forex28 Navigato
Scalper Vault est un système de trading puissant et complet, conçu pour les traders en quête de régularité dans le cadre du trading intrajournalier. Cet indicateur de haute précision constitue un système de trading autonome et exhaustif, offrant des analyses de qualité institutionnelle, aussi bien pour le Forex que pour les options binaires. VEUILLEZ ME CONTACTER APRÈS VOTRE ACHAT POUR OBTENIR MES CONSEILS DE TRADING AINSI QU'UN EXCELLENT BONUS ! En éliminant les incertitudes et les analyses man
Volatility Master for MetaTrader is a real-time dashboard tool that scans up to  50 symbols  to identify high-volatility , trending markets instantly. With bullish/bearish signals, customizable alerts, and a user-friendly interface, it helps you avoid range-bound conditions and focus on high-probability trades. Clarity leads to confidence. Trade confidently and protect your capital effectively with this powerful dashboard. We don't offer free or bonus indicators in exchange of reviews from you.
Plus de l'auteur
Zenova
Rex Velos
Zenova – Futuristic Zen Trading for EURUSD H1 (Introductory Release) Discover the calm power of disciplined, patient trading. Slowly but surely. Zenova is a premium Expert Advisor meticulously crafted and extensively tested exclusively for the EURUSD pair on the H1 timeframe . It combines precise trend detection (ADX strength + RSI divergence filters) with intelligent price action confirmation to enter only high-probability, slow-moving trends—delivering a proven win rate of ~89% and a solid pro
QuietPip — EURUSD Volatility-Regime Scalper High Historical Profit Factor. Low Historical Drawdown. Selective Trading. QuietPip is a specialized Expert Advisor for MetaTrader 5, designed to trade EURUSD when market conditions are favorable and stand aside when volatility expands. Rather than chasing every market movement, QuietPip waits for specific price-action conditions, applies a volatility filter, and manages each position with a predefined stop loss and an automated trailing stop. The obj
Filtrer:
Aucun avis
Répondre à l'avis