Manzano Quant Engine
- Индикаторы
- Версия: 1.0
- Активации: 10

Manzano Quant Engine
Advanced Statistical Market Structure, Volume Analysis and Decision Support Framework for MetaTrader 5
Manzano Quant Engine is an advanced analytical indicator that combines adaptive trend modelling, statistical deviation analysis, volume-based market structure, multi-timeframe confirmation, and quantitative scoring — all within a single visual framework.
Its objective is not to predict future prices, but to help traders interpret market behaviour more effectively and make informed decisions based on objective data.
Main Features
• Adaptive Trend Modelling (Linear and Polynomial modes)
• Dynamic Statistical Channels — ±1, ±2 and ±3 Standard Deviation bands
• Volume Profile with Point of Control (POC) detection
• High Volume Nodes (HVN) and Low Volume Nodes (LVN) identification
• Statistical Z-Score Analysis
• Automatic Market Regime Classification — Trend, Range, Expansion, Compression
• Multi-Timeframe Confirmation Matrix
• Long and Short Opportunity Scores (0–100)
• Professional Decision Support Dashboard
• Automatic Trade Planning — Entry Zone, Stop, TP1 / TP2 / TP3
Statistical Channels and Z-Score
The indicator plots ±1, ±2 and ±3 Standard Deviation bands around the regression curve, defining normal, extended, and extreme price zones. The Z-Score measures the current price distance from fair value in standard deviation units.
• Z ≈ 0 — Price near fair value
• Z > +2 / Z < -2 — Price significantly extended
• Z > +3 / Z < -3 — Statistically rare extreme
Volume Profile and POC
Volume distribution is analysed relative to the regression model to identify value areas, acceptance and rejection zones, and potential dynamic support/resistance levels.
The Point of Control (POC) marks the price level with the highest volume concentration. The dashboard displays POC Level, POC Z-Score, and POC Strength for full context.
HVN areas indicate strong market acceptance. LVN areas represent transition zones where price may move more rapidly.
Market Regime Classification
TREND: Directional movement with clear structural bias.
RANGE: Balanced conditions without dominant directional pressure.
EXPANSION: Elevated volatility following compression. Late entries carry higher risk.
COMPRESSION: Low volatility consolidation. A breakout in either direction may follow.
Signal Scoring System and MTF Confirmation
Two quantitative scores (0–100) continuously measure bullish and bearish alignment across directional bias, proximity to key statistical levels, candle structure, and multi-timeframe confirmation.
The Multi-Timeframe Matrix automatically selects relevant timeframes and displays their directional status. Higher agreement across timeframes indicates stronger directional conditions.
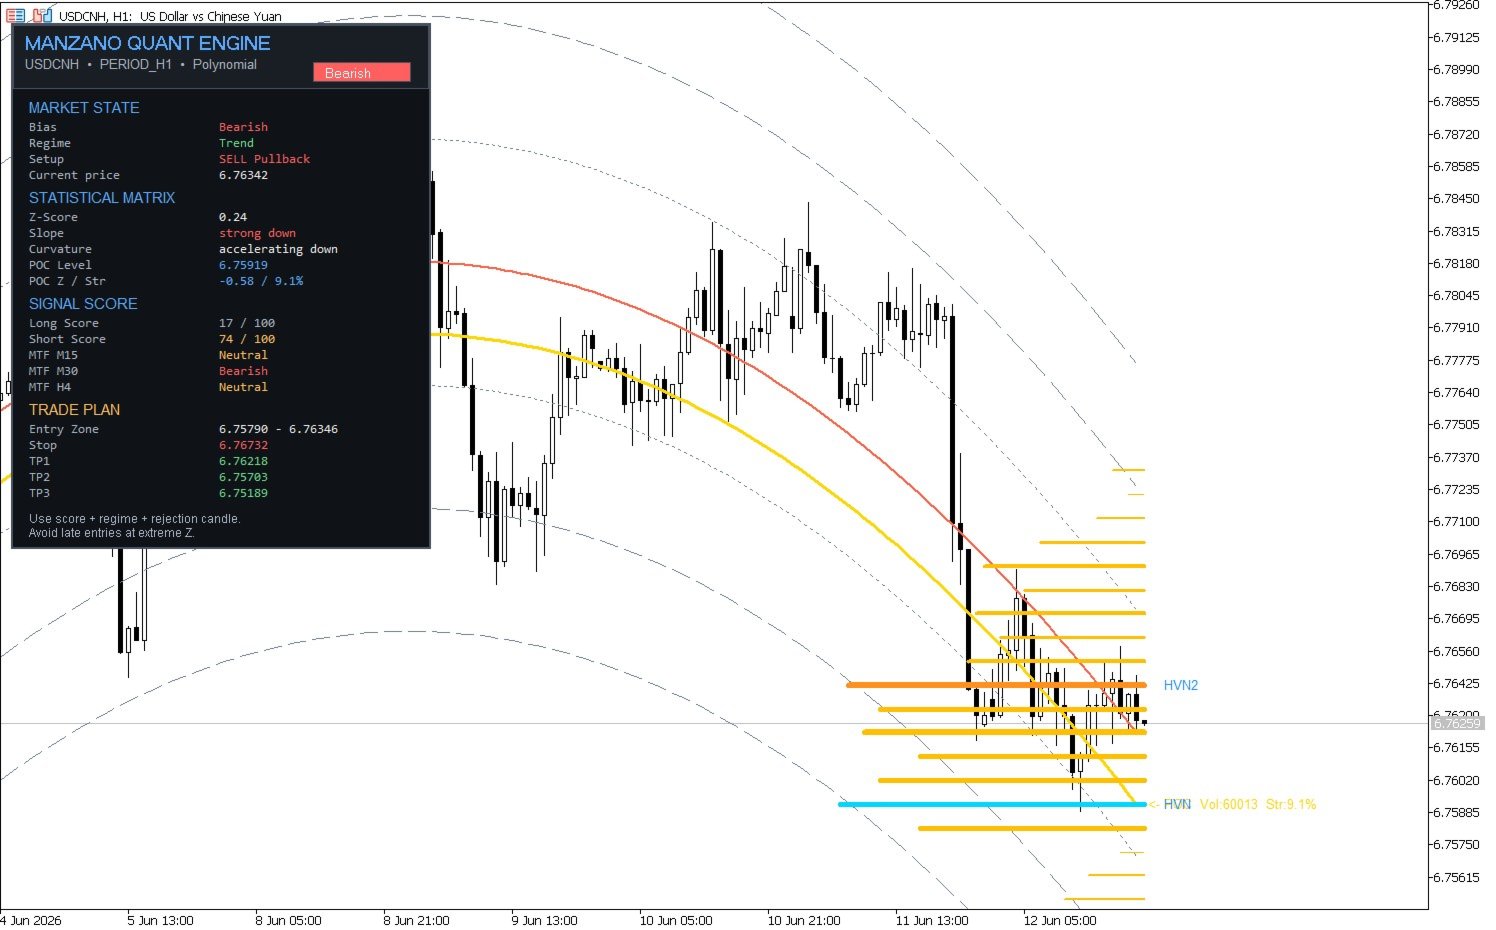
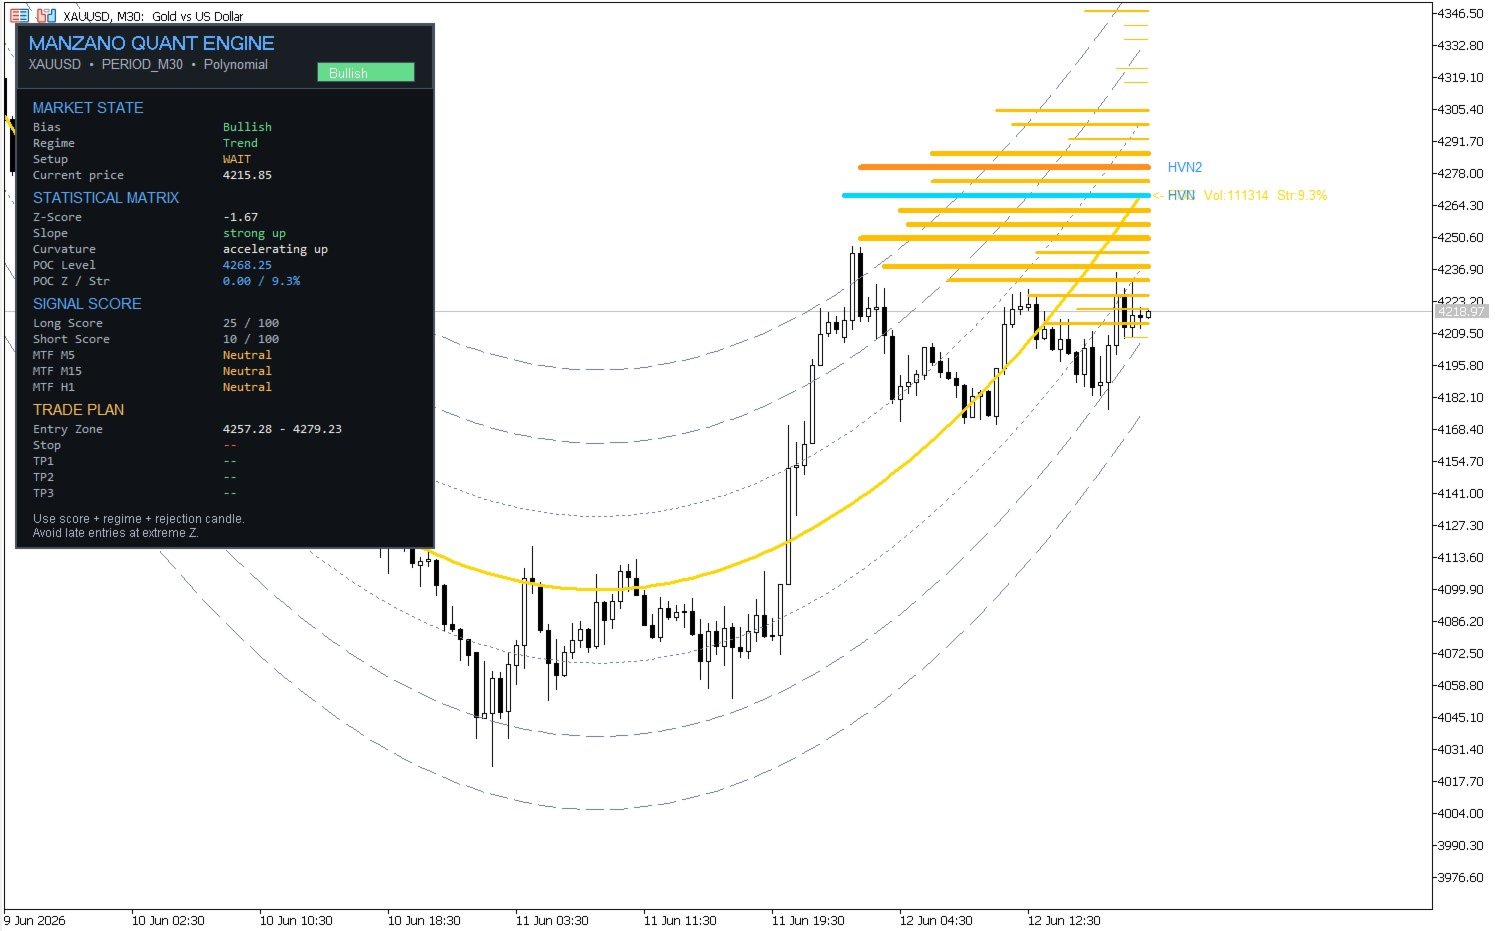
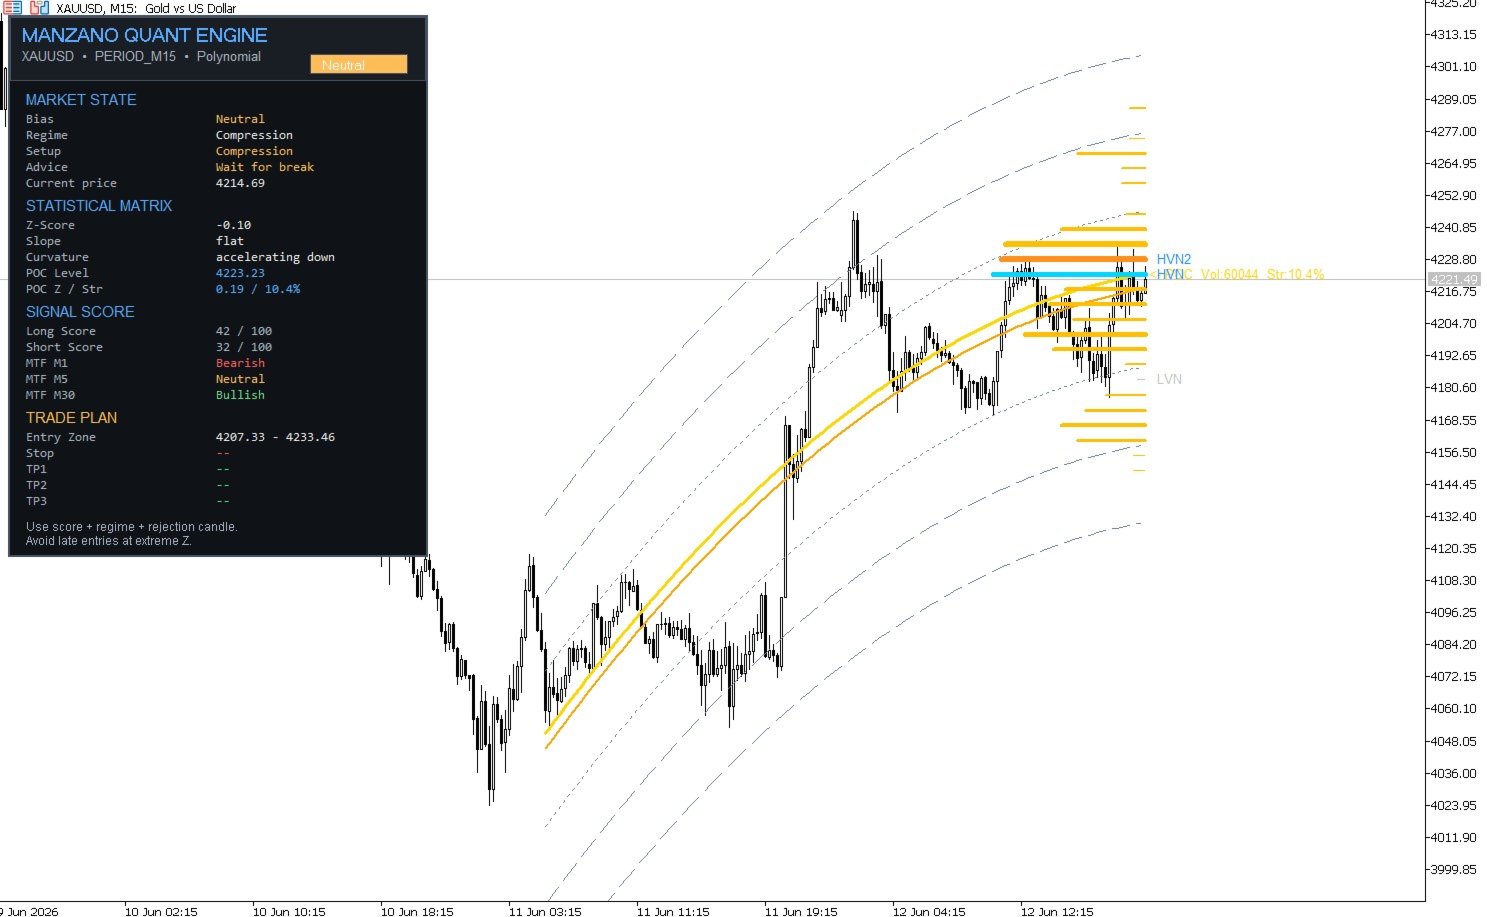
Dashboard
The integrated dashboard displays: Bias, Regime, Setup, Current Price, Z-Score, Slope, Curvature, POC Level, POC Strength, Long Score, Short Score, MTF Status, Entry Zone, Stop, TP1 / TP2 / TP3.
How to Use
1. Identify the Market Regime. 2. Read the Directional Bias and regression curve. 3. Check Multi-Timeframe alignment. 4. Evaluate Z-Score and POC position. 5. Review the Signal Score. 6. Use Entry Zone, Stop and Targets as statistical reference points — always apply your own risk management.
Input Parameters
Lookback Period: Bars used for regression and volume profile calculation.
Price Source: Price component for regression (Median, Typical, Close, etc.).
Regression Mode: Linear or Polynomial.
Display options: Toggle POC Curve, Volume Profile, Dashboard, HVN/LVN labels, tick updates.
MTF Settings: Enable/disable confirmation. Auto-resolve timeframes from chart TF.
Colours & Panel: Fully customisable colours, adaptive colouring, panel position and size.
Recommended Markets and Timeframes
Markets: Forex, Indices, Commodities, Stocks, Cryptocurrencies.
Timeframes: M15, M30, H1, H4, Daily.
Important Notice
Manzano Quant Engine is an analytical tool. It does not place orders or manage positions. No indicator guarantees profits or predicts future price movements. All trading involves risk. Always test in a demo environment before trading with real capital.
Web: http://manzanotrading.com
Email: info@manzanotrading.com