LineTraderPro2 MTF Horizontal Lines MT5

  • Индикаторы
  • Naoto Shimoda
    Naoto Shimoda
    FX.Hamrat - MetaTrader 4/5 indicator and Expert Advisor developer based in Japan.
    Over 10 years of trading experience (discretionary and systematic), and 90+ MT4/MT5 programs built so far - including 30+ custom-made projects for individual traders.
  • Версия: 2.12
  • Обновлено: 29 сентября 2026
  • Активации: 10

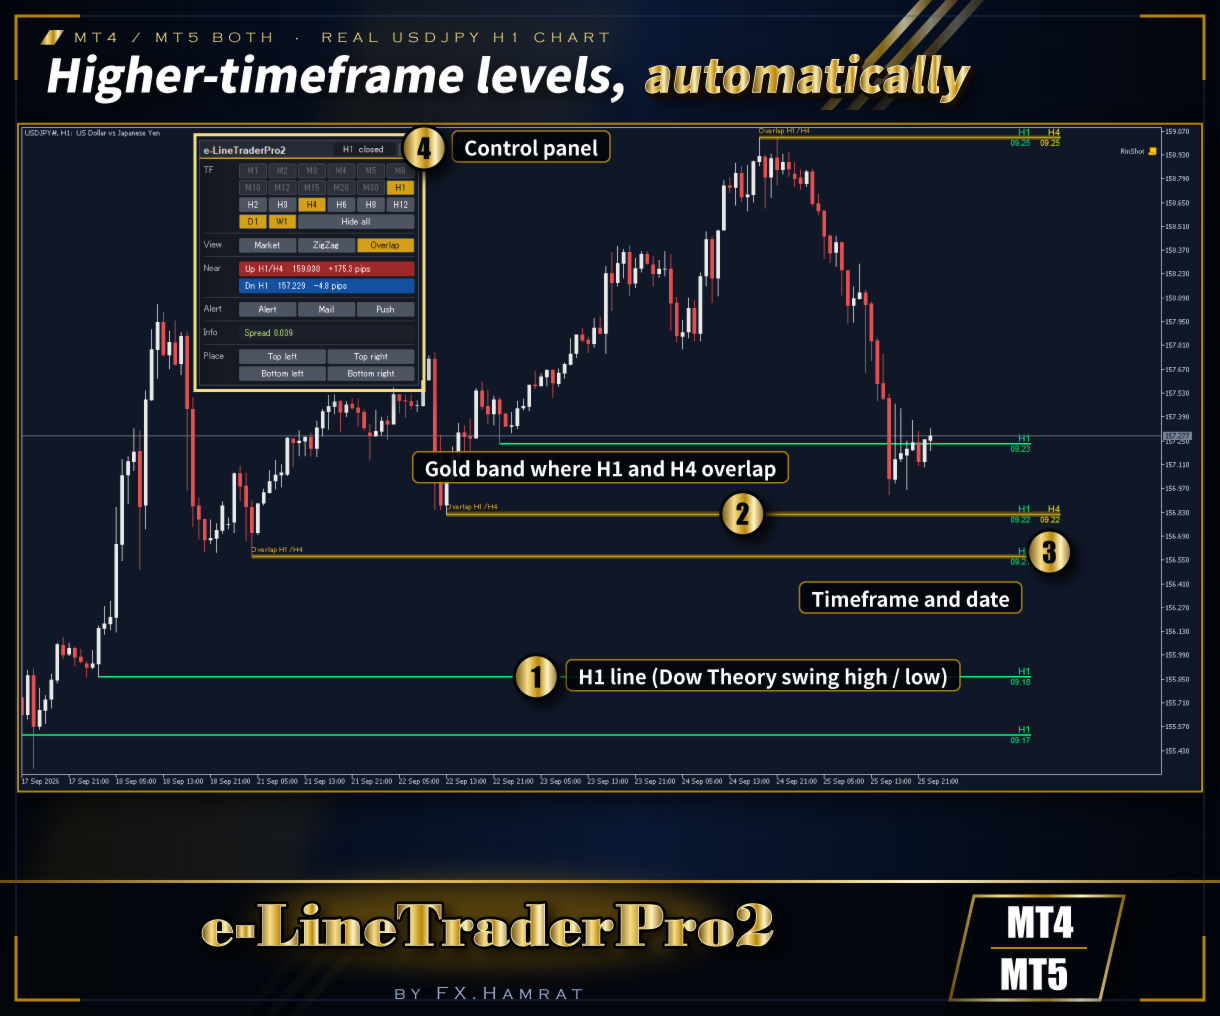
The levels of higher timeframes, on the chart you are watching.

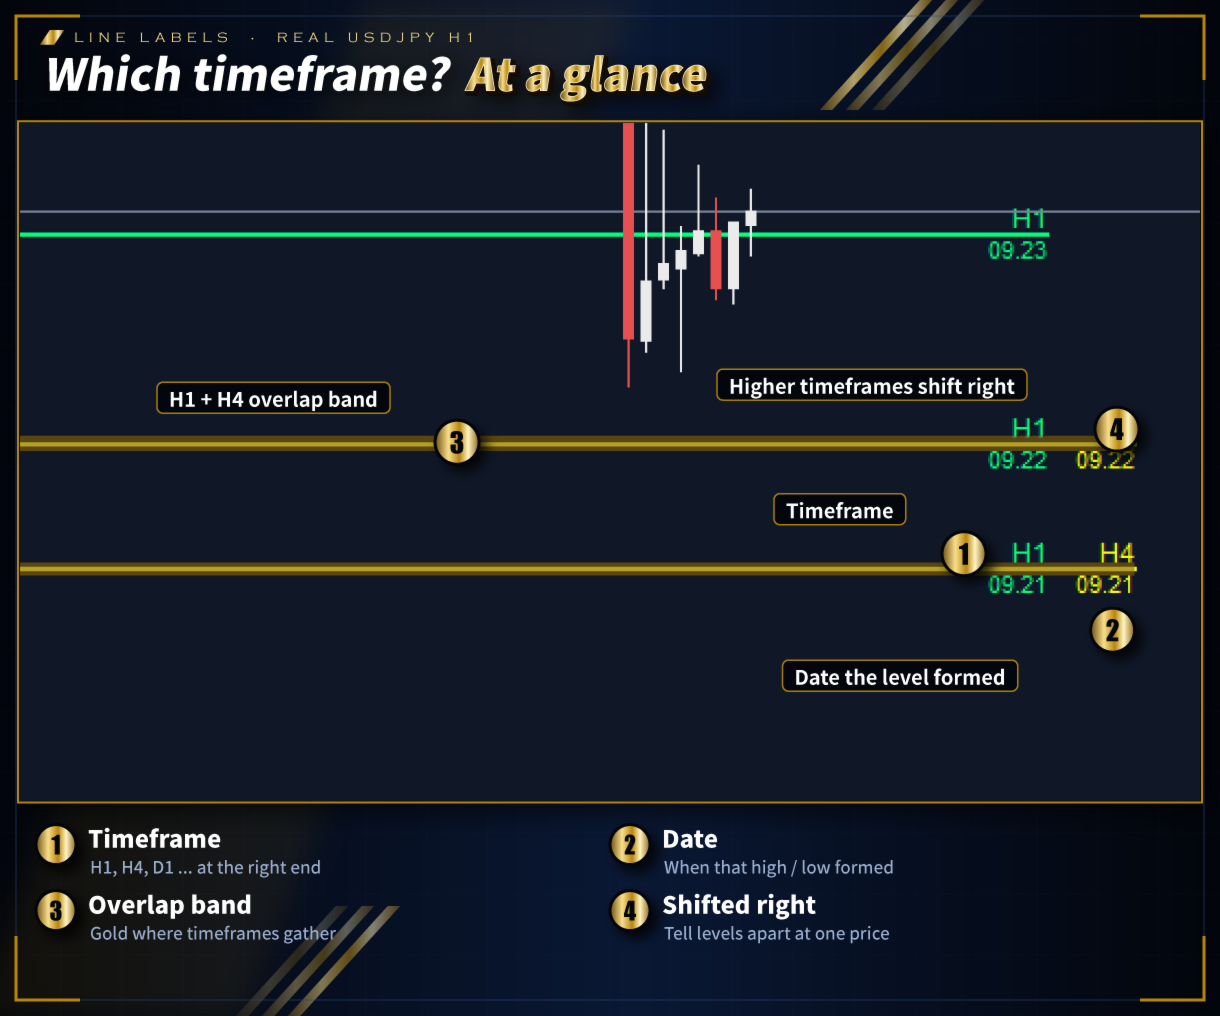
LineTraderPro2 finds swing highs and lows with Dow Theory rules and draws horizontal lines at the levels the market watches, for any of 20 timeframes from M1 to W1. Each line is labeled with its timeframe (H1, D1 and so on) and the date of the swing, so you can see at a glance which timeframe a level belongs to without switching charts.

What you see on the chart

  • Horizontal lines: the swing highs above the price and the swing lows below it, nearest first, for every timeframe you turn on.
  • Labels at the right end of each line: timeframe name and start date. Higher timeframes are shifted to the right so lines at the same price stay readable.
  • Dow Theory zigzag: swing highs and lows joined by a line, for the timeframes shown.
  • Sessions: Tokyo, London and New York drawn as boxes of their high-low range (charts up to H1). Daylight saving time switches automatically.
  • Spread and the time left until the current bar closes.
  • Control panel: one button per timeframe (M1, M2, M3, M4, M5, M6, M10, M12, M15, M20, M30, H1, H2, H3, H4, H6, H8, H12, D1, W1), plus Market, Dow and Del. Drag it to move it.

Details

  • Calculation uses confirmed bars only.
  • Only timeframes equal to or higher than the chart are shown.
  • Works on any symbol.
  • Button language: English or Japanese.
  • No DLL, no external connection.

Inputs (main)

  • Swing bars on each side (default 4)
  • Bars to calculate (default 5,000)
  • Timeframe name and start date labels, and the clock for the date (server time or PC clock)
  • Color and width of the lines for each timeframe
  • Server offset in winter (2 for many brokers) and the colors and hours of the three sessions
  • Panel: show, placement and position

Notes

  • This indicator shows the state of the market. It does not place trades and does not guarantee any result.
  • The demo version of an indicator runs only in the Strategy Tester (visual mode).
Рекомендуем также
Этот мульти-таймфрейм и мультисимвольный индикатор сканируют на наличие образований поглощения и пинцета. В сочетании с вашими собственными правилами и методами этот индикатор позволит вам создать (или улучшить) вашу собственную мощную систему. Функции Может одновременно отслеживать все символы, отображаемые в окне "Обзор рынка". Примените индикатор только к одному графику и мгновенно отслеживайте весь рынок. Контролирует каждый временной интервал, от M1 до MN, и отправляет вам предупреждение в
BOS CHOCH STRUCTURE DETECTOR BOS CHOCH STRUCTURE DETECTOR — это индикатор рыночной структуры для MetaTrader 5, предназначенный для определения и визуального отображения событий Break of Structure (BOS) и Change of Character (CHoCH) непосредственно на графике. Индикатор определяет максимумы и минимумы свингов с использованием настраиваемого периода Swing Lookback и отслеживает последующие закрытия ценовых свечей для обнаружения пробоев этих структурных уровней. При обнаружении структурного пробоя
Phoenix Orb Asia
Nigel Nii Darku Narnor Darko
This is a professional-grade institutional toolkit designed for breakout traders and trend followers worldwide. It specializes in the  Opening Range Breakout (ORB)  strategy—one of the most consistent ways to capture intraday volatility during the London and New York opens. This indicator does the heavy lifting for you by automatically mapping out the high and low of the first 15 minutes of any session. It combines this with  Smart Money Concepts (SMC) , identifying structural shifts like  BOS
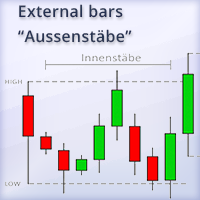
This indicator shows external bars ("Aussenstäbe") in the chart in candle form. The colors of the candles can be set individually. Also different colors for bearish and bullish bars are possible. In addition, the color of the wicks or outlines is also adjustable. Outside bars are mentioned e.g. by Michael Voigt in the book "Das große Buch der Markttechnik". All other candles are inner bars.
Veltrion Smart Fibonacci   is a clean automatic Fibonacci structure overlay for MetaTrader 5. It automatically detects recent swing highs and swing lows, then draws key Fibonacci retracement levels directly on the chart. The indicator is designed to help traders visualize market structure, retracement zones, and the golden zone without manually drawing Fibonacci tools. Key Features Automatic swing high and swing low detection Clean Fibonacci retracement overlay Horizontal Fibonacci levels for a
Этот мульти-таймфрейм и мультисимвольный индикатор сканирует пин-бары, утренние / вечерние звезды, поглощения, пинцет, трехлинейные удары, внутренние бары, а также вымпелы и треугольники.   Индикатор также можно использовать в режиме одиночного графика. Подробнее об этой опции читайте в разделе продукта.   блог .       В сочетании с вашими собственными правилами и методами этот индикатор позволит вам создать (или улучшить) вашу собственную мощную систему. Функции Может одновременно отслеживать в
Smart Pivot Points для MetaTrader 5 — Четкие уровни для умной торговли Smart Pivot Points   — это профессиональный индикатор для MetaTrader 5, который автоматически вычисляет и отображает на графике полный набор ключевых торговых уровней. Он трансформирует хаос ценового движения в понятную структурную карту, выделяя зоны поддержки, сопротивления, ценового баланса и потенциальных целей. Инструмент создан для трейдеров, которые ценят ясность, и работает на любом рынке:   Форекс, криптовалюты (Bitc
H4 Structure Entry Dashboard — профессиональный мульти-таймфреймовый торговый помощник, который объединяет рыночную структуру на H4 с подтверждением входа на H1/M15 , отображая всё через аккуратный дашборд на графике и чёткие стрелки BUY/SELL . Он создан для трейдеров, которым нужны быстрые и структурированные решения: Сначала структура (H4) → затем вход (H1/M15). Ключевые особенности Настоящая мульти-таймфрейм логика Направление/смещение старшего ТФ от H4 Подтверждение входа на H1 или M15 Инстр
PowerHouse v3 MT5 – Advanced Smart Money Concepts, KAMA Ribbon & MTF Matrix Short Summary: An institutional-grade SMC & ICT trading system featuring confirmed CHoCH/BOS market structure breaks, a 7-factor confluence engine (Grade A/B/C), adaptive trend ribbon, automated trade plans with live Won/Lost points metrics, and a 6-timeframe dashboard. Product Overview PowerHouse v3 is a professional-grade analytical indicator built for disciplined Forex, Indices, and Crypto traders on MetaTrader 5. Eng
Нарисуйте уровень и наблюдайте, как цена реагирует на него после начала отслеживания. Support Resistance Price Action для MetaTrader 5 работает с вашими горизонтальными линиями, прямоугольными зонами и трендовыми линиями: отмечает касания, отскоки и пробои, собирает статистику последующего движения. Создайте объект на графике, выделите его и нажмите Track. Индикатор сохранит его положение и время активации. События, произошедшие до этого момента, не включаются в наблюдения по активированной верс
это универсальный аналитический индикатор, сочетающий в себе классический трендовый анализ и автоматическое построение ключевых уровней Фибоначчи. Инструмент разработан в виде удобной интерактивной панели и идеально подходит как для профессиональных трейдеров, так и для новичков. Индикатор самостоятельно определяет приоритетное направление рынка, рассчитывает сильные ценовые зоны и предоставляет четкие маркеры для входа в сделку и фиксации прибыли. Ключевой функционал и логика работы Автомат
Этот мульти-таймфрейм и мультисимвольный индикатор идентифицирует двойную вершину / основание, голову и плечо, вымпел / треугольник и образцы флагов. Также можно настроить оповещения только тогда, когда произошел прорыв линии шеи / треугольника / флагштока (прорыв линии шеи = подтвержденный сигнал для вершины / оснований и головы и плеч).       Индикатор также можно использовать в режиме одиночного графика. Подробнее об этой опции читайте в разделе продукта.   блог . В сочетании с вашими собстве
My Point MT5
Claudia Ramona Angerer
Diagnosis of major and minor pivot Trend detection with many signals Can be used in all symbols Can be used in all time frames Settings: Back Show: The number of candles it displays If you need any adjustments, or have any questions or suggestions, message me How to trade: Blue: sell signal Red: buy signal Blue and red at the same time: no signal Exit signal: Opposite signal
FiboMaster Pro — Automatic Fibonacci with Entry, SL & TP Automatic swing detection and Fibonacci levels with entry, stop loss, and take profit zones, drawn on any instrument and timeframe. FiboMaster Pro automatically detects the most recent swing high and swing low on your chart and draws the full Fibonacci retracement along with reference entry, stop loss, and two take profit levels — no manual drawing required. HOW IT WORKS The indicator scans the last N candles (configurable), identifies the
The  OBV MTF  is an Enterprise-grade On-Balance Volume indicator that transforms standard OBV into a complete trading system. It combines gradient-aware momentum analysis, divergence detection, multi-timeframe alignment, and dynamic customisable midpoint-filtering in a single intuitive professional volume analysis tool. Core Features 1. 5-State Momentum Engine Aqua (Strong Bullish) : OBV slope rising with positive acceleration SteelBlue (Weak Bullish) : OBV rising but losing momentum Gray (Neutr
Adaptive Math Zones Indicator is a professional MT5 indicator designed to identify high-probability price reaction areas using mathematical price projections and Fibonacci-based channel structures. The indicator automatically builds a reference price channel, highlights neutral zones, and projects future price levels (50%, 100%, and 200%), helping traders visually understand market structure and potential reaction points. This tool is especially effective during ranging and corrective market con
An all‑in‑one trading assistant that blends AI candle synthesis with a 15‑pattern Heat Map, ATR‑scaled S/R & pivots, and a Vigilant risk monitor (LOC/TF/SR/PAT gates, Ready%, EM points, SR‑distance bar). The Opportunity Advisor adds ETAs, checklists and gate status; Multi‑TF Confluence confirms alignment from M1–D1. The Professional Trade Suggestion panel shows regime, session filter, R:R presets, Partials and Quality Pause. Clean, readable UI with one‑click S/R toggles, scanners and a built‑in,
ICT Institutional Zones Pro — Trade with Institutional Precision Stop wasting time manually drawing key ICT levels every day. ICT Institutional Zones Pro is a professional-grade MT5 indicator built for traders who use ICT (Inner Circle Trader) and Smart Money Concepts (SMC) to read market structure with precision. This indicator automatically maps the most important institutional levels directly on your chart, helping you instantly identify where smart money is likely accumulating, distributing
Pivot Scenario Dashboard is a compact trading indicator designed to display daily pivot-based market structure in a clean and professional dashboard. It automatically calculates the main pivot level, support and resistance zones, and scenario-based market bias for the current symbol. The indicator helps traders quickly identify: main pivot level bullish and bearish trigger areas support and resistance levels target projection levels current market scenario in a compact dashboard Main Features: D
IchimokuStructure
Venicius Soares Da Silva
Ichimoku Structure S/R is a chart-window dashboard for M1: it classifies price vs Tenkan / Kijun / cloud as bullish, bearish, or range, shows the nearest Ichimoku level as a live S/R reference, flags impulsive breaks against that structure with historical context, and optionally monitors deal execution vs quotes plus a live structure-episode validation panel. It draws no classic Ichimoku lines (display is labels/panel). Research baseline baked into the tool is EURUSD M1 (2016-08-17 → 2026-06-09)
Chart Candle Timer Pro
Alireza Gholamreza Mohammadi
Chart Candle Timer Pro is a professional candle countdown panel for MetaTrader 5. It displays a compact, elegant dashboard on your chart that shows the time remaining until the next candle opens, along with essential market data at a glance. The panel updates every 200 milliseconds, ensuring a smooth and accurate countdown. It works on all standard timeframes from M1 to MN and adapts its time format automatically, showing HH:MM:SS for higher timeframes and MM:SS for shorter ones. User Guide
FREE
Sobre la base del concepto físco de  "Cantidad de Movimiento"  construimos este indicador/oscillador, que pretende darnos idea de entradas y salidas en el mercado. En mecánica clásica, la   cantidad de movimiento   se define como el producto de la masa del cuerpo (volumen) y su velocidad (rapidez con la varía el precio) en un instante determinado. p=M*V Se trata de un indicador/oscilador que pretende identificar momentos de entrada y salida basados en la fuerza o presión a ambos lados del preci
Liquidity Map  Overview The Liquidity Map indicator is an advanced visualization tool based on ICT Smart Money Concepts . It automatically identifies daily Buy Zones , Sell Zones , and Liquidity Levels , showing where price is likely to reverse or continue based on institutional order flow. It calculates key levels from the daily session — such as the previous day’s high, low, and midpoint — then derives a premium (sell bias) and discount (buy bias) structure. When price trades into these mapped
Trading Discipline Trend Dashboard считывает только уже закрытую историю сделок вашего собственного счёта и превращает четыре конкретных паттерна в тренд за 7 дней, чтобы вы видели, происходит что-то один раз или повторяется каждую неделю. Инструмент ничего не прогнозирует и не даёт советов. Каждое число на панели - это то, что уже произошло на этом счёте. Как строятся числа: считываются закрытые сделки за последние до 37 дней по всем символам и всем магическим номерам - это картина по всему сч
Этот мульти-таймфрейм и мультисимвольный индикатор идентифицирует двойную или тройную вершину / основание или последующий прорыв линии шеи (подтвержденная вершина / основание). Он предлагает RSI, пин-бар, поглощение, пинцет, утренние / вечерние звездные фильтры, а также параметры фильтра дивергенции, которые позволяют отфильтровать только самые сильные настройки.       Индикатор также можно использовать в режиме одиночного графика. Подробнее об этой опции читайте в разделе продукта.   блог .   В
BOS Structure Radar MT5 Structure-Based BUY/SELL Bias, Confidence Score and Trade Plan Dashboard for MetaTrader 5. BOS Structure Radar MT5 automatically maps Break of Structure, support and resistance, liquidity levels, premium/discount context, higher-timeframe bias, and BUY/SELL setup conditions directly on your MT5 chart. It is designed for discretionary traders who want to reduce manual chart work and read market structure faster. BOS Structure Radar MT5 is a professional market-structure
ENGLISH VERSION (for MQL5 Market) Product Description: RSI Trend & Volatility Dashboard (Multi-Timeframe Filter) This professional dashboard provides traders with an ultimate market overview inside a single chart. It continuously monitors the trend direction across 5 timeframes simultaneously: M5, M15, M30, H1, and D1 [MQL5]. No more tedious chart switching or multi-window clutter – see everything from quick scalping moves to global institutional daily trends in real-time [MQL5]. Key Adva
Indices Metals MTF Scanner Анализируйте основные мировые индексы и драгоценные металлы на нескольких таймфреймах с помощью одной профессиональной панели. CapitalSol Indices Metals MTF Scanner — мультисимвольный и мультитаймфреймовый инструмент анализа для MetaTrader 5. Сканер анализирует соотношение быстрой и медленной EMA на четырех настраиваемых таймфреймах. По умолчанию используются EMA 20 / EMA 50 и таймфреймы M15, H1, H4 и D1 . Если быстрая EMA находится выше медленной EMA, соответствующий
Institutional Orderflow Entry Scanner Volume Profile • Value Area • Order Blocks • Multi-Symbol Scanner Turn your chart into a professional institutional order-flow cockpit. This indicator scans up to 60 Market Watch symbols in real time, detects high-probability setups from three proven Value-Area strategies, and delivers clean, actionable entries with institutional-grade risk management — all on a single, flicker-free interface. What It Does The scanner continuously analyses the previous sess
TCM SMC Indicator for MetaTrader 5 marks market structure on your chart: supply and demand zones, breaks of structure, liquidity grabs and fair value gaps. Everything is calculated from closed candles. What it shows - Fresh supply and demand zones, extended to the right until price returns to them, with the option to also show zones that have been revisited - Breaks of structure (BOS), labelled on the chart - Liquidity grabs (LQG), where price runs a recent high or low and turns back - Fair valu
С этим продуктом покупают
Trend Sniper X
Sarvarbek Abduvoxobov
4.86 (44)
Trend Sniper X — это трендовый индикатор для MetaTrader 5, работающий на нескольких таймфреймах, который помогает трейдерам точно и ясно определять направление тренда и потенциальные точки разворота. для MT4: https://www.mql5.com/en/market/product/193245 Информация о цене: Текущая цена является промо-ценой и может измениться по мере выхода предстоящих обновлений и новых функций. Бонусное предложение: Чтобы получить БЕСПЛАТНЫЙ авто-трейд советник Assistant EA для этого индикатора, пожалуйста, на
Новый король в городе — Индикатор + управление ордерами (TP1 + TP2 + TP3) + опциональный Telegram-сигнал-сендер ВКЛЮЧЁН (БЕСПЛАТНО) (ПОЛНОЦЕННАЯ ТОРГОВАЯ И СИГНАЛЬНАЯ СИСТЕМА) Gold Slayer EA Этот индикатор включает в себя продвинутую стратегию, торговую систему с настраиваемым управлением ордерами и систему mean reversion, которая сочетает расширения Envelope и поддерживается несколькими интеллектуальными фильтрами подтверждения, такими как RSI, для поиска высоковероятных точек разворота с сигн
Smart Trend Trading System — MetaTrader 5 После покупки напишите мне на MQL5, чтобы БЕСПЛАТНО получить Smart Universal Expert Advisor, а также доступ к онлайн-курсу, руководство в формате PDF и доступ к закрытой группе. STTS объединяет направление тренда, сигналы входа и выхода, зоны разворота и важные ценовые уровни прямо на графике. Торгуйте по системе вручную или подключите отдельный совместимый советник для автоматического исполнения с выбранными вами настройками. ОДНА СИСТЕМА. ЧЕТЫРЕ ТОРГОВ
Получите своё торговое преимущество в поле зрения! M5 Sniper — это новый индикатор от MeanFX. Он сочетает точные торговые сигналы с адаптивными уровнями TP/SL — в результате создавая лучшие возможные статистические сделки! Цена увеличивается каждые 5 покупок, следующая цена — 69$ Напишите мне после покупки, чтобы получить советы/руководство и бонусного EA Что выделяет его среди других? Проверенная статистическая эффективность на Gold XAUUSD ( работает практически на каждом активе , с акцентом н
Entry Points Pro показывает, где входить, где ставить стоп и каким лотом торговать — до того, как вы поставите ордер. ЦЕНА Сейчас 199 USD: 8 копий по этой цене, затем 249 USD. Финальная цена — 349 USD. Я зарабатываю торговлей на рынке и показываю это, поэтому мне не нужно продавать этот индикатор всем подряд. Это инструмент для трейдеров, которые думают своей головой, а не волшебная кнопка. Нет пробоя — нет сделки. Серая стрелка — отменённый сигнал: цена не пробила сигнальную свечу, значит, н
ULTRA - это технический индикатор, который который работает по принципу “Все включено” - самостоятельно анализирует рынок, дает торговые сигналы, показывает уровни для установки стоп лосс, а также подсказывает когда нужно закрывать сделки, чтобы получить профит или минимизировать убыток. То есть, не важно, что ты не умеешь анализировать рынок, определять уровни - где поставить SL или плохо совладаешь с мани-менеджментом. ULTRA все это сделает вместо тебя! БОНУС ДЛЯ ПОКУПАТЕЛЯ : После покупки ULT
Gann Made Easy   - это профессиональная, но при этом очень простая в применении Форекс система, основанная на лучших принципах торговли по методам господина У.Д. Ганна. Индикатор дает точные BUY/SELL сигналы, включающие в себя уровни Stop Loss и Take Profit. ПОЖАЛУЙСТА, СВЯЖИТЕСЬ СО МНОЙ ПОСЛЕ ПОКУПКИ, ЧТОБЫ ПОЛУЧИТЬ ТОРГОВЫЕ ИНСТРУКЦИИ И ОТЛИЧНЫЕ ДОПОЛНИТЕЛЬНЫЕ ИНДИКАТОРЫ БЕСПЛАТНО! Вероятно вы уже не раз слышали о торговли по методам Ганна. Как правило теория Ганна отпугивает от себя не только
SuperScalp Pro
Van Minh Nguyen
4.54 (37)
SuperScalp Pro - Professional Multi-Layer Confluence Scalping System SuperScalp Pro — это продвинутый индикатор для скальпинга, который расширяет возможности классического Supertrend с помощью нескольких интеллектуальных фильтров подтверждения. Он помогает выявлять торговые возможности Buy/Sell с более высокой вероятностью успеха и значительно сокращать количество ложных сигналов. Чёткие стрелки Buy и Sell отображаются непосредственно на графике вместе с автоматически рассчитываемыми в реальном
Gold Trend Coach MT5
Cristhian Alexander Gaibor Cuasquer
4.27 (11)
Сигналы на покупку и продажу по золоту (XAUUSD) для MetaTrader 5 без перерисовки. У каждого сигнала есть stop loss и три take profit. Фильтр Smart Money Concepts с BOS и CHoCH, чтобы вы торговали по структуре, а не против неё. Живой Ментор на панели ведёт вас на каждом шаге, от входа до TP3. И алерты прямо на телефон и в ваш собственный Telegram-канал. Это Gold Trend Coach. Больше никакой торговли в одиночку. БЕСПЛАТНЫЙ НАБОР ПОКУПАТЕЛЯ к вашей покупке: 1. Telegram Alert Bridge: ваши сигналы пр
SMC Intraday Formula
VividMind Digital Solutions
5 (26)
Давайте сначала будем честны. Ни один индикатор сам по себе не сделает вас прибыльным. Если кто-то говорит вам обратное — он продаёт вам мечту. Любой индикатор, который показывает идеальные стрелки покупки/продажи, можно сделать безупречным — просто увеличьте нужный участок истории и сделайте скриншот успешных сделок. Мы так делать не будем. SMC Intraday Formula — это инструмент. Он считывает структуру рынка за вас, определяет зоны с наивысшей вероятностью движения цены и точно показывает, как
Boba Analysis Suite
Trade Ready Solutions LLC
5 (2)
Boba Analysis Suite Boba Analysis Suite — аналитический индикатор для MetaTrader 5. Он объединяет структуру рынка, значимые ценовые зоны и общий рыночный контекст в одном представлении на графике. Индикатор разработан на основе практического опыта трейдера и наставника по трейдингу. Он помогает выстроить последовательный процесс анализа: оценивать направление рынка, определять важные уровни и рассматривать несколько таймфреймов в совокупности. Анализ с учётом контекста Значение отдельных сигнало
Следующее обновление — версия 2.52 уже скоро! [НОВОЕ] Приготовьтесь к 4 новым важным функциям, призванным улучшить ваш анализ рынка и торговый процесс. Мы выводим анализ рынка на новый уровень с помощью 4 новых функций, разработанных с учётом ваших потребностей в трейдинге. Представляем: 1. TRADE OVERVIEW DASHBOARD 2. CONFLUENCE AT ZONE 3. STRONG & WEAK HIGH/LOW 4. OTE 1. TRADE OVERVIEW DASHBOARD Панель, которая помогает легче понимать общую картину рынка, предоставляя рекомендации для поддержк
FX Power: Анализируйте силу валют для более эффективной торговли Обзор FX Power — это ваш незаменимый инструмент для понимания реальной силы валют и золота в любых рыночных условиях. Определяя сильные валюты для покупки и слабые для продажи, FX Power упрощает принятие торговых решений и выявляет высоковероятные возможности. Независимо от того, хотите ли вы следовать за трендами или предсказывать развороты с использованием экстремальных значений дельты, этот инструмент идеально адаптируется под
M1 SNIPER   — это простая в использовании торговая система. Это стрелочный индикатор, разработанный для тайм фрейма M1. Индикатор можно использовать как отдельную систему для скальпинга на тайм фрейме M1, а также как часть вашей существующей торговой системы. Хотя эта торговая система была разработана специально для торговли на M1, ее можно использовать и с другими тайм фреймами. Первоначально я разработал этот метод для торговли XAUUSD и BTCUSD. Но я считаю этот метод полезным и для торговли на
FiboSniper Pro – Multi-Filter Fibonacci System with Auto SL/TP and Control Panel FiboSniper Pro — это технический индикатор, который объединяет динамические Fibonacci Envelopes с несколькими фильтрами подтверждения для формирования отборных сигналов Buy и Sell. Уровни Fibonacci рассчитываются на основе Moving Average и ATR, а затем фильтруются с помощью ADX, EMA, RSI, ATR, Volume, Time и структуры свечи. Индикатор отображает на графике автоматические уровни Stop Loss и Take Profit на основе ATR,
Auto Optimized SpeedAngle — это система векторизации импульса институционального уровня, которая исключает подгонку под исторические данные (curve-fitting) за счет непрерывной форвард-оптимизации (Walk-Forward Optimization, WFO). Вместо того чтобы полагаться на статические входные параметры, которые теряют эффективность при смене рыночных режимов, индикатор динамически перекалибрует свои настройки, используя валидацию на вневыборочных данных (Out-of-Sample, OOS). Это гарантирует, что отображаемы
Sqn Max Indicator Sqn Max is an exclusive indicator to trade the market with high effectiveness. The indicator is based on price action, volatility and trend. This indicator is as simple as possible but not too simple. The indicator can generate alerts to ease the trading process. You don't have to stay all day in front of your screen. The indicator can be used with any class of assets and with any time frame. It is possible to achieve better results trading our list of selected assets. We achi
Smc Pro ToolKit
Talal N Z Aljarusha
5 (14)
SMC PRO TOOLKIT — SMART MONEY ANALYSIS & STRUCTURED TRADE PLANNING SMC Pro ToolKit is a professional Smart Money Concepts analysis workspace for MetaTrader 5. It combines market structure, multi-timeframe analysis, institutional price zones, setup evaluation, confirmation tools, volume context, alerts, and risk planning inside one organized chart environment. One workspace. Multiple layers of confirmation. One structured trading plan. OPEN COMPLETE USER GUIDE MULTI-CONDITION SETUP ENGINE At
SIO Oscillator: самооптимизирующийся осциллятор дисбаланса семивариаций Купите индикатор и получите советник (EA) на его основе БЕСПЛАТНО. Большинство осцилляторов воспринимают любое движение цены одинаково. SIO разделяет давление покупателей и продавцов и измеряет дисбаланс между ними, показывая, какая сторона действительно контролирует рынок. Когда дисбаланс достигает экстремума, SIO выдаёт чёткий сигнал с уровнями входа, Stop Loss и Take Profit. Главное отличие SIO в том, что он не полагается
Power Candles V3 — самооптимизирующийся индикатор силы Power Candles V3 преобразует силу валюты и инструмента в готовый к использованию торговый план на каждом графике, к которому он прикреплен. Вместо того, чтобы просто раскрашивать свечи, он выполняет автоматическую оптимизацию в режиме реального времени в фоновом режиме и предоставляет вам оптимальные значения Stop Loss, Take Profit и порог сигнала для выбранного вами символа. Один клик — и все готово для реальной торговли: на графике появляю
Atomic Analyst — MetaTrader 5 После покупки напишите мне на MQL5, чтобы БЕСПЛАТНО получить Smart Universal Expert Advisor, а также доступ к онлайн-курсу, руководство в формате PDF и доступ к закрытой группе. Atomic Analyst объединяет анализ ценового движения, направление тренда, сигналы входа и выхода, уровни Stop Loss и несколько уровней Take Profit прямо на графике. УВИДЬТЕ СИГНАЛ. ОЦЕНИТЕ ТОРГОВУЮ СИТУАЦИЮ. Atomic Analyst представляет результаты анализа в понятном визуальном виде: • Стрелки п
Unix Scalper — MetaTrader 5 После покупки напишите мне на MQL5, чтобы БЕСПЛАТНО получить Smart Universal Expert Advisor, а также доступ к онлайн-курсу, руководство в формате PDF и доступ к закрытой группе. Найдите торговую ситуацию. Оцените план. Выберите способ торговли. UNIX Scalper объединяет анализ рынка, решения BUY/SELL/WAIT и уровни Entry, Stop Loss, TP1 и TP2 в одной удобной панели. УВИДЬТЕ СИГНАЛ И ТОРГОВЫЙ ПЛАН • Понятные решения: BUY, SELL или WAIT. • Определённые уровни: Entry, Stop
Индикатор Tokyo Indicator обеспечивает наглядное представление о направлении тренда, потенциальных торговых сигналах и текущей рыночной ситуации. Его ступенчатая линия тренда с цветовой индикацией позволяет различать «бычьи» фазы (выделены синим цветом) и «медвежьи» фазы (выделены пурпурным цветом). Соответствующие стрелки указывают на возможные точки входа в рынок (покупку или продажу) при смене тренда. Встроенная информационная панель объединяет данные о текущем сигнале, рыночном настроении,
Astral Structure Оцените сетап. Посмотрите его первоначальный план. Специальная цена запуска - $99. $149 после запуска. Структурный сетап ставит сразу несколько вопросов: согласуется ли общая картина, где находится ориентир стопа и как определены цели? Astral Structure объединяет эти вопросы в одном рабочем пространстве для трейдеров, самостоятельно принимающих решения на основе структуры рынка. Сосредоточьтесь на актуальном сетапе. Рассматривайте последний подходящий сетап, его направление и кв
Crystal Heikin Ashi Signals—Professional Trend & Signal Detection Indicator Advanced Heikin Ashi Visualization with Intelligent Signal System for Manual & Automated Trading Final Price: $149 ---------> Price goes up $10 after every 10 sales . Limited slots available — act fast . Overview User Guide PDF Crystal Heikin Ashi Signals is a professional-grade MetaTrader 5 indicator that combines pure Heikin Ashi candle visualization with an advanced momentum-shift detection system. Designed for both m
Trend Catcher   анализирует движения рыночных цен, используя комбинацию собственных и индивидуально разработанных адаптивных индикаторов анализа тренда. Он определяет истинное направление рынка, отфильтровывая краткосрочные шумы и фокусируясь на силе импульса, расширении волатильности и поведении ценовой структуры. Он также использует комбинацию сглаживающих и фильтрующих тренд индикаторов, таких как скользящие средние, RSI и фильтры волатильности. Мониторинг реальных операций, а также другие
Мультивалютный индикатор силы и импульса MT5 Dynamic Forex28 Navigator — развитие наших давно популярных индикаторов, объединяющее силу пяти в одном: Advanced Currency Strength28 Indicator (700 отзывов) Advanced Currency IMPULSE with ALERT (530 отзывов) Currency Strength EXOTICS GOLD Impulse with Alert CS28 Combo Signals (текущий бонус) Не нужно покупать четыре индикатора и ставить их на графики. Всё объединено в одном мощном индикаторе: сила 28 пар Forex, импульс рынка, который их ведёт, и опов
Scalper Vault — это мощная, полноценная торговая система, созданная для трейдеров, которые стремятся к стабильным результатам в внутридневной торговле. Этот высокоточный индикатор представляет собой комплексное, самостоятельное торговое решение, обеспечивающее аналитику профессионального (институционального) уровня как для торговли на рынке Forex, так и для работы с бинарными опционами. Пожалуйста, свяжитесь со мной после покупки, чтобы получить мои торговые советы, а также отличный бонус! Исклю
Один и тот же график, один и тот же порядок чтения — каждый день. Структура, ближайшая зона, положение в диапазоне и сторона тренда — на экране сразу и всегда в одном виде. БОНУС ПОКУПАТЕЛЮ — SMC Nexus Scanner Pro. Многосимвольный сканер на данных этого индикатора: одна панель показывает сторону тренда, активные ордер-блоки и BOS / CHoCH сразу по многим символам. Без доплаты — после покупки напишите мне в личные сообщения на MQL5, и я его пришлю. Пятнадцать слоёв под одной панелью: структура ры
Azimuth Pro
Ottaviano De Cicco
5 (7)
Azimuth Pro V2: Синтетический фрактальный структурный анализ и подтверждённые входы для MT5 Обзор Azimuth Pro — многоуровневый индикатор свинговой структуры от Merkava Labs . Четыре вложенных уровня свингов, привязанный к свингам VWAP, определение ABC-паттернов, трёхтаймфреймная структурная фильтрация и подтверждённые входы на закрытой свече — один график, один рабочий процесс от микро-свингов до макро-циклов. Это не слепой сигнальный продукт. Это рабочий процесс, основанный на структуре, для т
Другие продукты этого автора
See the Dow Theory direction of six timeframes in one panel. DowgatorPro2 judges the current trend direction (up or down) automatically by Dow Theory, using closed bars only. It carries over the features of the earlier e-DowgatorPro and puts first that even a beginner can read the direction without confusion. The direction of six timeframes (M1 to D1) is shown on the panel in color. Features Check direction mismatch: see on the panel whether your chart's timeframe agrees with the higher timefram
The levels of higher timeframes, on the chart you are watching. LineTraderPro2 finds swing highs and lows with Dow Theory rules and draws horizontal lines at the levels the market watches, for any of 20 timeframes from M1 to W1. Each line is labeled with its timeframe (H1, D1 and so on) and the date of the swing, so you can see at a glance which timeframe a level belongs to without switching charts. What you see on the chart Horizontal lines: the swing highs above the price and the swing lows be
See the market's fear level on the chart you trade. VixChecker shows the VIX (the volatility index often called the fear index) in a sub-window as one bar per day, colored by level: normal (blue), caution (yellow, 20 or above by default) and fear (red, 30 or above). The current value, the change from the previous close and the time of the value are shown in a small panel, and the value can also be shown on the main chart. Where the VIX values come from (please read before buying) The indicator d
Round numbers on your chart, and a notice when the price gets close. RoundNumberAlert draws horizontal lines at round numbers (150.000, 150.500 ...) and watches them for you. When the price enters the touch range, only that line blinks and you get one notification. Major round numbers stand out in gold, and a small panel shows how many pips are left to the next round number above and below. Features Round-number lines: the step starts at 10 pips (for example 50 pips: 150.000, 150.500 ...). Major
Entry signals as finger marks: yellow for trend-following, pink for counter-trend. SignRAMB combines RSI, ATR, MACD, a moving average, Dow theory and the candles, and marks the places where the price may turn up or down, based on past chart patterns. A finger pointing up is a buy, pointing down is a sell. Signals are decided on closed bars and never repaint. Signals are not always right. Use them as one indicator, together with your own reading of the chart. They are meant for the move right aft
Which currency is strong right now — in one panel. CurrencyStrength takes the RSI of the 28 pairs of USD, EUR, JPY, GBP, AUD, CHF, CAD and NZD, turns it into a score from −100 to +100 for each currency, and shows them as bars, strongest first. Features Strength ranking: strong currencies in green, weak ones in red, scored from −100 to +100. Automatic symbol detection: the pairs are found from each symbol's base and profit currency, so suffixes and prefixes (EURUSD#, EURUSD.pro, m.EURUSD, EURUSDm
Trendlines drawn for you — and a good shape kept as your basis. TrendLineSnap finds the swing highs and swing lows on your chart, joins them and draws one high trendline and one low trendline. Triangles, channels, wedges and horizontal levels used in line trading show up as lines. Automatic trendlines are redrawn whenever a new swing forms. When you see a shape you want to trade, save it. The saved line does not move. When the price comes near it again, show the saved line next to the current li
Where is the price inside the range — in one panel. BoxRangeSnap looks for price zones where the highs and lows touched the same top and bottom again and again, and draws them as a big box and a small box. The panel keeps showing the distance from the price to the top and bottom of the current box. Features Automatic range boxes: a big box and a small box, newest first. The current box is highlighted and extends to the last closed bar. Adjustable detection: minimum touches on the top and bottom,
The Dow Theory structure of the chart — in one look. DowTheoryVisual labels every swing high and low as HH, HL, LH or LL and draws a zigzag colored by the trend: blue for an uptrend, red for a downtrend, gray for a range. The panel keeps showing the trend of the current chart and of two higher timeframes side by side. Features HH / HL / LH / LL labels: each swing high and low is compared with the previous one. Trend-colored zigzag: up blue, down red, range gray. The color changes on the bar wher
Key levels on nine timeframes, and an alert the moment the price breaks out. Prices that were stopped again and again are levels many traders watch. BreakerDetectPro finds the zones where swing highs and swing lows gather and draws one level above and one below the price for each timeframe you select, from M1 to MN1. Higher-timeframe levels are drawn on the chart you are looking at. Features Automatic key levels: one level above and one below the price, from swing highs and lows that gather in t
A small, rule-based edge from the Japanese calendar. For traders who want an EA that never averages down, and for GoldHam users looking for a second EA. It trades only on Gotobi mornings with a stop placed with every order, so its trading days and hours rarely overlap with GoldHam, which trades gold every day (use separate accounts). In Japan, the 5th, 10th, 15th, 20th, 25th and the last day of the month are called "Gotobi". Many Japanese importers settle their dollar payments on these days, so
A gold 1-minute basket EA, profit-seeking type. For traders who want to grow a small account. You pick only the multiplier and the lot grows with your balance. It trades heavier than its sister GoldHam Shield and grows faster; if you would rather keep drawdowns shallow, choose Shield instead. GoldHam Blade trades gold on the 1-minute chart. When price moves against the first entry it adds positions in the same direction, and closes all of them together once the basket is back in profit. Blade gr
A gold 1-minute basket EA, steady type. For traders who want shallow drawdowns and a long run. You choose fixed or compounding lots; at multiplier 1.0 fixed, the deepest drawdown over two years was 6%. It enters on the same signals as GoldHam Blade, only lighter, so pick one of the two rather than both. GoldHam Shield uses the same gold 1-minute basket logic as GoldHam Blade, with lighter positions and a cap on the deepest levels. You choose fixed lots or compounding, and a multiplier of 1.0 (re
A gold 1-minute EA, aggressive type, tuned to today's gold market. You choose two things: the multiplier (3.5 to 5.0) and the stop line (60 to 90 percent of the balance, default 80). What changed in version 2.08 Lots grow more gently than before, so the load stays lighter in a strong one-way move The default stop line is 80% of the balance. If you choose a line below the minimum for your multiplier, the EA raises it to that minimum In a replay of the gold spike on 3 November 2026 (real ticks), t
Copy trades between MT4 and MT5 terminals on one computer. CopyHam Inside Sender is the master side of a trade copier. Attach it to the account you want to copy from. It shows a Receiver code (CT-XXXX-XXXX) on its panel. Paste that code into CopyHam Inside Receiver on the other terminals, and they follow every trade of this account. The Sender and the Receivers exchange data through the common data folder of MetaTrader on the same computer. Nothing is sent over the internet, so there is no URL t
Follow a master account from another terminal on the same computer. CopyHam Inside Receiver is the follower side of a trade copier. Paste the Receiver code shown on CopyHam Inside Sender (CT-XXXX-XXXX) into its inputs, and this account opens, modifies and closes the same trades as the master. The data is exchanged through the common data folder of MetaTrader on the same computer. Nothing is sent over the internet. The master may be MT4 or MT5 and may be with a different broker. What is copied Ma
TradeHam Manager is a trade panel for manual traders. You decide when and where to trade. The panel takes care of the lot size, the order and the clean-up. It does not open trades on its own. It has no entry logic and does not promise any profit. Main features Risk-based lot size. Set the risk as a percent of balance, a fixed amount of money or a fixed lot. Drag the stop-loss line on the chart and the lot is recalculated. One-click orders. BUY / SELL buttons place the order with stop loss and ta
SignalHamToEA reads a signal indicator that draws arrows on the chart and places orders exactly as the arrows say. No programming is needed. Enter the indicator name and the buffer numbers that hold the buy and sell arrows, and it runs. The EA has no trading method of its own. Whether it enters is decided by the arrows of the indicator you connect, so you can try as many signal tools as you like. Four ways to read signals Buy/sell buffers (arrows), the basic mode One buffer that turns + / - (tre
See the Dow Theory direction of six timeframes in one panel. DowgatorPro2 judges the current trend direction (up or down) automatically by Dow Theory, using closed bars only. It carries over the features of the earlier e-DowgatorPro and puts first that even a beginner can read the direction without confusion. The direction of six timeframes (M1 to D1) is shown on the panel in color. Features Check direction mismatch: see on the panel whether your chart's timeframe agrees with the higher timefram
Know exactly how long until the next release, and what came out. EconomicStopper shows the time to each economic release as a countdown, lists the upcoming events with their importance, and shows the actual value and the surprise against the forecast after the release. Everything is in one panel on the chart. It reads the economic calendar built into MetaTrader 5, so it needs no DLL and no web requests. How it behaves over time More than 5 minutes before: the timer counts down every second and t
See the market's fear level on the chart you trade. VixChecker shows the VIX (the volatility index often called the fear index) in a sub-window as one bar per day, colored by level: normal (blue), caution (yellow, 20 or above by default) and fear (red, 30 or above). The current value, the change from the previous close and the time of the value are shown in a small panel, and the value can also be shown on the main chart. Where the VIX values come from (please read before buying) The indicator d
Round numbers on your chart, and a notice when the price gets close. RoundNumberAlert draws horizontal lines at round numbers (150.000, 150.500 ...) and watches them for you. When the price enters the touch range, only that line blinks and you get one notification. Major round numbers stand out in gold, and a small panel shows how many pips are left to the next round number above and below. Features Round-number lines: the step starts at 10 pips (for example 50 pips: 150.000, 150.500 ...). Major
Entry signals as finger marks: yellow for trend-following, pink for counter-trend. SignRAMB combines RSI, ATR, MACD, a moving average, Dow theory and the candles, and marks the places where the price may turn up or down, based on past chart patterns. A finger pointing up is a buy, pointing down is a sell. Signals are decided on closed bars and never repaint. Signals are not always right. Use them as one indicator, together with your own reading of the chart. They are meant for the move right aft
Which currency is strong right now — in one panel. CurrencyStrength takes the RSI of the 28 pairs of USD, EUR, JPY, GBP, AUD, CHF, CAD and NZD, turns it into a score from −100 to +100 for each currency, and shows them as bars, strongest first. Features Strength ranking: strong currencies in green, weak ones in red, scored from −100 to +100. Automatic symbol detection: the pairs are found from each symbol's base and profit currency, so suffixes and prefixes (EURUSD#, EURUSD.pro, m.EURUSD, EURUSDm
Trendlines drawn for you — and a good shape kept as your basis. TrendLineSnap finds the swing highs and swing lows on your chart, joins them and draws one high trendline and one low trendline. Triangles, channels, wedges and horizontal levels used in line trading show up as lines. Automatic trendlines are redrawn whenever a new swing forms. When you see a shape you want to trade, save it. The saved line does not move. When the price comes near it again, show the saved line next to the current li
Where is the price inside the range — in one panel. BoxRangeSnap looks for price zones where the highs and lows touched the same top and bottom again and again, and draws them as a big box and a small box. The panel keeps showing the distance from the price to the top and bottom of the current box. Features Automatic range boxes: a big box and a small box, newest first. The current box is highlighted and extends to the last closed bar. Adjustable detection: minimum touches on the top and bottom,
The Dow Theory structure of the chart — in one look. DowTheoryVisual labels every swing high and low as HH, HL, LH or LL and draws a zigzag colored by the trend: blue for an uptrend, red for a downtrend, gray for a range. The panel keeps showing the trend of the current chart and of two higher timeframes side by side. Features HH / HL / LH / LL labels: each swing high and low is compared with the previous one. Trend-colored zigzag: up blue, down red, range gray. The color changes on the bar wher
Key levels on nine timeframes, and an alert the moment the price breaks out. Prices that were stopped again and again are levels many traders watch. BreakerDetectPro finds the zones where swing highs and swing lows gather and draws one level above and one below the price for each timeframe you select, from M1 to MN1. Higher-timeframe levels are drawn on the chart you are looking at. Features Automatic key levels: one level above and one below the price, from swing highs and lows that gather in t
A small, rule-based edge from the Japanese calendar. For traders who want an EA that never averages down, and for GoldHam users looking for a second EA. It trades only on Gotobi mornings with a stop placed with every order, so its trading days and hours rarely overlap with GoldHam, which trades gold every day (use separate accounts). In Japan, the 5th, 10th, 15th, 20th, 25th and the last day of the month are called "Gotobi". Many Japanese importers settle their dollar payments on these days, so
A gold 1-minute basket EA, profit-seeking type. For traders who want to grow a small account. You pick only the multiplier and the lot grows with your balance. It trades heavier than its sister GoldHam Shield and grows faster; if you would rather keep drawdowns shallow, choose Shield instead. GoldHam Blade trades gold on the 1-minute chart. When price moves against the first entry it adds positions in the same direction, and closes all of them together once the basket is back in profit. Blade gr
Фильтр:
Нет отзывов
Ответ на отзыв