LineTraderPro2 MTF Horizontal Lines MT5

  • Indicadores
  • Naoto Shimoda
    Naoto Shimoda
    • MetaTrader 4/5 Indicator & EA Developer em  FX.Hamrat
    • Japão
    • 2021
    FX.Hamrat - MetaTrader 4/5 indicator and Expert Advisor developer based in Japan.
    Over 10 years of trading experience (discretionary and systematic), and 90+ MT4/MT5 programs built so far - including 30+ custom-made projects for individual traders.
  • Versão: 2.12
  • Atualizado: 29 setembro 2026
  • Ativações: 10

The levels of higher timeframes, on the chart you are watching.

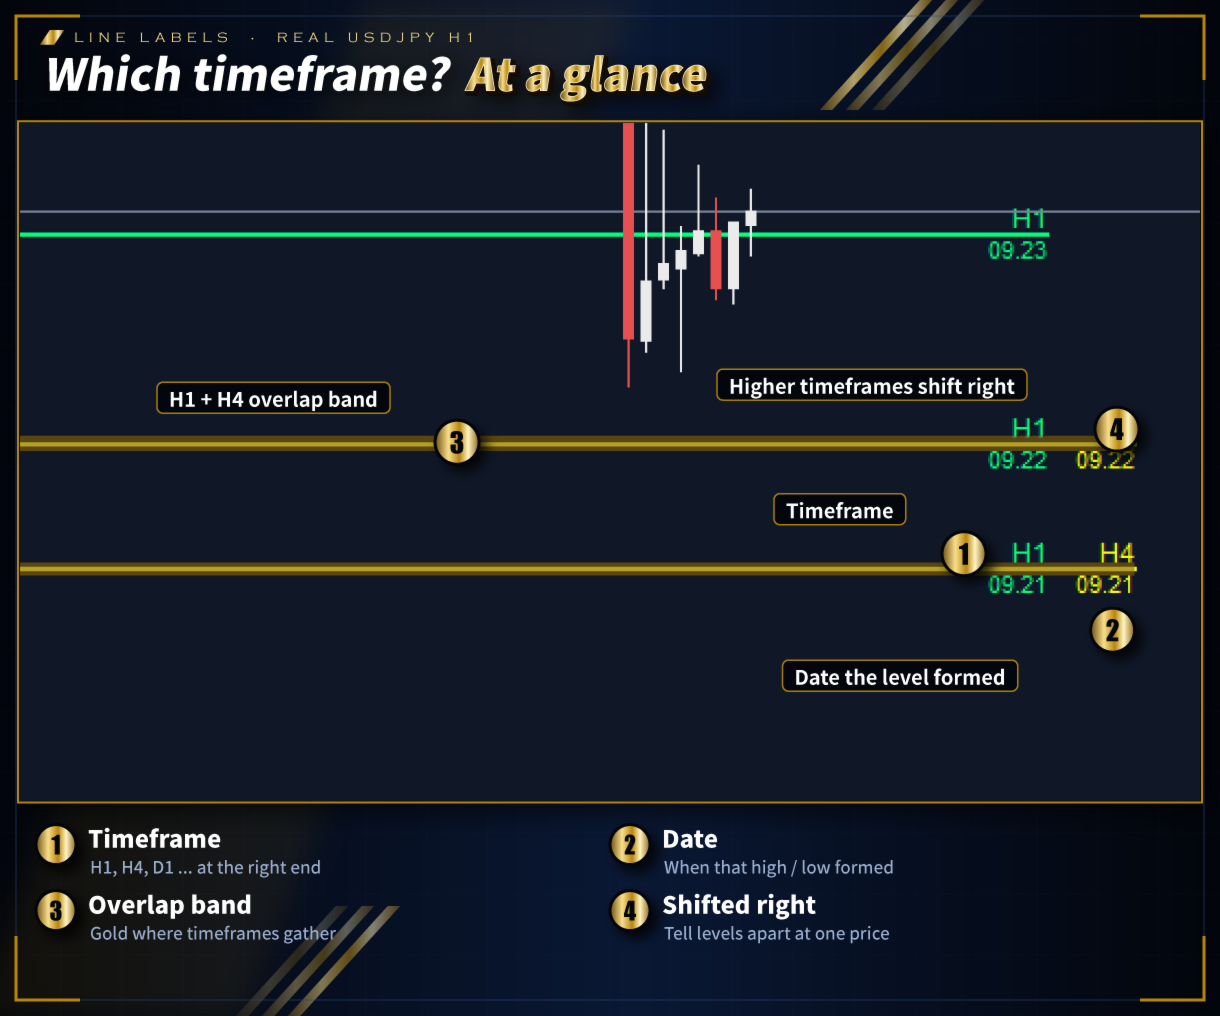
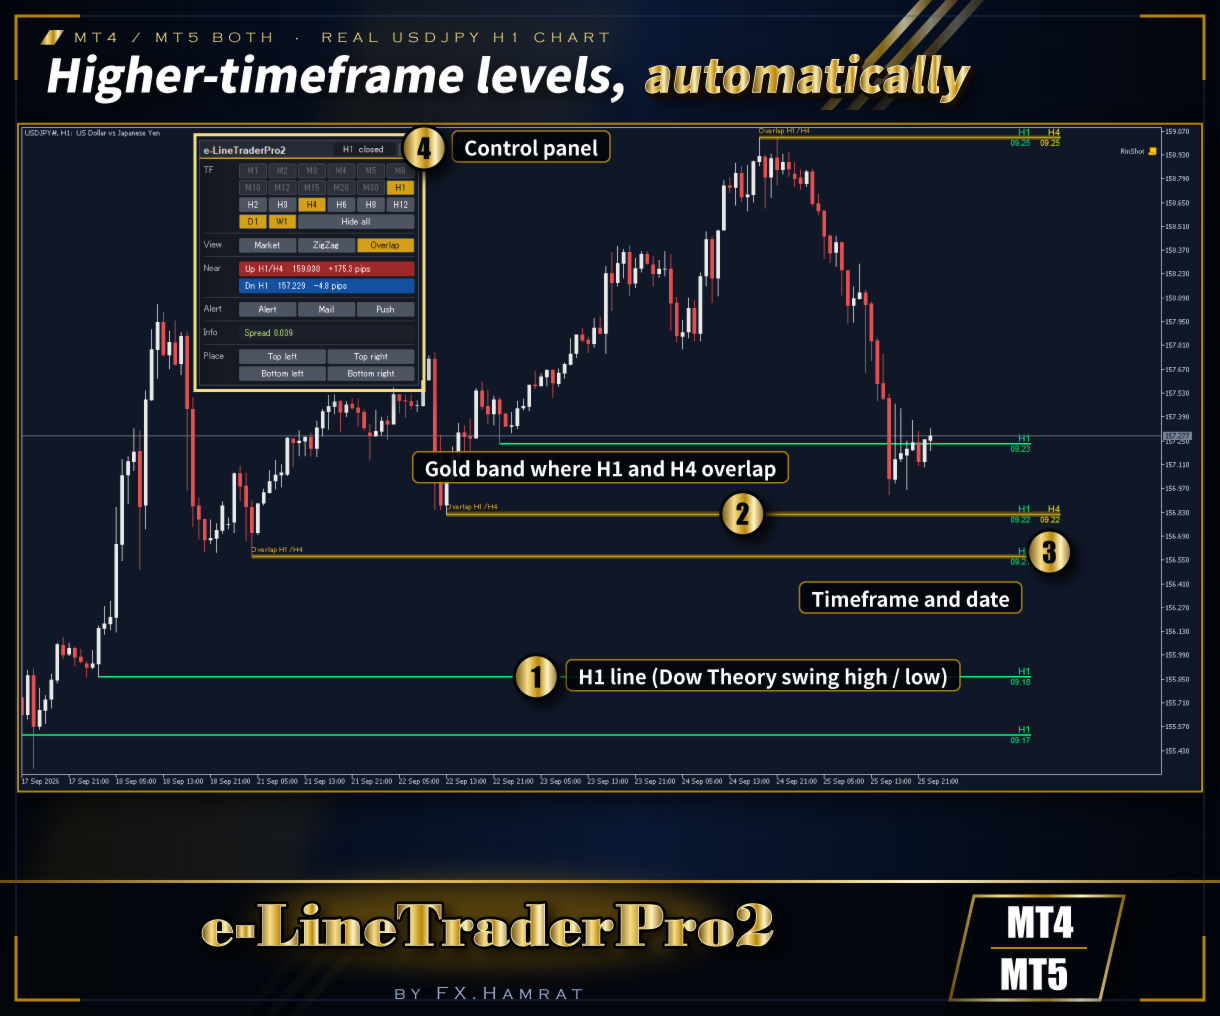
LineTraderPro2 finds swing highs and lows with Dow Theory rules and draws horizontal lines at the levels the market watches, for any of 20 timeframes from M1 to W1. Each line is labeled with its timeframe (H1, D1 and so on) and the date of the swing, so you can see at a glance which timeframe a level belongs to without switching charts.

What you see on the chart

  • Horizontal lines: the swing highs above the price and the swing lows below it, nearest first, for every timeframe you turn on.
  • Labels at the right end of each line: timeframe name and start date. Higher timeframes are shifted to the right so lines at the same price stay readable.
  • Dow Theory zigzag: swing highs and lows joined by a line, for the timeframes shown.
  • Sessions: Tokyo, London and New York drawn as boxes of their high-low range (charts up to H1). Daylight saving time switches automatically.
  • Spread and the time left until the current bar closes.
  • Control panel: one button per timeframe (M1, M2, M3, M4, M5, M6, M10, M12, M15, M20, M30, H1, H2, H3, H4, H6, H8, H12, D1, W1), plus Market, Dow and Del. Drag it to move it.

Details

  • Calculation uses confirmed bars only.
  • Only timeframes equal to or higher than the chart are shown.
  • Works on any symbol.
  • Button language: English or Japanese.
  • No DLL, no external connection.

Inputs (main)

  • Swing bars on each side (default 4)
  • Bars to calculate (default 5,000)
  • Timeframe name and start date labels, and the clock for the date (server time or PC clock)
  • Color and width of the lines for each timeframe
  • Server offset in winter (2 for many brokers) and the colors and hours of the three sessions
  • Panel: show, placement and position

Notes

  • This indicator shows the state of the market. It does not place trades and does not guarantee any result.
  • The demo version of an indicator runs only in the Strategy Tester (visual mode).
Produtos recomendados
Este indicador multi-quadro de tempo e vários símbolos verifica as formações envolventes e em pinça. Combinado com suas próprias regras e técnicas, este indicador permitirá que você crie (ou aprimore) seu próprio sistema poderoso. Recursos Pode monitorar todos os símbolos visíveis na janela Market Watch ao mesmo tempo. Aplique o indicador a apenas um gráfico e monitore instantaneamente todo o mercado. Monitora cada período de tempo, de M1 a MN, e envia um alerta em tempo real quando uma formação
BOS CHOCH STRUCTURE DETECTOR BOS CHOCH STRUCTURE DETECTOR é um indicador de estrutura de mercado para MetaTrader 5, desenvolvido para identificar e exibir visualmente eventos de Break of Structure (BOS) e Change of Character (CHoCH) diretamente no gráfico. O indicador detecta máximas e mínimas de swing usando um período Swing Lookback configurável e monitora os fechamentos de preços subsequentes para identificar rompimentos desses níveis estruturais. Quando um rompimento estrutural é detectado,
Phoenix Orb Asia
Nigel Nii Darku Narnor Darko
This is a professional-grade institutional toolkit designed for breakout traders and trend followers worldwide. It specializes in the  Opening Range Breakout (ORB)  strategy—one of the most consistent ways to capture intraday volatility during the London and New York opens. This indicator does the heavy lifting for you by automatically mapping out the high and low of the first 15 minutes of any session. It combines this with  Smart Money Concepts (SMC) , identifying structural shifts like  BOS
Aussenstab Markttechnik
Alexander Josef Zeidler
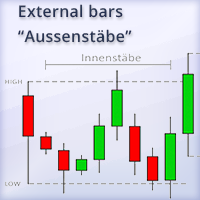
This indicator shows external bars ("Aussenstäbe") in the chart in candle form. The colors of the candles can be set individually. Also different colors for bearish and bullish bars are possible. In addition, the color of the wicks or outlines is also adjustable. Outside bars are mentioned e.g. by Michael Voigt in the book "Das große Buch der Markttechnik". All other candles are inner bars.
Veltrion Smart Fibonacci   is a clean automatic Fibonacci structure overlay for MetaTrader 5. It automatically detects recent swing highs and swing lows, then draws key Fibonacci retracement levels directly on the chart. The indicator is designed to help traders visualize market structure, retracement zones, and the golden zone without manually drawing Fibonacci tools. Key Features Automatic swing high and swing low detection Clean Fibonacci retracement overlay Horizontal Fibonacci levels for a
Este quadro de tempo múltiplo e indicador de vários símbolos procura barras de pinos, estrelas da manhã / noite, engolfamentos, pinças, três linhas de ataque, barras internas e flâmulas e triângulos.   O indicador também pode ser usado no modo de gráfico único. Por favor, leia mais sobre esta opção no produto   blog .   Combinado com suas próprias regras e técnicas, este indicador permitirá que você crie (ou aprimore) seu próprio sistema poderoso. Recursos Pode monitorar todos os símbolos visíve
Smart Pivot Points para MetaTrader 5 — Níveis Claros para Negociações Inteligentes O Smart Pivot Points é um indicador profissional para o MetaTrader 5 que calcula e exibe automaticamente um conjunto completo de níveis de negociação chave no gráfico. Transforma o caos da ação do preço num mapa estruturado e claro, destacando zonas de suporte, resistência, equilíbrio de preços e potenciais alvos. Concebida para traders que valorizam a clareza, a ferramenta funciona em qualquer mercado: Forex, cr
H4 Structure Entry Dashboard is a professional multi-timeframe trading assistant that combines H4 market structure with H1/M15 entry confirmation , displayed through a clean on-chart dashboard and clear BUY/SELL arrows . It is designed for traders who want fast, structured decision-making: Structure first (H4) → Entry second (H1/M15). Key Features True multi-timeframe logic Higher timeframe bias from H4 Entry confirmation on H1 or M15 Market Structure Tools (H4) Automatically detects and draws
Power House
Sabrina Hellal
PowerHouse v3 MT5 – Advanced Smart Money Concepts, KAMA Ribbon & MTF Matrix Short Summary: An institutional-grade SMC & ICT trading system featuring confirmed CHoCH/BOS market structure breaks, a 7-factor confluence engine (Grade A/B/C), adaptive trend ribbon, automated trade plans with live Won/Lost points metrics, and a 6-timeframe dashboard. Product Overview PowerHouse v3 is a professional-grade analytical indicator built for disciplined Forex, Indices, and Crypto traders on MetaTrader 5. Eng
Desenhe um nível e observe como o preço reage depois que o acompanhamento começa. O Support Resistance Price Action para MetaTrader 5 trabalha com suas linhas horizontais, zonas retangulares e linhas de tendência. Registra toques, rejeições e rompimentos e reúne estatísticas do movimento seguinte. Crie um objeto no gráfico, selecione-o e clique em Track. O indicador registra sua geometria e o horário de ativação. Eventos anteriores a esse momento não entram nas observações da versão ativada do n
is a versatile analytical tool designed for both advanced traders and beginners. It combines classic trend line analysis with automatic Fibonacci level plotting to deliver precise market entries and structural clarity. Built as an intuitive and clean on-screen dashboard, this indicator simplifies multi-timeframe analysis without cluttering your main workspace. Technical Analysis and Entry Points The indicator automates the most critical aspects of price action and structural trading: Trend L
Este indicador multi-quadro de tempo e vários símbolos identifica os padrões duplo superior / inferior, cabeça e ombro, flâmula / triângulo e bandeira. Também é possível configurar alertas apenas quando uma ruptura do decote / triângulo / mastro tiver ocorrido (ruptura do decote = sinal confirmado para parte superior / inferior e cabeça e ombros).       O indicador também pode ser usado no modo de gráfico único. Por favor, leia mais sobre esta opção no produto   blog . Combinado com suas própria
My Point MT5
Claudia Ramona Angerer
Diagnosis of major and minor pivot Trend detection with many signals Can be used in all symbols Can be used in all time frames Settings: Back Show: The number of candles it displays If you need any adjustments, or have any questions or suggestions, message me How to trade: Blue: sell signal Red: buy signal Blue and red at the same time: no signal Exit signal: Opposite signal
Fibozonesv1pro
Ignacio Souza Hermida
FiboMaster Pro — Automatic Fibonacci with Entry, SL & TP Automatic swing detection and Fibonacci levels with entry, stop loss, and take profit zones, drawn on any instrument and timeframe. FiboMaster Pro automatically detects the most recent swing high and swing low on your chart and draws the full Fibonacci retracement along with reference entry, stop loss, and two take profit levels — no manual drawing required. HOW IT WORKS The indicator scans the last N candles (configurable), identifies the
The  OBV MTF  is an Enterprise-grade On-Balance Volume indicator that transforms standard OBV into a complete trading system. It combines gradient-aware momentum analysis, divergence detection, multi-timeframe alignment, and dynamic customisable midpoint-filtering in a single intuitive professional volume analysis tool. Core Features 1. 5-State Momentum Engine Aqua (Strong Bullish) : OBV slope rising with positive acceleration SteelBlue (Weak Bullish) : OBV rising but losing momentum Gray (Neutr
Adaptive Math Zones Indicator é um indicador profissional para MetaTrader 5, desenvolvido para automatizar a visualização da estrutura de mercado por meio de canais matemáticos, zona neutra e projeções de preço. O indicador constrói automaticamente o canal de referência, identifica a zona neutra e projeta níveis futuros (50%, 100% e 200%), facilitando a leitura do mercado e reduzindo erros comuns do desenho manual. É uma ferramenta discricionária, criada para traders que já operam com estrutura,
An all‑in‑one trading assistant that blends AI candle synthesis with a 15‑pattern Heat Map, ATR‑scaled S/R & pivots, and a Vigilant risk monitor (LOC/TF/SR/PAT gates, Ready%, EM points, SR‑distance bar). The Opportunity Advisor adds ETAs, checklists and gate status; Multi‑TF Confluence confirms alignment from M1–D1. The Professional Trade Suggestion panel shows regime, session filter, R:R presets, Partials and Quality Pause. Clean, readable UI with one‑click S/R toggles, scanners and a built‑in,
ICT Institutional Zones Pro
Celestine Anyango Wabomba
ICT Institutional Zones Pro — Trade with Institutional Precision Stop wasting time manually drawing key ICT levels every day. ICT Institutional Zones Pro is a professional-grade MT5 indicator built for traders who use ICT (Inner Circle Trader) and Smart Money Concepts (SMC) to read market structure with precision. This indicator automatically maps the most important institutional levels directly on your chart, helping you instantly identify where smart money is likely accumulating, distributing
Pivot Scenario Dashboard is a compact trading indicator designed to display daily pivot-based market structure in a clean and professional dashboard. It automatically calculates the main pivot level, support and resistance zones, and scenario-based market bias for the current symbol. The indicator helps traders quickly identify: main pivot level bullish and bearish trigger areas support and resistance levels target projection levels current market scenario in a compact dashboard Main Features: D
IchimokuStructure
Venicius Soares Da Silva
O Ichimoku Structure S/R é um painel de monitorização na janela do gráfico M1: classifica a posição do preço em relação à Tenkan, Kijun e à nuvem como bullish (altista), bearish (baixista) ou lateral (range); apresenta o nível Ichimoku mais próximo como referência dinâmica de Suporte/Resistência (S/R); identifica ruturas impulsivas contrárias a essa estrutura, com contexto histórico; e permite, opcionalmente, monitorizar a execução das operações em comparação com as cotações, bem como apresentar
Chart Candle Timer Pro
Alireza Gholamreza Mohammadi
Chart Candle Timer Pro is a professional candle countdown panel for MetaTrader 5. It displays a compact, elegant dashboard on your chart that shows the time remaining until the next candle opens, along with essential market data at a glance. The panel updates every 200 milliseconds, ensuring a smooth and accurate countdown. It works on all standard timeframes from M1 to MN and adapts its time format automatically, showing HH:MM:SS for higher timeframes and MM:SS for shorter ones. User Guide
FREE
Sobre la base del concepto físco de  "Cantidad de Movimiento"  construimos este indicador/oscillador, que pretende darnos idea de entradas y salidas en el mercado. En mecánica clásica, la   cantidad de movimiento   se define como el producto de la masa del cuerpo (volumen) y su velocidad (rapidez con la varía el precio) en un instante determinado. p=M*V Se trata de un indicador/oscilador que pretende identificar momentos de entrada y salida basados en la fuerza o presión a ambos lados del preci
Liquidity Map
Alex Amuyunzu Raymond
Liquidity Map  Overview The Liquidity Map indicator is an advanced visualization tool based on ICT Smart Money Concepts . It automatically identifies daily Buy Zones , Sell Zones , and Liquidity Levels , showing where price is likely to reverse or continue based on institutional order flow. It calculates key levels from the daily session — such as the previous day’s high, low, and midpoint — then derives a premium (sell bias) and discount (buy bias) structure. When price trades into these mapped
Trading Discipline Trend Dashboard lê apenas o histórico de operações já fechadas da sua própria conta e transforma quatro padrões específicos numa tendência de 7 dias, para que você veja se algo acontece uma única vez ou se repete toda semana. Não prevê nem aconselha. Cada número no painel é algo que já aconteceu nesta conta. Como os números são construídos: ele lê até 37 dias de negócios fechados em todos os símbolos e todos os magic numbers - é uma visão da conta inteira, não apenas do símbo
Este indicador de multitemporal e símbolo múltiplo identifica formações superiores / inferiores duplas ou triplas ou um rompimento do decote seguinte (superior / inferior confirmado). Ele oferece RSI, barra de pinos, engolfante, pinça, filtros de estrela da manhã / noite, bem como opções de filtro de divergência, o que torna possível filtrar apenas as configurações mais fortes.       O indicador também pode ser usado no modo de gráfico único. Por favor, leia mais sobre esta opção no produto   bl
BOS Structure Radar MT5 Structure-Based BUY/SELL Bias, Confidence Score and Trade Plan Dashboard for MetaTrader 5. BOS Structure Radar MT5 automatically maps Break of Structure, support and resistance, liquidity levels, premium/discount context, higher-timeframe bias, and BUY/SELL setup conditions directly on your MT5 chart. It is designed for discretionary traders who want to reduce manual chart work and read market structure faster. BOS Structure Radar MT5 is a professional market-structure
ENGLISH VERSION (for MQL5 Market) Product Description: RSI Trend & Volatility Dashboard (Multi-Timeframe Filter) This professional dashboard provides traders with an ultimate market overview inside a single chart. It continuously monitors the trend direction across 5 timeframes simultaneously: M5, M15, M30, H1, and D1 [MQL5]. No more tedious chart switching or multi-window clutter – see everything from quick scalping moves to global institutional daily trends in real-time [MQL5]. Key Adva
Indices Metals MTF Scanner Analise os principais índices globais e metais preciosos em vários períodos de tempo através de um único painel profissional. O CapitalSol Indices Metals MTF Scanner é uma ferramenta de análise multi-símbolo e multi-timeframe para MetaTrader 5. O scanner analisa a relação entre uma EMA rápida e uma EMA lenta em quatro timeframes configuráveis. A configuração padrão utiliza EMA 20 / EMA 50 e M15, H1, H4 e D1 . Quando a EMA rápida está acima da EMA lenta, o timeframe é c
Institutional Orderflow Entry Scanner Volume Profile • Value Area • Order Blocks • Multi-Symbol Scanner Turn your chart into a professional institutional order-flow cockpit. This indicator scans up to 60 Market Watch symbols in real time, detects high-probability setups from three proven Value-Area strategies, and delivers clean, actionable entries with institutional-grade risk management — all on a single, flicker-free interface. What It Does The scanner continuously analyses the previous sess
TCM SMC Indicator for MetaTrader 5 marks market structure on your chart: supply and demand zones, breaks of structure, liquidity grabs and fair value gaps. Everything is calculated from closed candles. What it shows - Fresh supply and demand zones, extended to the right until price returns to them, with the option to also show zones that have been revisited - Breaks of structure (BOS), labelled on the chart - Liquidity grabs (LQG), where price runs a recent high or low and turns back - Fair valu
Os compradores deste produto também adquirem
Trend Sniper X
Sarvarbek Abduvoxobov
4.86 (44)
Trend Sniper X é um indicador de acompanhamento de tendência para múltiplos tempos gráficos no MetaTrader 5 que ajuda os traders a identificar a direção da tendência e potenciais pontos de reversão com clareza e precisão. para MT4: https://www.mql5.com/en/market/product/193245 Informações sobre o preço: O preço atual é promocional e está sujeito a alterações à medida que novas atualizações e funcionalidades forem lançadas. Oferta Bônus: Para obter o Auto-Trade Assistant EA GRATUITO para este in
Um novo Rei chegou à cidade - Indicador + Gestão de Ordens (TP1 + TP2 + TP3) + Enviador opcional de sinais para Telegram INCLUÍDO (GRÁTIS) (SISTEMA COMPLETO DE TRADING e SINAIS) Nosso melhor EA para Ouro: Gold Slayer Este indicador inclui uma estratégia avançada, um sistema de trading com gestão de ordens personalizável e um sistema de reversão à média que combina extensões de envelopes, apoiado por múltiplos filtros inteligentes de confirmação, como o RSI, para capturar entradas de reversão de
Smart Trend Trading System — MetaTrader 5 Após a compra, envie-me uma mensagem no MQL5 para receber Smart Universal Expert Advisor GRÁTIS, além do curso online, do manual em PDF e do acesso ao grupo privado. O STTS reúne a direção da tendência, sinais de entrada e saída, zonas de reversão e níveis de preço importantes diretamente no seu gráfico. Siga o sistema manualmente ou conecte um EA compatível separado para executar operações automaticamente com as configurações que você escolher. UM SISTE
O Entry Points Pro mostra onde entrar, onde colocar o stop e com qual lote operar — antes de você colocar a ordem. PREÇO Agora 149 USD, e esta é a última cópia por este preço. Depois o preço sobe para 199 USD, e o preço final é 349 USD. Eu ganho meu dinheiro operando nos mercados e mostro isso, por isso não preciso vender este indicador para todo mundo. É uma ferramenta para traders que pensam por conta própria, não um botão mágico. A seta aparece no fechamento da vela e não repinta. Duas confi
Tenha sua vantagem no trading à vista! M5 Sniper é um novo indicador da MeanFX. Ele combina sinais de trading precisos com níveis adaptativos de TP/SL — criando, como resultado, as melhores operações estatísticas possíveis! O preço aumenta a cada 5 compras, o próximo preço é de 69$ Envie-me uma mensagem após a compra para receber dicas/guia e um EA bônus O que o faz se destacar? Desempenho estatístico comprovado no Gold XAUUSD ( funciona em praticamente todos os ativos , com foco em dominar um ú
SuperScalp Pro
Van Minh Nguyen
4.54 (37)
SuperScalp Pro - Professional Multi-Layer Confluence Scalping System O SuperScalp Pro é um indicador avançado de scalping que aprimora o Supertrend clássico com vários filtros inteligentes de confirmação. Ele ajuda a identificar oportunidades de Buy/Sell com maior probabilidade de sucesso, reduzindo significativamente os sinais falsos. Setas claras de Buy e Sell aparecem diretamente no gráfico, juntamente com os níveis de Stop Loss e Take Profit baseados em ATR, calculados automaticamente em tem
Gold Trend Coach MT5
Cristhian Alexander Gaibor Cuasquer
4.2 (10)
Gold Trend Coach é um indicador de tendência para o ouro (XAUUSD) no MetaTrader 5 com sinais de compra e venda, stop loss e três take profit confirmados no fechamento da vela (não repinta), um coach que te guia da entrada até o TP3, um painel multi-timeframe e alertas no celular e no Telegram. Feito para scalping em M1 e M5 e intraday em M15 nas sessões de Londres e Nova York. BÔNUS: EA de auto-trading GRÁTIS para o Gold Trend Coach. Me envie uma mensagem depois da compra e eu envio o EA que ope
SMC Intraday Formula
VividMind Digital Solutions
5 (26)
Vamos ser honestos primeiro. Nenhum indicador sozinho vai te tornar lucrativo. Se alguém te disser o contrário, está te vendendo um sonho. Qualquer indicador que mostre setas perfeitas de compra/venda pode ser feito para parecer impecável — basta dar zoom na parte certa da história e tirar um print das operações vencedoras. Nós não fazemos isso.  SMC Intraday Formula é uma ferramenta. Ela lê a estrutura do mercado para você, identifica as zonas de maior probabilidade de preço e mostra exatament
Gann Made Easy   é um sistema de negociação Forex profissional e fácil de usar, baseado nos melhores princípios de negociação usando a teoria do sr. W. D. Gann. O indicador fornece sinais precisos de COMPRA e VENDA, incluindo níveis de Stop Loss e Take Profit. Você pode negociar mesmo em movimento usando notificações PUSH. Entre em contato comigo após a compra para receber instruções de negociação e ótimos indicadores extras gratuitamente! Provavelmente você já ouviu muitas vezes sobre os método
Ultra Indicator
Ihor Otkydach
5 (1)
O ULTRA é um indicador técnico que funciona numa base «tudo-em-um» — analisa o mercado de forma independente, gera sinais de negociação, apresenta níveis para definir ordens de stop-loss e sugere quando encerrar as negociações para garantir lucros ou minimizar perdas. Por outras palavras, não importa se não sabe analisar o mercado, determinar níveis — onde definir o seu stop-loss — ou se tem dificuldades com a gestão do capital. O ULTRA fará tudo isso por si! BÓNUS PARA O COMPRADOR: Após adquiri
Boba Analysis Suite
Trade Ready Solutions LLC
5 (2)
Boba Analysis Suite O Boba Analysis Suite é um indicador de análise para o MetaTrader 5. Reúne a estrutura do mercado, as zonas de preço relevantes e o contexto geral do mercado numa única visualização do gráfico. Desenvolvido a partir da experiência prática como trader e formador de traders, apoia um processo de análise estruturado: avaliar a direção do mercado, identificar níveis importantes e analisar vários períodos gráficos em conjunto. Análise em contexto O significado de cada sinal depend
Próxima Atualização — Versão 2.52 em Breve! [NOVO] Prepare-se para 4 Grandes Novos Recursos Projetados para Aprimorar sua Análise de Mercado e seu Fluxo de Trabalho de Trading Estamos levando a análise de mercado a um novo nível com 4 novos recursos desenvolvidos para atender às suas necessidades de trading. Apresentamos: 1. TRADE OVERVIEW DASHBOARD 2. CONFLUENCE AT ZONE 3. STRONG & WEAK HIGH/LOW 4. OTE 1. TRADE OVERVIEW DASHBOARD Um painel que ajuda você a compreender mais facilmente o panoram
M1 Sniper MT5
Oleg Rodin
5 (7)
O   M1 SNIPER   é um sistema indicador de negociação fácil de usar. É um indicador de seta projetado para o período M1. O indicador pode ser usado como um sistema independente para scalping no período M1 e pode ser usado como parte do seu sistema de negociação existente. Embora este sistema de negociação tenha sido projetado especificamente para negociação no M1, ele também pode ser usado em outros períodos. Originalmente, desenvolvi este método para negociar XAUUSD e BTCUSD. Mas considero-o úti
FiboSniper Pro
Van Minh Nguyen
5 (4)
FiboSniper Pro – Multi-Filter Fibonacci System with Auto SL/TP and Control Panel FiboSniper Pro é um indicador técnico que combina Fibonacci Envelopes dinâmicos com vários filtros de confirmação para gerar sinais seletivos de Buy e Sell. Os níveis de Fibonacci são calculados com base em Moving Average e ATR e, em seguida, filtrados por ADX, EMA, RSI, ATR, Volume, Time e estrutura das velas. O indicador exibe diretamente no gráfico os níveis automáticos de Stop Loss e Take Profit baseados em ATR,
Auto Optimized SpeedAngle é um sistema de vetorização de momentum de nível institucional que elimina o sobreajuste ( curve-fitting ) por meio da otimização contínua de avanço ( Walk-Forward Optimization , WFO). Em vez de depender de entradas estáticas que se degradam quando os regimes de mercado mudam, o indicador recalibra dinamicamente seus parâmetros utilizando validação fora de amostra ( Out-of-Sample , OOS), garantindo que os sinais exibidos representem vantagens estatísticas genuínas e não
Adaptive Price Action Engine Compre um indicador, ganhe o EA de graça Análise Auto-Otimizada de Tendências e Padrões de Candlestick em Múltiplos Timeframes Os mercados estão em constante mudança, e nem todos os padrões de Price Action têm o mesmo valor em todas as condições de mercado. O Adaptive Price Action Engine foi desenvolvido para se adaptar às mudanças nas condições do mercado, combinando estrutura de tendência, análise Multi-Timeframe, padrões de candlestick e otimização estatística em
Crystal Heikin Ashi Signals
Muhammad Jawad Shabir
5 (5)
Crystal Heikin Ashi Signals—Professional Trend & Signal Detection Indicator Advanced Heikin Ashi Visualization with Intelligent Signal System for Manual & Automated Trading Final Price: $149 ---------> Price goes up $10 after every 10 sales . Limited slots available — act fast . Overview User Guide PDF Crystal Heikin Ashi Signals is a professional-grade MetaTrader 5 indicator that combines pure Heikin Ashi candle visualization with an advanced momentum-shift detection system. Designed for both m
O Scalper Vault é um sistema de negociação poderoso e completo, projetado para traders que buscam consistência em operações intraday. Este indicador de alta precisão funciona como um sistema de negociação autônomo, oferecendo análises de nível institucional tanto para o mercado Forex quanto para Opções Binárias. ENTRE EM CONTATO COMIGO APÓS A COMPRA PARA RECEBER DICAS DE NEGOCIAÇÃO E UM BÔNUS EXCLUSIVO! Ao eliminar suposições e análises manuais complexas, o Scalper Vault permite que você foque
Trend Catcher ind mt5
Ramil Minniakhmetov
5 (18)
INDICADOR TREND CATCHER O Indicador Trend Catcher analisa os movimentos de preços do mercado, utilizando uma combinação de indicadores de análise de tendências adaptativos, proprietários e personalizados pelo autor. Identifica a verdadeira direção do mercado, filtrando o ruído de curto prazo e focando a força do momentum subjacente, a expansão da volatilidade e o comportamento da estrutura de preços. Utiliza também uma combinação de indicadores personalizados de suavização e filtragem de tendê
Atomic Analyst MT5
Issam Kassas
4.5 (64)
Atomic Analyst — MetaTrader 5 Após a compra, envie-me uma mensagem no MQL5 para receber Smart Universal Expert Advisor GRÁTIS, além do curso online, do manual em PDF e do acesso ao grupo privado. O Atomic Analyst reúne a ação do preço, a direção da tendência, sinais de entrada e saída, Stop Loss e vários níveis de Take Profit diretamente no seu gráfico. VEJA O SINAL. ENTENDA O CENÁRIO. O Atomic Analyst organiza sua análise em informações visuais claras: • Setas de compra e venda para identificar
Unix Scalper
Issam Kassas
4 (4)
Unix Scalper — MetaTrader 5 Após a compra, envie-me uma mensagem no MQL5 para receber Smart Universal Expert Advisor GRÁTIS, além do curso online, do manual em PDF e do acesso ao grupo privado. Identifique a oportunidade. Veja o plano. Escolha como operar. O UNIX Scalper reúne análise de mercado, decisões BUY/SELL/WAIT e níveis de Entry, Stop Loss, TP1 e TP2 em um painel organizado. VEJA O SINAL E O PLANO • Decisões claras: BUY, SELL ou WAIT. • Níveis definidos: Entry, Stop Loss, TP1 e TP2. •
SIO Oscillator: oscilador auto-otimizável de desequilíbrio de semivariância Compre o indicador e receba GRÁTIS o Expert Advisor (EA) baseado nele. A maioria dos osciladores trata todo movimento de preço da mesma forma. O SIO separa a pressão de alta da pressão de baixa e mede o desequilíbrio entre elas, mostrando qual lado realmente controla o mercado: compradores ou vendedores. Quando o desequilíbrio atinge um extremo, o SIO gera um sinal claro com níveis de entrada, Stop Loss e Take Profit. O
Volatility Master for MetaTrader is a real-time dashboard tool that scans up to  50 symbols  to identify high-volatility , trending markets instantly. With bullish/bearish signals, customizable alerts, and a user-friendly interface, it helps you avoid range-bound conditions and focus on high-probability trades. Clarity leads to confidence. Trade confidently and protect your capital effectively with this powerful dashboard. We don't offer free or bonus indicators in exchange of reviews from you.
Smc Pro ToolKit
Talal N Z Aljarusha
5 (14)
SMC PRO TOOLKIT — SMART MONEY ANALYSIS & STRUCTURED TRADE PLANNING SMC Pro ToolKit is a professional Smart Money Concepts analysis workspace for MetaTrader 5. It combines market structure, multi-timeframe analysis, institutional price zones, setup evaluation, confirmation tools, volume context, alerts, and risk planning inside one organized chart environment. One workspace. Multiple layers of confirmation. One structured trading plan. OPEN COMPLETE USER GUIDE MULTI-CONDITION SETUP ENGINE At
Indicador multi-moeda de força e momentum MT5 O Dynamic Forex28 Navigator é a evolução dos nossos indicadores populares de longa data, reunindo o poder de cinco em um: Advanced Currency Strength28 Indicator (700 avaliações) Advanced Currency IMPULSE with ALERT (530 avaliações) Currency Strength EXOTICS GOLD Impulse with Alert CS28 Combo Signals (bônus atual) Não é necessário comprar quatro indicadores e empilhá-los nos seus gráficos. Tudo está reunido em um único indicador poderoso: a força dos
Neuro Poseidon MT5
Daria Rezueva
4.68 (53)
Neuro Poseidon is a new indicator by Daria Rezueva. It combines precise trading signals with adaptive TP/SL levels - creating best possible trades as a result! Message me and get  Neuro Poseidon Assistant  as a gift to automize your trading process! What makes it stand out? 1. Proven profitability on all assets and timeframes 2. Only confirmed BUY and SELL signals present on the chart 3. Adaptive TP & SL levels generated by the software for each trade 4. Easy to understand - suitable for al
PZ Swing Trading MT5
PZ TRADING SLU
5 (5)
Swing Trading é o primeiro indicador projetado para detectar oscilações na direção da tendência e possíveis oscilações de reversão. Ele usa a abordagem de negociação de linha de base, amplamente descrita na literatura de negociação. O indicador estuda vários vetores de preço e tempo para rastrear a direção da tendência agregada e detecta situações nas quais o mercado está sobrevendido ou sobrecomprado em excesso e pronto para corrigir. [ Guia de instalação | Guia de atualização | Solução de prob
Azimuth Pro
Ottaviano De Cicco
5 (7)
Azimuth Pro V2: Estrutura Fractal Sintética e Entradas Confirmadas para MT5 Visão geral Azimuth Pro é um indicador de estrutura swing multinível da Merkava Labs . Quatro camadas de swing aninhadas, VWAP ancorado em swings, detecção de padrões ABC, filtragem estrutural de três timeframes e entradas confirmadas em barra fechada — um gráfico, um fluxo de trabalho dos micro-swings aos macro-ciclos. Este não é um produto de sinais cegos. É um fluxo de trabalho baseado em estrutura para traders que v
SkyHammer Signal Pro Indicador profissional de sinais de tendência sem repaint, com níveis Entry, SL e TP bloqueados SkyHammer Signal Pro é um indicador estruturado de tendência e momentum, desenvolvido para traders que procuram sinais claros, fixos e verificáveis. Funciona melhor em timeframes baixos, como M1 e M5 . O indicador não tenta prever topos ou fundos do mercado. Em vez disso, ele aguarda estrutura de mercado confirmada, direção de tendência, força de momentum, volatilidade saudável e
Torne-se um Negociador Breaker e lucre com as mudanças na estrutura do mercado à medida que o preço reverte. O indicador de quebra de bloco de pedidos identifica quando uma tendência ou movimento de preço está chegando à exaustão e pronto para reverter. Ele o alerta sobre mudanças na estrutura do mercado, que normalmente ocorrem quando uma reversão ou uma grande retração está prestes a ocorrer. O indicador usa um cálculo proprietário que identifica rupturas e momento do preço. Toda vez que um
Mais do autor
See the Dow Theory direction of six timeframes in one panel. DowgatorPro2 judges the current trend direction (up or down) automatically by Dow Theory, using closed bars only. It carries over the features of the earlier e-DowgatorPro and puts first that even a beginner can read the direction without confusion. The direction of six timeframes (M1 to D1) is shown on the panel in color. Features Check direction mismatch: see on the panel whether your chart's timeframe agrees with the higher timefram
The levels of higher timeframes, on the chart you are watching. LineTraderPro2 finds swing highs and lows with Dow Theory rules and draws horizontal lines at the levels the market watches, for any of 20 timeframes from M1 to W1. Each line is labeled with its timeframe (H1, D1 and so on) and the date of the swing, so you can see at a glance which timeframe a level belongs to without switching charts. What you see on the chart Horizontal lines: the swing highs above the price and the swing lows be
See the market's fear level on the chart you trade. VixChecker shows the VIX (the volatility index often called the fear index) in a sub-window as one bar per day, colored by level: normal (blue), caution (yellow, 20 or above by default) and fear (red, 30 or above). The current value, the change from the previous close and the time of the value are shown in a small panel, and the value can also be shown on the main chart. Where the VIX values come from (please read before buying) The indicator d
Round numbers on your chart, and a notice when the price gets close. RoundNumberAlert draws horizontal lines at round numbers (150.000, 150.500 ...) and watches them for you. When the price enters the touch range, only that line blinks and you get one notification. Major round numbers stand out in gold, and a small panel shows how many pips are left to the next round number above and below. Features Round-number lines: the step starts at 10 pips (for example 50 pips: 150.000, 150.500 ...). Major
Entry signals as finger marks: yellow for trend-following, pink for counter-trend. SignRAMB combines RSI, ATR, MACD, a moving average, Dow theory and the candles, and marks the places where the price may turn up or down, based on past chart patterns. A finger pointing up is a buy, pointing down is a sell. Signals are decided on closed bars and never repaint. Signals are not always right. Use them as one indicator, together with your own reading of the chart. They are meant for the move right aft
Which currency is strong right now — in one panel. CurrencyStrength takes the RSI of the 28 pairs of USD, EUR, JPY, GBP, AUD, CHF, CAD and NZD, turns it into a score from −100 to +100 for each currency, and shows them as bars, strongest first. Features Strength ranking: strong currencies in green, weak ones in red, scored from −100 to +100. Automatic symbol detection: the pairs are found from each symbol's base and profit currency, so suffixes and prefixes (EURUSD#, EURUSD.pro, m.EURUSD, EURUSDm
Trendlines drawn for you — and a good shape kept as your basis. TrendLineSnap finds the swing highs and swing lows on your chart, joins them and draws one high trendline and one low trendline. Triangles, channels, wedges and horizontal levels used in line trading show up as lines. Automatic trendlines are redrawn whenever a new swing forms. When you see a shape you want to trade, save it. The saved line does not move. When the price comes near it again, show the saved line next to the current li
Where is the price inside the range — in one panel. BoxRangeSnap looks for price zones where the highs and lows touched the same top and bottom again and again, and draws them as a big box and a small box. The panel keeps showing the distance from the price to the top and bottom of the current box. Features Automatic range boxes: a big box and a small box, newest first. The current box is highlighted and extends to the last closed bar. Adjustable detection: minimum touches on the top and bottom,
The Dow Theory structure of the chart — in one look. DowTheoryVisual labels every swing high and low as HH, HL, LH or LL and draws a zigzag colored by the trend: blue for an uptrend, red for a downtrend, gray for a range. The panel keeps showing the trend of the current chart and of two higher timeframes side by side. Features HH / HL / LH / LL labels: each swing high and low is compared with the previous one. Trend-colored zigzag: up blue, down red, range gray. The color changes on the bar wher
Key levels on nine timeframes, and an alert the moment the price breaks out. Prices that were stopped again and again are levels many traders watch. BreakerDetectPro finds the zones where swing highs and swing lows gather and draws one level above and one below the price for each timeframe you select, from M1 to MN1. Higher-timeframe levels are drawn on the chart you are looking at. Features Automatic key levels: one level above and one below the price, from swing highs and lows that gather in t
A small, rule-based edge from the Japanese calendar. For traders who want an EA that never averages down, and for GoldHam users looking for a second EA. It trades only on Gotobi mornings with a stop placed with every order, so its trading days and hours rarely overlap with GoldHam, which trades gold every day (use separate accounts). In Japan, the 5th, 10th, 15th, 20th, 25th and the last day of the month are called "Gotobi". Many Japanese importers settle their dollar payments on these days, so
A gold 1-minute basket EA, profit-seeking type. For traders who want to grow a small account. You pick only the multiplier and the lot grows with your balance. It trades heavier than its sister GoldHam Shield and grows faster; if you would rather keep drawdowns shallow, choose Shield instead. GoldHam Blade trades gold on the 1-minute chart. When price moves against the first entry it adds positions in the same direction, and closes all of them together once the basket is back in profit. Blade gr
A gold 1-minute basket EA, steady type. For traders who want shallow drawdowns and a long run. You choose fixed or compounding lots; at multiplier 1.0 fixed, the deepest drawdown over two years was 6%. It enters on the same signals as GoldHam Blade, only lighter, so pick one of the two rather than both. GoldHam Shield uses the same gold 1-minute basket logic as GoldHam Blade, with lighter positions and a cap on the deepest levels. You choose fixed lots or compounding, and a multiplier of 1.0 (re
A gold 1-minute EA, aggressive type, tuned to today's gold market. You choose two things: the multiplier and how far the balance may dip for a while (the accepted drawdown). At start-up the EA works out how many grid levels fit inside that drawdown; with 3.5 and 50 percent it is 17 levels. When price moves against the first entry, it adds positions in the same direction and closes the whole basket together once it is back in profit. How it differs from the other GoldHam EAs Blade and Shield keep
Copy trades between MT4 and MT5 terminals on one computer. CopyHam Inside Sender is the master side of a trade copier. Attach it to the account you want to copy from. It shows a Receiver code (CT-XXXX-XXXX) on its panel. Paste that code into CopyHam Inside Receiver on the other terminals, and they follow every trade of this account. The Sender and the Receivers exchange data through the common data folder of MetaTrader on the same computer. Nothing is sent over the internet, so there is no URL t
Follow a master account from another terminal on the same computer. CopyHam Inside Receiver is the follower side of a trade copier. Paste the Receiver code shown on CopyHam Inside Sender (CT-XXXX-XXXX) into its inputs, and this account opens, modifies and closes the same trades as the master. The data is exchanged through the common data folder of MetaTrader on the same computer. Nothing is sent over the internet. The master may be MT4 or MT5 and may be with a different broker. What is copied Ma
TradeHam Manager is a trade panel for manual traders. You decide when and where to trade. The panel takes care of the lot size, the order and the clean-up. It does not open trades on its own. It has no entry logic and does not promise any profit. Main features Risk-based lot size. Set the risk as a percent of balance, a fixed amount of money or a fixed lot. Drag the stop-loss line on the chart and the lot is recalculated. One-click orders. BUY / SELL buttons place the order with stop loss and ta
SignalHamToEA reads a signal indicator that draws arrows on the chart and places orders exactly as the arrows say. No programming is needed. Enter the indicator name and the buffer numbers that hold the buy and sell arrows, and it runs. The EA has no trading method of its own. Whether it enters is decided by the arrows of the indicator you connect, so you can try as many signal tools as you like. Four ways to read signals Buy/sell buffers (arrows), the basic mode One buffer that turns + / - (tre
See the Dow Theory direction of six timeframes in one panel. DowgatorPro2 judges the current trend direction (up or down) automatically by Dow Theory, using closed bars only. It carries over the features of the earlier e-DowgatorPro and puts first that even a beginner can read the direction without confusion. The direction of six timeframes (M1 to D1) is shown on the panel in color. Features Check direction mismatch: see on the panel whether your chart's timeframe agrees with the higher timefram
Know exactly how long until the next release, and what came out. EconomicStopper shows the time to each economic release as a countdown, lists the upcoming events with their importance, and shows the actual value and the surprise against the forecast after the release. Everything is in one panel on the chart. It reads the economic calendar built into MetaTrader 5, so it needs no DLL and no web requests. How it behaves over time More than 5 minutes before: the timer counts down every second and t
See the market's fear level on the chart you trade. VixChecker shows the VIX (the volatility index often called the fear index) in a sub-window as one bar per day, colored by level: normal (blue), caution (yellow, 20 or above by default) and fear (red, 30 or above). The current value, the change from the previous close and the time of the value are shown in a small panel, and the value can also be shown on the main chart. Where the VIX values come from (please read before buying) The indicator d
Round numbers on your chart, and a notice when the price gets close. RoundNumberAlert draws horizontal lines at round numbers (150.000, 150.500 ...) and watches them for you. When the price enters the touch range, only that line blinks and you get one notification. Major round numbers stand out in gold, and a small panel shows how many pips are left to the next round number above and below. Features Round-number lines: the step starts at 10 pips (for example 50 pips: 150.000, 150.500 ...). Major
Entry signals as finger marks: yellow for trend-following, pink for counter-trend. SignRAMB combines RSI, ATR, MACD, a moving average, Dow theory and the candles, and marks the places where the price may turn up or down, based on past chart patterns. A finger pointing up is a buy, pointing down is a sell. Signals are decided on closed bars and never repaint. Signals are not always right. Use them as one indicator, together with your own reading of the chart. They are meant for the move right aft
Which currency is strong right now — in one panel. CurrencyStrength takes the RSI of the 28 pairs of USD, EUR, JPY, GBP, AUD, CHF, CAD and NZD, turns it into a score from −100 to +100 for each currency, and shows them as bars, strongest first. Features Strength ranking: strong currencies in green, weak ones in red, scored from −100 to +100. Automatic symbol detection: the pairs are found from each symbol's base and profit currency, so suffixes and prefixes (EURUSD#, EURUSD.pro, m.EURUSD, EURUSDm
Trendlines drawn for you — and a good shape kept as your basis. TrendLineSnap finds the swing highs and swing lows on your chart, joins them and draws one high trendline and one low trendline. Triangles, channels, wedges and horizontal levels used in line trading show up as lines. Automatic trendlines are redrawn whenever a new swing forms. When you see a shape you want to trade, save it. The saved line does not move. When the price comes near it again, show the saved line next to the current li
Where is the price inside the range — in one panel. BoxRangeSnap looks for price zones where the highs and lows touched the same top and bottom again and again, and draws them as a big box and a small box. The panel keeps showing the distance from the price to the top and bottom of the current box. Features Automatic range boxes: a big box and a small box, newest first. The current box is highlighted and extends to the last closed bar. Adjustable detection: minimum touches on the top and bottom,
The Dow Theory structure of the chart — in one look. DowTheoryVisual labels every swing high and low as HH, HL, LH or LL and draws a zigzag colored by the trend: blue for an uptrend, red for a downtrend, gray for a range. The panel keeps showing the trend of the current chart and of two higher timeframes side by side. Features HH / HL / LH / LL labels: each swing high and low is compared with the previous one. Trend-colored zigzag: up blue, down red, range gray. The color changes on the bar wher
Key levels on nine timeframes, and an alert the moment the price breaks out. Prices that were stopped again and again are levels many traders watch. BreakerDetectPro finds the zones where swing highs and swing lows gather and draws one level above and one below the price for each timeframe you select, from M1 to MN1. Higher-timeframe levels are drawn on the chart you are looking at. Features Automatic key levels: one level above and one below the price, from swing highs and lows that gather in t
A small, rule-based edge from the Japanese calendar. For traders who want an EA that never averages down, and for GoldHam users looking for a second EA. It trades only on Gotobi mornings with a stop placed with every order, so its trading days and hours rarely overlap with GoldHam, which trades gold every day (use separate accounts). In Japan, the 5th, 10th, 15th, 20th, 25th and the last day of the month are called "Gotobi". Many Japanese importers settle their dollar payments on these days, so
A gold 1-minute basket EA, profit-seeking type. For traders who want to grow a small account. You pick only the multiplier and the lot grows with your balance. It trades heavier than its sister GoldHam Shield and grows faster; if you would rather keep drawdowns shallow, choose Shield instead. GoldHam Blade trades gold on the 1-minute chart. When price moves against the first entry it adds positions in the same direction, and closes all of them together once the basket is back in profit. Blade gr
Filtro:
Sem comentários
Responder ao comentário