LineTraderPro2 MTF Horizontal Lines MT4

  • Индикаторы
  • Naoto Shimoda
    Naoto Shimoda
    FX.Hamrat - MetaTrader 4/5 indicator and Expert Advisor developer based in Japan.
    Over 10 years of trading experience (discretionary and systematic), and 90+ MT4/MT5 programs built so far - including 30+ custom-made projects for individual traders.
  • Версия: 2.12
  • Обновлено: 29 сентября 2026
  • Активации: 10

The levels of higher timeframes, on the chart you are watching.

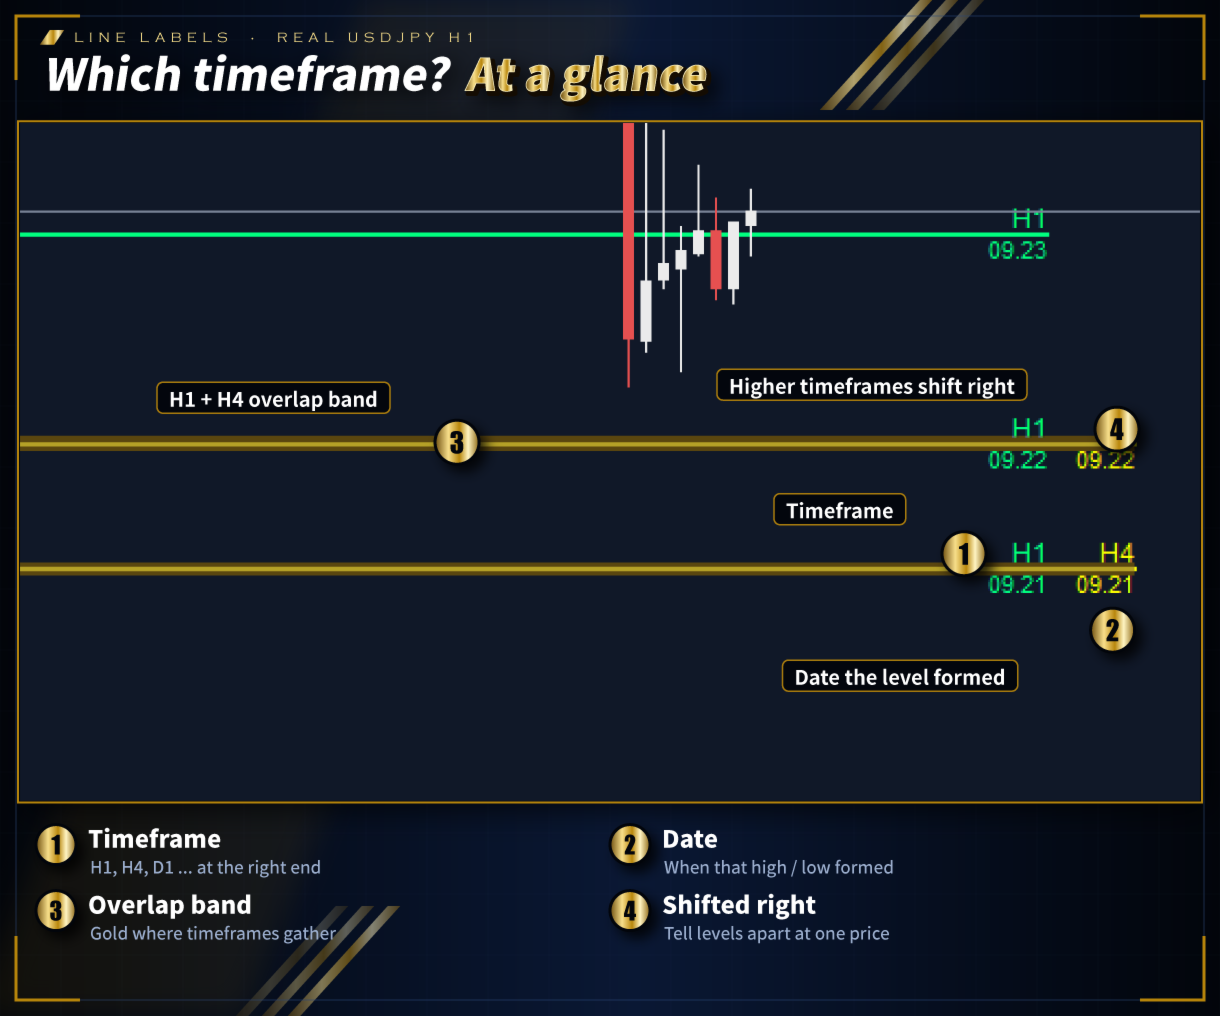
LineTraderPro2 finds swing highs and lows with Dow Theory rules and draws horizontal lines at the levels the market watches, for any of 20 timeframes from M1 to W1. Each line is labeled with its timeframe (H1, D1 and so on) and the date of the swing, so you can see at a glance which timeframe a level belongs to without switching charts.

What you see on the chart

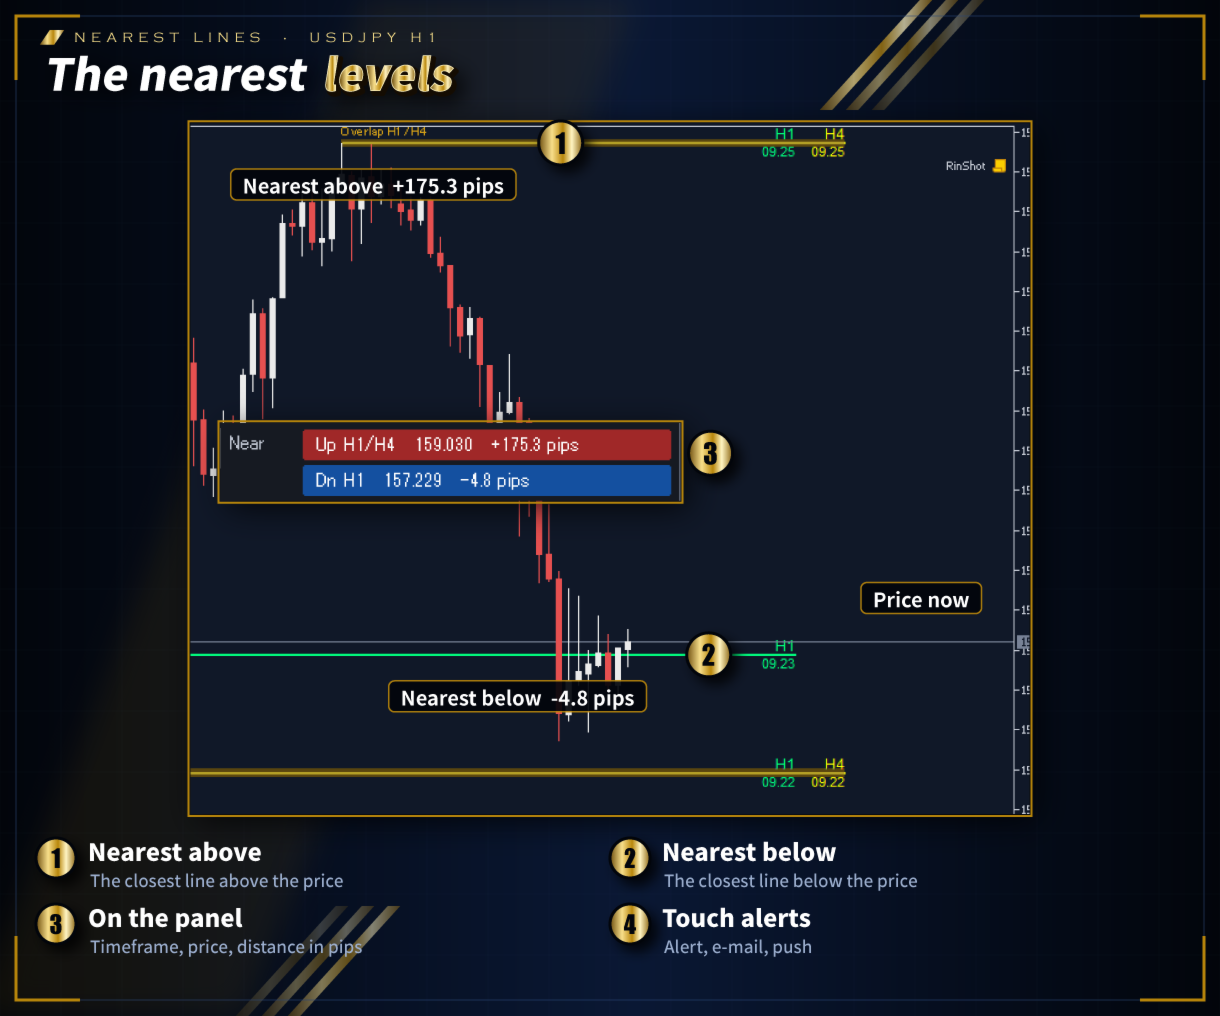
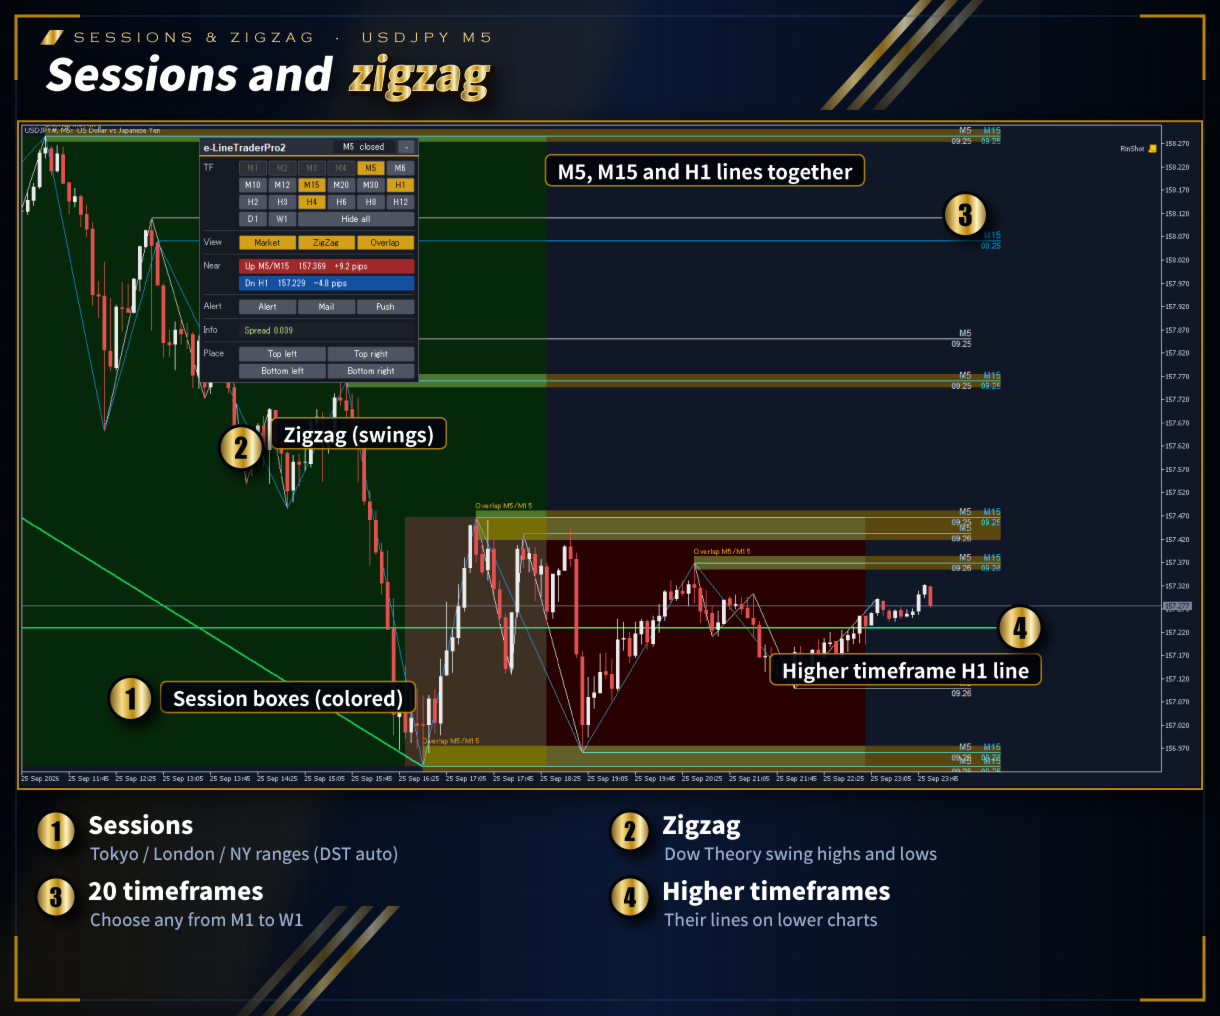
  • Horizontal lines: the swing highs above the price and the swing lows below it, nearest first, for every timeframe you turn on.
  • Labels at the right end of each line: timeframe name and start date. Higher timeframes are shifted to the right so lines at the same price stay readable.
  • Dow Theory zigzag: swing highs and lows joined by a line, for the timeframes shown.
  • Sessions: Tokyo, London and New York drawn as boxes of their high-low range (charts up to H1). Daylight saving time switches automatically.
  • Spread and the time left until the current bar closes.
  • Control panel: one button per timeframe (M1, M2, M3, M4, M5, M6, M10, M12, M15, M20, M30, H1, H2, H3, H4, H6, H8, H12, D1, W1), plus Market, Dow and Del. Drag it to move it.

Details

  • Calculation uses confirmed bars only.
  • Only timeframes equal to or higher than the chart are shown.
  • Works on any symbol.
  • Button language: English or Japanese.
  • No DLL, no external connection.

Inputs (main)

  • Swing bars on each side (default 4)
  • Bars to calculate (default 5,000)
  • Timeframe name and start date labels, and the clock for the date (server time or PC clock)
  • Color and width of the lines for each timeframe
  • Server offset in winter (2 for many brokers) and the colors and hours of the three sessions
  • Panel: show, placement and position

Notes

  • This indicator shows the state of the market. It does not place trades and does not guarantee any result.
  • The demo version of an indicator runs only in the Strategy Tester (visual mode).
Рекомендуем также
Этот мульти-таймфрейм и мультисимвольный индикатор сканируют на наличие образований поглощения и пинцета. Функции Может одновременно отслеживать все символы, отображаемые в окне "Обзор рынка". Примените индикатор только к одному графику и мгновенно отслеживайте весь рынок. Контролирует каждый временной интервал, от M1 до MN, и отправляет вам предупреждение в реальном времени, когда было обнаружено образование поглощения или пинцета. Поддерживаются все собственные типы предупреждений Metatrader.
Индикатор тренда Global Trend , показывает сигналы для входа. Отображает как точки входа, так и сам тренд. Показывает статистически рассчитанные моменты для входа в рынок стрелками. При использовании индикатора можно оптимально распредилить коеффициент риска. Настройки: Использует все один параметр для настроек. Подбирая параметр необходимо визуально подобие так чтоб насоответствующем графике была отмальная проекция экстремумов. Параметры: Length - количеств баров для рассчета индикатора.
NAM Divergences
NAM TECH GROUP, CORP.
5 (1)
MT4 Мультитаймфреймовый индикатор дивергенции и обнаружения перекупленности / перепроданности. Функции - Полностью настраиваемая панель управления графиком, обеспечивает полное взаимодействие. - Скрыть и показать панель управления где угодно. - Информация о расхождениях без заглавной буквы в реальном времени. - Информация в реальном времени о ситуациях перекупленности / перепроданности. - Информация о регулярных расхождениях в реальном времени. - Информация о скрытых расхождениях в реа
Parabolic SAR & Support/Resistance Levels — это не только индикатор технического анализа, используемый в торговле на рынке Форекс для определения потенциальных разворотов тренда и точек входа и выхода, но и готовая автономная торговая стратегия. Индикатор основан на индикаторе PSAR, добавляя на график динамические уровни поддержки и сопротивления, которые могут помочь трейдерам определить ключевые уровни цен, на которых рынок может потенциально развернуться. Используя этот индикатор, трейдеры
Smart Pivot Points для MetaTrader 4 — Четкие уровни для умной торговли Smart Pivot Points   — это профессиональный индикатор для MetaTrader 4, который автоматически вычисляет и отображает на графике полный набор ключевых торговых уровней. Он трансформирует хаос ценового движения в понятную структурную карту, выделяя зоны поддержки, сопротивления, ценового баланса и потенциальных целей. Инструмент создан для трейдеров, которые ценят ясность, и работает на любом рынке:   Форекс, криптовалюты (Bitc
CSS " currency strength slope "  is a a multi currency strength indicator that use Forex major currencies, EUR, USD, CAD, AUD, NZD, JPY, CHF, GBP. it use 28 major pairs to calculate the power of every currency using a based moving averages algorithm : you will see volatility clearly between currencies. input: MA Fast & Slow. - MA Mode : simple, exponential, smoothed, linear weighted - Applied Price : close, open, high, low, median price, typical price, weighted price.
прорыв линии шеи / треугольника / флагштока (прорыв линии шеи = подтвержденный сигнал для вершины / оснований и головы и плеч).   Индикатор также можно использовать в режиме одиночного графика. Подробнее об этой опции читайте в разделе продукта.   блог .       В сочетании с вашими собственными правилами и методами этот индикатор позволит вам создать (или улучшить) вашу собственную мощную систему. Функции Может одновременно отслеживать все символы, отображаемые в окне "Обзор рынка". Примените инд
My Point MT4
Claudia Ramona Angerer
4 (1)
Diagnosis of major and minor pivot Trend detection with many signals Can be used in all symbols Can be used in all time frames Settings: Back Show: The number of candles it displays If you need any adjustments, or have any questions or suggestions, message me How to trade: Blue: sell signal Red: buy signal Blue and red at the same time: no signal Exit signal: Opposite signal
ZoneDominator AI
Mohammad Ziad Abdelwahed Alkahlah
ZoneDominator AI — Adaptive Multi-Timeframe Support & Resistance Indicator Overview ZoneDominator AI is an advanced analytical indicator that continuously scans all timeframes to locate the most accurate and relevant Support & Resistance zones. It uses a unique combination of ATR volatility, Moving Averages, Price Action, and higher-timeframe confirmation to adapt in real time to market structure. You can choose your preferred trading style — Scalping, Intraday, or Swing — and the indicat
Diamonds Min5   - DM5-   DM5   is an indicator that suggests entering levels (sell or buy) ,it always follow the trends using parabolic sar ,  working on is so easy, you need just to attach it to the chart and all the magic will show , this indicator does not repeat itself or redraw signals . After months of testing, it provides a very good result     it works on all pairs with no excaption 
Индикатор Pivots предназначен для отображения разворота на соответствующих таймфреймах. Помимо разворотов, индикатор также отображает линию дневного открытия, уровни поддержки и сопротивления, уровни Фибоначчи ADR и ордер разворота. Индикатор Pivots включает в себя интеллектуальный алгоритм для исключения воскресных свечей в случае, если они есть у вашего брокера. Развороты - значительные ценовые уровни, которые могут служить в качестве уровней поддержки, сопротивления или пробоя. Настройки text
Этот мульти-таймфрейм и мультисимвольный индикатор идентифицирует двойную или тройную вершину / основание или последующий прорыв линии шеи (подтвержденная вершина / основание). Он предлагает RSI, пин-бар, поглощение, пинцет, утренние / вечерние звездные фильтры, а также опции фильтра расхождения MACD, Awesome (AO) или RSI, что позволяет отфильтровать только самые сильные настройки.       Индикатор также можно использовать в режиме одиночного графика. Подробнее об этой опции читайте в разделе про
Цветной индикатор линейного канала по Фибоначчи. Используется для принятия торговых решений и анализа настроений рынка. Границы канала представляют собой сильные уровни поддержки/сопротивления, т.к. являются уровнями пропорций по Фибоначчи. Посредством входных параметров пользователю предоставляется возможность выбора количества отображения линий границ каналов на графике. Многократная загрузка индикатора на график с разными периодами расчетов приводит к отображению системы каналов на графике. Р
Этот уникальный индикатор автоматического рисования линий тренда работает на всех таймфреймах, что может помочь вам легко торговать как при краткосрочных разворотах тренда, так и при краткосрочных прорывах тренда, указывая на более сильный актив на рынке. Это однозначно позволяет вам рано вставать на тяжелые качели. Входы включают: - Максимальное количество свечей оглядывается на линии тренда - Тип и цвет линии - Максимальное расстояние до внешнего диапазона и период действия диапазона - Опции
Implement
Vitalii Zakharuk
5 (1)
Implement анализирует динамику рынка для точек разворота. Если вы хотите узнать, как определить правильные развороты для постоянной вероятной прибыльной торговли, купите этот индикатор. Показывает благоприятные моменты входа в рынок полосками. Готовая торговая система.  Принцип работы индикатора заключается в том, чтобы при размещении на график автоматически определять текущее состояние рынка, анализировать исторические данные, на основании исторических данных и выводить на экран трейдеру указ
Данный индикатор предназначен для определения трендов и подходящих моментов для открытия позиции. Имеется возможность установить Stop Loss. Прост в использовании. Необходимо лишь следить за стрелками. Настройки индикатора Shift - количество баров для смещения индикатора вправо. Shift_SL - количество баров для смещения линии SL индикатора вправо. Aperture - the number of bars used for Aperture Step - количество пипсов для трендовых линий вверх или вниз Dinamic - при 'true' шаг рассчитывается на
Индикатор отправляет сообщения на электронную почту и в мобильный Мета Трейдер, при подходе цены к горизонтальным уровням и трендовым линиям, нарисованным при помощи удобной панели! Уровни и трендовые линии удаляются и наносятся на график в одно нажатие на панели и могут быть перемещены по графику при помощи мыши! В настройках советника можно настроить интервал между сообщениями, интервал применяется к каждому объекту отдельно! Настройки индикатора ===*** Main settings ***=== - ниже следует бло
TCM SMC Indicator for MetaTrader 4 marks market structure on your chart: supply and demand zones, breaks of structure, liquidity grabs and fair value gaps. Everything is calculated from closed candles. What it shows - Fresh supply and demand zones, extended to the right until price returns to them, with the option to also show zones that have been revisited - Breaks of structure (BOS), labelled on the chart - Liquidity grabs (LQG), where price runs a recent high or low and turns back - Fair valu
Anemone
Sean Christian Hammond
Создан с использованием искусственного интеллекта, ИИ, для включения видимых моделей поведения живых организмов в анализ трендов. Теория хаоса встречается со скользящей средней. Фильтр, питающий актинию, протягивает свои усики в море питательных веществ, чтобы обогатить себя. Я не буду тратить ваше время на слишком длинные описания, концепция понятна на этих условиях. Это настраиваемая скользящая средняя с вращающимся периодом, которая переключается между Простой, Экспоненциальной, Взвешенной и
Индикатор тренда Make Use справляется с главной задачей торговли: найти точку входа на рынок в момент зарождения тренда и точку выхода в момент его завершения. Трендом в торговле называют устойчивое движение котировок в определенном направлении. При этом само движение может быть нисходящим, восходящим или боковым, когда движение рынка не имеет ярко выраженной направленности. Индикатор тренда Make Use важен для выявления тенденций на финансовых рынках. Тем не менее, этот индикатор работает не ме
RQL_BOX Indicator — English Description (How to Use) What it does RQL_BOX   is a   manual range box tool   controlled by two draggable vertical lines: LEFT handle (v-line):   selects a candle on a chosen timeframe and sets the box   High/Low to that candle’s wicks . RIGHT handle (v-line):   defines   how far to extend   the box to the right (projection end). It then draws: the main box (range), optional   top/bottom 20% zones , an optional   50% midpoint line , and an on-chart   info panel   wit
FREE
Product Title: BID Wave Volume 1 - Smart Institutional Liquidity Tracker Short Description: Uncover institutional footprints! A powerful dual-timeframe volume indicator that detects real market turns by checking M1 volume order flow at current timeframe reversal zones. Full Description:  BID Wave Volume 2 is a revolutionary, advanced volume indicator designed for pro-scalpers and day traders. It bridges the gap between raw price action and institutional order flow. Unlike traditional indicators,
PivotPro Ultimate – Professional Pivot Levels with Probability Analysis & Telegram Alerts KEY FEATURES Automatic Pivot Levels   – Previous day's High, Low, and Pivot plotted on your chart Real-Time Probability Calculator   – UP/DOWN/FLAT probabilities based on last 20 bars Telegram Integration   – Instant alerts on level touches and probability changes Day Labels   – Clear day-of-week markings (MON, TUE, WED...) Full History   – All levels remain on chart for complete historic
FREE
AURORA AUTO FIBONACCI — GOLD EDITION Автоматические уровни Фибоначчи + опциональные полосы Боллинджера Сам находит последний значимый свинг Аккуратно строит уровни коррекции и обновляет их самостоятельно «Золотой карман» (0.618–0.65) выделен как зона Опциональные полосы Боллинджера в том же индикаторе Без сигналов на покупку и продажу — чисто аналитический инструмент Set-файлы не требуются Aurora Auto Fibonacci избавляет вас от ручного построения. Индикатор самнаходит последние зн
Этот мультисимвольный и мультитаймфреймовый индикатор сканирует следующие модели свечей (объяснение моделей см. На снимке экрана): Три белых солдата (разворот> модель продолжения) Три черные вороны (разворот> модель продолжения) Бычий и медвежий трехлинейный страйк (модель разворота) На старших таймфреймах при включении строгой опции в настройках индикатора паттерны появляются не очень часто. Но когда они это сделают, это будет с очень высокой вероятностью. По словам Томаса Булковски (всемирно и
Control Trading Support And Resistance Es un indicador independiente del TimeFrame que permite proyectar niveles más relevantes del mercado en función del plazo de tiempo de la operativa. Los colores del indicador están escogidos para diferenciar entre los diferentes tipos de niveles y destacar a los más relevantes. Este indicador permite visualizar en un mismo gráfico los posibles objetivos relevantes que los diferentes traders pueden emplear siguiendo diferentes tipos de operativas en funció
Overview Comprehensive technical analysis indicator combining 20+ essential trading tools in a single chart display. Moving Averages EMA (Exponential Moving Average): 9, 21, 50, 200 periods SMA (Simple Moving Average): configurable period Customizable colors and line widths Price position indicators (above/below) Oscillators & Momentum RSI (Relative Strength Index): adjustable overbought/oversold levels MACD (Moving Average Convergence Divergence): customizable fast/slow/signal periods Stochasti
NQX Retracement Entry Burst MT4 — сигнальный индикатор для MetaTrader 4: сигналы входа на откате (сигналы подаются только тогда, когда волатильность расширяется выше своего недавнего среднего). Собственная логика NQX, которая обнаруживает откат в ключевую зону коррекции, которая удерживается. Сигналы подаются только тогда, когда волатильность расширяется выше своего недавнего среднего. Индикатор отображает предлагаемую точку входа, короткий стоп и дальние цели (3:1, 5:1, 10:1, до 20:1 на свинге)
Liquidity Sweep and Market Structure Indicator is a chart-based tool for MetaTrader 4 that highlights potential liquidity grabs around recent swing highs and lows. The indicator can optionally wait for a market structure break, known as a Change of Character, before displaying a directional signal. Its scoring system can include a volume filter and higher timeframe trend bias. Features Identifies potential bullish and bearish liquidity sweeps. Optional market structure confirmation. Configurabl
Описание Triangle Breakout Retest Dashboard Pro Multi Symbol — это многоинструментальный индикатор институционального типа, разработанный для торговли на основе структуры рынка, пробоев и ретеста. Он автоматически сканирует несколько валютных пар, определяет фигуры консолидации в виде треугольника, выявляет направление пробоя и ожидает подтверждённый ретест перед формированием торгового сигнала. Этот инструмент создан для того, чтобы помочь трейдерам избегать ложных пробоев, используя подтверждё
С этим продуктом покупают
Trend SniperX MT4
Sarvarbek Abduvoxobov
5 (5)
Trend Sniper X — это мультитаймфреймовый трендовый индикатор для MetaTrader 5, который помогает трейдерам точно и четко определять направление тренда и потенциальные точки разворота. Для MT5: https://www.mql5.com/en/market/product/181101 Информация о цене: Текущая цена является промо-ценой и может измениться по мере выхода новых обновлений и функций. Канал Code2Profit Освойте рынок с помощью мультитаймфреймового анализа! Как максимизировать процент побед с Trend Sniper X: ключевые правила и сове
Currency Strength Wizard — очень мощный индикатор, предоставляющий вам комплексное решение для успешной торговли. Индикатор рассчитывает силу той или иной форекс-пары, используя данные всех валют на нескольких тайм фреймах. Эти данные представлены в виде простых в использовании индексов валют и линий силы валют, которые вы можете использовать, чтобы увидеть силу той или иной валюты. Все, что вам нужно, это прикрепить индикатор к графику, на котором вы хотите торговать, и индикатор покажет вам ре
SR Liquidity — это торговый индикатор, предназначенный для выявления скрытых зон, где концентрируется рыночная ликвидность и наблюдается наиболее сильная реакция цены. Эти особые зоны ликвидности выступают в качестве мощных уровней поддержки и сопротивления, предоставляя вам четкую картину того, где с наибольшей вероятностью произойдет разворот рынка. Вместо построения стандартных линий поддержки и сопротивления, индикатор SR Liquidity анализирует реальное поведение цены, выявляя зоны концентрац
Scalper Vault — это мощная, полноценная торговая система, созданная для трейдеров, которые стремятся к стабильным результатам в внутридневной торговле. Этот высокоточный индикатор представляет собой комплексное, самостоятельное торговое решение, обеспечивающее аналитику профессионального (институционального) уровня как для торговли на рынке Forex, так и для работы с бинарными опционами. Пожалуйста, свяжитесь со мной после покупки, чтобы получить мои торговые советы, а также отличный бонус! Исклю
PRO Renko System - это высокоточная система торговли на графиках RENKO. Система универсальна. Данная торговая система может применяться к различным торговым инструментам. Система эффективно нейтрализует так называемый рыночный шум, открывая доступ к точным разворотным сигналам. Индикатор прост в использовании и имеет лишь один параметр, отвечающий за генерацию сигналов. Вы легко можете адаптировать алгоритм к интересующему вас торговому инструменту и размеру ренко бара. Всем покупателям с удовол
В настоящее время скидка 30%! Лучшее решение для новичка или трейдера-эксперта! Эта приборная панель работает на 28 валютных парах. Он основан на 2 наших основных индикаторах (Advanced Currency Strength 28 и Advanced Currency Impulse). Он дает отличный обзор всего рынка Forex. Он показывает значения Advanced Currency Strength, скорость движения валюты и сигналы для 28 пар Forex на всех (9) таймфреймах. Представьте, как улучшится ваша торговля, когда вы сможете наблюдать за всем рынком с помощ
Этот индикатор исследует ценовую структуру фракталов разных периодов, чтобы определить возможные точки разворота на рынке, предоставляя время позиционным трейдерам, которые уже имеют фундаментальную или техническую модель оценки. В отличие от своего младшего брата, Reversal Fractals , этот индикатор не пропустит развороты из-за выбранного периода и будет находить разворотные фракталы зигзагообразно, игнорируя те развороты, которые не несут достаточного импульса для начала устойчивого движения ц
Smart Trend Trading System — индикатор для MetaTrader 4, который объединяет информацию о тренде, сигналы входа и выхода и ценовые уровни на одном графике. Система объединяет более 10 торговых инструментов в одном решении, включая определение тренда, зоны разворота, Smart Cloud, логику трейлинг-стопа, поддержку и сопротивление, окраску свечей, уведомления и мульти-таймфрейм анализ. Система создана, чтобы помочь вам торговать в разных рыночных условиях: Трендовые рынки: Определяйте главный тренд,
Quant Direction
Georgios Kalomoiropoulos
Quant Direction — это инструмент трехмерного анализа рынка. Он обеспечивает полностью объективный, основанный на алгоритмах анализ рынка, одновременно вычисляя точные процентные отклонения по нескольким параметрам. Разработанный с использованием передовых инструментов моделирования на основе искусственного интеллекта и тщательно протестированный, алгоритм предназначен для интерпретации рынка с уникальной точностью. Он может анализировать любую валютную пару или финансовый инструмент на вашей пла
TREND LINES PRO помогает понять, где рынок действительно меняет направление. Индикатор показывает реальные развороты тренда и места, где крупные участники входят повторно. Вы видите BOS-линии смены тренда и ключевые уровни старших таймфреймов — без сложных настроек и лишнего шума. Сигналы не перерисовываются и остаются на графике после закрытия бара. VERSION MT 5     -     Раскрывает свой максимальный потенциал в связке с индикатором  RFI LEVELS PRO Что показывает индикатор: Реальные смены   тр
AW Prime Oscillator
AW Trading Software Limited
5 (1)
Комбинация из двух осцилляторов. Первый отображает точки входа, второй - текущий тренд. Индикатор может отображать сигналы осцилляторов стрелками в двух режимах, все сигналы быстрого осциллятора или сигналы только по текущему тренду. Имеет мультитаймфреймовую панель и три типа уведомлений о появлении сигнала.   Преимущества: Подходит для дневной и скальпирующей торговли Трендовая фильтрация Простая и чувствительная настройка Мультитаймфреймовая панель Подходит для интеграции в советник.  Работае
M1 Sniper
Oleg Rodin
4.97 (30)
M1 SNIPER — это простая в использовании торговая система. Это стрелочный индикатор, разработанный для тайм фрейма M1. Индикатор можно использовать как отдельную систему для скальпинга на тайм фрейме M1, а также как часть вашей существующей торговой системы. Хотя эта торговая система была разработана специально для торговли на M1, ее можно использовать и с другими тайм фреймами. Первоначально я разработал этот метод для торговли XAUUSD и BTCUSD. Но я считаю этот метод полезным и для торговли на д
SIO Oscillator: самооптимизирующийся осциллятор дисбаланса семивариаций Купите индикатор и получите советник (EA) на его основе БЕСПЛАТНО. Большинство осцилляторов воспринимают любое движение цены одинаково. SIO разделяет давление покупателей и продавцов и измеряет дисбаланс между ними, показывая, какая сторона действительно контролирует рынок. Когда дисбаланс достигает экстремума, SIO выдаёт чёткий сигнал с уровнями входа, Stop Loss и Take Profit. Главное отличие SIO в том, что он не полагается
Hidden Cycles
Lev Vladimirovic Marushkin
5 (1)
The Only 100% Universal Tool! Stop trading against nature! This is your chance to secure the only indicator rooted in the absolute laws that govern the entire universe. Most tools guess—this one reveals the truth. Buy another toy or buy the truth. Your choice... Based on Universal Laws — NOT Some Guy’s Algorithm: Let the market adjust to the Hidden Cycles Geometry — not the other way around. Most indicators are based on a man-made formula. They often lag, fail over time, or need constant re-o
Atomic Analyst — MetaTrader 4 По вопросам продукта, настройки или технической поддержки напишите мне напрямую здесь, на MQL5. Индикатор превращает сложные рыночные расчеты в простые визуальные сигналы, цветные свечи, показания тренда, уровни стоп-лосса и несколько зон тейк-профита, которые трейдеры могут быстро понять и использовать в реальных рыночных условиях. Основные варианты использования: Скальпинг и внутридневная торговля: Создан для быстрого принятия решений, четких стрелок, алертов, цв
Price & Time Market Structure Indicator A professional market structure tool that analyzes waves through both price and time — not price alone. Main Description NeoWave PRO is a professional market structure indicator for MetaTrader 4 designed for traders who want to move beyond traditional one-dimensional wave tools such as ZigZag, swing indicators, and basic high/low systems. Most wave indicators analyze only one thing: Price. But a real market wave is not only a price movement. A true wave de
Индикатор Gann Time Clusters Индикатор основан на методе Ганна "Квадрат 9" (W. D. Gann's Square of 9) для временной оси. Он использует предыдущие точки разворота рынка, применяет формулу "Квадрата 9" Ганна, а затем делает прогноз (проекции) на будущее. Дата/время, к которому относятся прогнозы, называется 'временным кластером' ('time cluster'). Эти кластеры изображаются в виде вертикальных линий с правой стороны графика, куда рынок еще не продвинулся. Временной кластер обозначает точку разворота
Forex Breath System — это торговая система, основанная на принципе торговли по тренду, которую можно использовать на любом рынке. Вы можете использовать эту систему с валютами, металлами, сырьевыми товарами, индексами, криптовалютой и даже акциями. Индикатор также можно использовать с любым тайм фреймом. Система универсальна. Он показывает тренд и подает сигналы по тренду. Индикатор может давать вам особый тип оповещений, когда сигналы появляются в направлении тренда, что упрощает торговлю. Инди
СЕЙЧАС СКИДКА 40% !!! Лучшее решение для новичка или трейдера-эксперта! Этот индикатор является уникальным, высококачественным и доступным торговым инструментом, поскольку мы включили в него ряд собственных функций и секретную формулу. Всего на ОДНОМ графике он выдает алерты по всем 28 валютным парам. Представьте, как улучшится ваша торговля, ведь вы сможете точно определить точку запуска нового тренда или возможность скальпирования! Построенный на новых базовых алгоритмах, он позволяет еще
Станьте Breaker Trader и получайте прибыль от изменений структуры рынка по мере изменения цены. Индикатор выключателя блока ордеров определяет, когда тренд или движение цены приближаются к истощению и готовы развернуться. Он предупреждает вас об изменениях в структуре рынка, которые обычно происходят, когда произойдет разворот или серьезный откат. Индикатор использует собственный расчет, который определяет прорывы и ценовой импульс. Каждый раз, когда новый максимум формируется около возможной
Super Signal – Skyblade Edition Профессиональная система трендовых сигналов без перерисовки и без задержек с исключительным процентом выигрышей | Для MT4 / MT5 Лучше всего работает на младших таймфреймах, таких как 1 минута, 5 минут и 15 минут. Основные характеристики: Super Signal – Skyblade Edition — это интеллектуальная система сигналов, специально разработанная для трендовой торговли. Она использует многоуровневую фильтрацию, чтобы выявлять только сильные направленные движения, подкреплённ
Индикатор Tokyo Indicator обеспечивает наглядное представление о направлении тренда, потенциальных торговых сигналах и текущей рыночной ситуации. Его ступенчатая линия тренда с цветовой индикацией позволяет различать «бычьи» фазы (выделены синим цветом) и «медвежьи» фазы (выделены пурпурным цветом). Соответствующие стрелки указывают на возможные точки входа в рынок (покупку или продажу) при смене тренда. Встроенная информационная панель объединяет данные о текущем сигнале, рыночном настроении,
Neuro Poseidon - новый индикатор от Дарьи Резуевой. Он сочетает точные торговые сигналы с адаптивными уровнями TP/SL , в результате создавая максимально выгодные сделки! TO SWITCH TO   ENG   PLEASE CHOOSE IT IN THE UPPER-RIGHT CORNER OF THE WEBSITE Напишите мне после покупки и получите Neuro Poseidon Assistant в подарок для автоматизации вашей торговли! Что отличает его от других индикаторов? 1. Доказанная прибыльность на всех активах и таймфреймах 2. На графике присутствуют только подтвержденн
Gann Made Easy - это профессиональная, но при этом очень простая в применении Форекс система, основанная на лучших принципах торговли по методам господина У.Д. Ганна. Индикатор дает точные BUY/SELL сигналы, включающие в себя уровни Stop Loss и Take Profit. ПОЖАЛУЙСТА, СВЯЖИТЕСЬ СО МНОЙ ПОСЛЕ ПОКУПКИ, ЧТОБЫ ПОЛУЧИТЬ ТОРГОВЫЕ ИНСТРУКЦИИ И ОТЛИЧНЫЕ ДОПОЛНИТЕЛЬНЫЕ ИНДИКАТОРЫ БЕСПЛАТНО! Вероятно вы уже не раз слышали о торговли по методам Ганна. Как правило теория Ганна отпугивает от себя не только н
Liquidity Scalper System — торговая система на основе ликвидности в формате индикатора. Большинство индикаторов показывают только стрелку, а дальше трейдер сам решает, где поставить стоп, где цель и можно ли вообще доверять сигналу. Liquidity Scalper System закрывает весь цикл сделки: находит пулы ликвидности, даёт сигнал при их пробое, сразу рассчитывает Entry, Stop Loss и три цели, а на панели показывает статистику и результаты проверки на новых данных. Система сама подбирает настройки и обнов
Gold Channel is a volatility-based indicator, developed with a specific timing algorithm for the XAUUSD pair, which consists of finding possible corrections in the market. This indicator shows two outer lines, an inner line (retracement line) and an arrow sign, where the theory of the channel is to help identify overbought and oversold conditions in the market. The market price will generally fall between the boundaries of the channel. If prices touch or move outside the channel it is a tradi
Этот индикатор показывает относительную силу 8 основных валют: USD, EUR, GBP, AUD, NZD, CAD, CHF и JPY. Значение прочности нормировано на диапазон 0-100: Значение выше 60 означает сильный. Значение ниже 40 означает слабость. Основной принцип Учитывая восемь валют: USD, EUR, GBP, AUD, NZD, CAD, CHF, JPY, где каждую пару из двух можно объединить, в результате чего в общей сложности получается 28 пар, используется обратный алгоритм для определения силы восьми валют. из этих 28 пар EURUSD,GBPUSD,AU
Italo Volume Indicator
Italo Santana Gomes
4.92 (79)
BUY INDICATOR AND GET EA FOR FREE AS A BONUS + SOME OTHER GIFTS! ITALO VOLUME INDICATOR  is the best volume indicator ever created, and why is that? The Indicator works on all time-frames and assets, indicator built after 7 years of experience on forex and many other markets. You know many volume indicators around the internet are not complete, does not help, and it's difficult to trade, but the Italo Volume Indicator is different , the Italo Volume Indicator shows the wave volume, when market
This is a professional chart indicator designed for traders focused on stability and clear price action. It helps filter market noise and provides clear visual entry and exit zones for your trading decisions. Core Features: Strictly Non-Repainting: The system is built with strict non-repaint logic. What you see on the chart is the true historical performance. Confirmed Signals: Signals are triggered and confirmed only after the candle closes . Once a trading arrow appears on a closed candle, it
TDI Multi Timeframe Scanner: This Dashboard indicator uses the TDI (Trader's Dynamic Index) Indicator to find best trades. Read detailed How to Use Guide: https://www.mql5.com/en/blogs/post/758252 Extra indicators also available in above post. Checks for: - SharkFin Pattern Free indicator for SharkFin: https://www.mql5.com/en/market/product/42405/ - TDI Trend: Strong/Weak Trend Up/Down - TDI Signal: Strong/Medium/Weak Signal for Buy/Sell - Consolidation - Overbought/Oversold - Volatility Ban
Другие продукты этого автора
See the Dow Theory direction of six timeframes in one panel. DowgatorPro2 judges the current trend direction (up or down) automatically by Dow Theory, using closed bars only. It carries over the features of the earlier e-DowgatorPro and puts first that even a beginner can read the direction without confusion. The direction of six timeframes (M1 to D1) is shown on the panel in color. Features Check direction mismatch: see on the panel whether your chart's timeframe agrees with the higher timefram
See the market's fear level on the chart you trade. VixChecker shows the VIX (the volatility index often called the fear index) in a sub-window as one bar per day, colored by level: normal (blue), caution (yellow, 20 or above by default) and fear (red, 30 or above). The current value, the change from the previous close and the time of the value are shown in a small panel, and the value can also be shown on the main chart. Where the VIX values come from (please read before buying) The indicator d
Round numbers on your chart, and a notice when the price gets close. RoundNumberAlert draws horizontal lines at round numbers (150.000, 150.500 ...) and watches them for you. When the price enters the touch range, only that line blinks and you get one notification. Major round numbers stand out in gold, and a small panel shows how many pips are left to the next round number above and below. Features Round-number lines: the step starts at 10 pips (for example 50 pips: 150.000, 150.500 ...). Major
Entry signals as finger marks: yellow for trend-following, pink for counter-trend. SignRAMB combines RSI, ATR, MACD, a moving average, Dow theory and the candles, and marks the places where the price may turn up or down, based on past chart patterns. A finger pointing up is a buy, pointing down is a sell. Signals are decided on closed bars and never repaint. Signals are not always right. Use them as one indicator, together with your own reading of the chart. They are meant for the move right aft
Which currency is strong right now — in one panel. CurrencyStrength takes the RSI of the 28 pairs of USD, EUR, JPY, GBP, AUD, CHF, CAD and NZD, turns it into a score from −100 to +100 for each currency, and shows them as bars, strongest first. Features Strength ranking: strong currencies in green, weak ones in red, scored from −100 to +100. Automatic symbol detection: the pairs are found from each symbol's base and profit currency, so suffixes and prefixes (EURUSD#, EURUSD.pro, m.EURUSD, EURUSDm
Trendlines drawn for you — and a good shape kept as your basis. TrendLineSnap finds the swing highs and swing lows on your chart, joins them and draws one high trendline and one low trendline. Triangles, channels, wedges and horizontal levels used in line trading show up as lines. Automatic trendlines are redrawn whenever a new swing forms. When you see a shape you want to trade, save it. The saved line does not move. When the price comes near it again, show the saved line next to the current li
Where is the price inside the range — in one panel. BoxRangeSnap looks for price zones where the highs and lows touched the same top and bottom again and again, and draws them as a big box and a small box. The panel keeps showing the distance from the price to the top and bottom of the current box. Features Automatic range boxes: a big box and a small box, newest first. The current box is highlighted and extends to the last closed bar. Adjustable detection: minimum touches on the top and bottom,
The Dow Theory structure of the chart — in one look. DowTheoryVisual labels every swing high and low as HH, HL, LH or LL and draws a zigzag colored by the trend: blue for an uptrend, red for a downtrend, gray for a range. The panel keeps showing the trend of the current chart and of two higher timeframes side by side. Features HH / HL / LH / LL labels: each swing high and low is compared with the previous one. Trend-colored zigzag: up blue, down red, range gray. The color changes on the bar wher
Key levels on nine timeframes, and an alert the moment the price breaks out. Prices that were stopped again and again are levels many traders watch. BreakerDetectPro finds the zones where swing highs and swing lows gather and draws one level above and one below the price for each timeframe you select, from M1 to MN1. Higher-timeframe levels are drawn on the chart you are looking at. Features Automatic key levels: one level above and one below the price, from swing highs and lows that gather in t
A small, rule-based edge from the Japanese calendar. For traders who want an EA that never averages down, and for GoldHam users looking for a second EA. It trades only on Gotobi mornings with a stop placed with every order, so its trading days and hours rarely overlap with GoldHam, which trades gold every day (use separate accounts). In Japan, the 5th, 10th, 15th, 20th, 25th and the last day of the month are called "Gotobi". Many Japanese importers settle their dollar payments on these days, so
A gold 1-minute basket EA, profit-seeking type. For traders who want to grow a small account. You pick only the multiplier and the lot grows with your balance. It trades heavier than its sister GoldHam Shield and grows faster; if you would rather keep drawdowns shallow, choose Shield instead. GoldHam Blade trades gold on the 1-minute chart. When price moves against the first entry it adds positions in the same direction, and closes all of them together once the basket is back in profit. Blade gr
A gold 1-minute basket EA, steady type. For traders who want shallow drawdowns and a long run. You choose fixed or compounding lots; at multiplier 1.0 fixed, the deepest drawdown over two years was 6%. It enters on the same signals as GoldHam Blade, only lighter, so pick one of the two rather than both. GoldHam Shield uses the same gold 1-minute basket logic as GoldHam Blade, with lighter positions and a cap on the deepest levels. You choose fixed lots or compounding, and a multiplier of 1.0 (re
A gold 1-minute EA, aggressive type, tuned to today's gold market. You choose two things: the multiplier (3.5 to 5.0) and the stop line (60 to 90 percent of the balance, default 80). What changed in version 2.08 Lots grow more gently than before, so the load stays lighter in a strong one-way move The default stop line is 80% of the balance. If you choose a line below the minimum for your multiplier, the EA raises it to that minimum In a replay of the gold spike on 3 November 2026 (real ticks), t
Copy trades between MT4 and MT5 terminals on one computer. CopyHam Inside Sender is the master side of a trade copier. Attach it to the account you want to copy from. It shows a Receiver code (CT-XXXX-XXXX) on its panel. Paste that code into CopyHam Inside Receiver on the other terminals, and they follow every trade of this account. The Sender and the Receivers exchange data through the common data folder of MetaTrader on the same computer. Nothing is sent over the internet, so there is no URL t
Follow a master account from another terminal on the same computer. CopyHam Inside Receiver is the follower side of a trade copier. Paste the Receiver code shown on CopyHam Inside Sender (CT-XXXX-XXXX) into its inputs, and this account opens, modifies and closes the same trades as the master. The data is exchanged through the common data folder of MetaTrader on the same computer. Nothing is sent over the internet. The master may be MT4 or MT5 and may be with a different broker. What is copied Ma
TradeHam Manager is a trade panel for manual traders. You decide when and where to trade. The panel takes care of the lot size, the order and the clean-up. It does not open trades on its own. It has no entry logic and does not promise any profit. Main features Risk-based lot size. Set the risk as a percent of balance, a fixed amount of money or a fixed lot. Drag the stop-loss line on the chart and the lot is recalculated. One-click orders. BUY / SELL buttons place the order with stop loss and ta
SignalHamToEA reads a signal indicator that draws arrows on the chart and places orders exactly as the arrows say. No programming is needed. Enter the indicator name and the buffer numbers that hold the buy and sell arrows, and it runs. The EA has no trading method of its own. Whether it enters is decided by the arrows of the indicator you connect, so you can try as many signal tools as you like. Four ways to read signals Buy/sell buffers (arrows), the basic mode One buffer that turns + / - (tre
See the Dow Theory direction of six timeframes in one panel. DowgatorPro2 judges the current trend direction (up or down) automatically by Dow Theory, using closed bars only. It carries over the features of the earlier e-DowgatorPro and puts first that even a beginner can read the direction without confusion. The direction of six timeframes (M1 to D1) is shown on the panel in color. Features Check direction mismatch: see on the panel whether your chart's timeframe agrees with the higher timefram
The levels of higher timeframes, on the chart you are watching. LineTraderPro2 finds swing highs and lows with Dow Theory rules and draws horizontal lines at the levels the market watches, for any of 20 timeframes from M1 to W1. Each line is labeled with its timeframe (H1, D1 and so on) and the date of the swing, so you can see at a glance which timeframe a level belongs to without switching charts. What you see on the chart Horizontal lines: the swing highs above the price and the swing lows be
Know exactly how long until the next release, and what came out. EconomicStopper shows the time to each economic release as a countdown, lists the upcoming events with their importance, and shows the actual value and the surprise against the forecast after the release. Everything is in one panel on the chart. It reads the economic calendar built into MetaTrader 5, so it needs no DLL and no web requests. How it behaves over time More than 5 minutes before: the timer counts down every second and t
See the market's fear level on the chart you trade. VixChecker shows the VIX (the volatility index often called the fear index) in a sub-window as one bar per day, colored by level: normal (blue), caution (yellow, 20 or above by default) and fear (red, 30 or above). The current value, the change from the previous close and the time of the value are shown in a small panel, and the value can also be shown on the main chart. Where the VIX values come from (please read before buying) The indicator d
Round numbers on your chart, and a notice when the price gets close. RoundNumberAlert draws horizontal lines at round numbers (150.000, 150.500 ...) and watches them for you. When the price enters the touch range, only that line blinks and you get one notification. Major round numbers stand out in gold, and a small panel shows how many pips are left to the next round number above and below. Features Round-number lines: the step starts at 10 pips (for example 50 pips: 150.000, 150.500 ...). Major
Entry signals as finger marks: yellow for trend-following, pink for counter-trend. SignRAMB combines RSI, ATR, MACD, a moving average, Dow theory and the candles, and marks the places where the price may turn up or down, based on past chart patterns. A finger pointing up is a buy, pointing down is a sell. Signals are decided on closed bars and never repaint. Signals are not always right. Use them as one indicator, together with your own reading of the chart. They are meant for the move right aft
Which currency is strong right now — in one panel. CurrencyStrength takes the RSI of the 28 pairs of USD, EUR, JPY, GBP, AUD, CHF, CAD and NZD, turns it into a score from −100 to +100 for each currency, and shows them as bars, strongest first. Features Strength ranking: strong currencies in green, weak ones in red, scored from −100 to +100. Automatic symbol detection: the pairs are found from each symbol's base and profit currency, so suffixes and prefixes (EURUSD#, EURUSD.pro, m.EURUSD, EURUSDm
Trendlines drawn for you — and a good shape kept as your basis. TrendLineSnap finds the swing highs and swing lows on your chart, joins them and draws one high trendline and one low trendline. Triangles, channels, wedges and horizontal levels used in line trading show up as lines. Automatic trendlines are redrawn whenever a new swing forms. When you see a shape you want to trade, save it. The saved line does not move. When the price comes near it again, show the saved line next to the current li
Where is the price inside the range — in one panel. BoxRangeSnap looks for price zones where the highs and lows touched the same top and bottom again and again, and draws them as a big box and a small box. The panel keeps showing the distance from the price to the top and bottom of the current box. Features Automatic range boxes: a big box and a small box, newest first. The current box is highlighted and extends to the last closed bar. Adjustable detection: minimum touches on the top and bottom,
The Dow Theory structure of the chart — in one look. DowTheoryVisual labels every swing high and low as HH, HL, LH or LL and draws a zigzag colored by the trend: blue for an uptrend, red for a downtrend, gray for a range. The panel keeps showing the trend of the current chart and of two higher timeframes side by side. Features HH / HL / LH / LL labels: each swing high and low is compared with the previous one. Trend-colored zigzag: up blue, down red, range gray. The color changes on the bar wher
Key levels on nine timeframes, and an alert the moment the price breaks out. Prices that were stopped again and again are levels many traders watch. BreakerDetectPro finds the zones where swing highs and swing lows gather and draws one level above and one below the price for each timeframe you select, from M1 to MN1. Higher-timeframe levels are drawn on the chart you are looking at. Features Automatic key levels: one level above and one below the price, from swing highs and lows that gather in t
A small, rule-based edge from the Japanese calendar. For traders who want an EA that never averages down, and for GoldHam users looking for a second EA. It trades only on Gotobi mornings with a stop placed with every order, so its trading days and hours rarely overlap with GoldHam, which trades gold every day (use separate accounts). In Japan, the 5th, 10th, 15th, 20th, 25th and the last day of the month are called "Gotobi". Many Japanese importers settle their dollar payments on these days, so
A gold 1-minute basket EA, profit-seeking type. For traders who want to grow a small account. You pick only the multiplier and the lot grows with your balance. It trades heavier than its sister GoldHam Shield and grows faster; if you would rather keep drawdowns shallow, choose Shield instead. GoldHam Blade trades gold on the 1-minute chart. When price moves against the first entry it adds positions in the same direction, and closes all of them together once the basket is back in profit. Blade gr
Фильтр:
Нет отзывов
Ответ на отзыв