VixChecker VIX Fear Index Three Colors MT4

  • Индикаторы
  • Naoto Shimoda
    Naoto Shimoda
    FX.Hamrat - MetaTrader 4/5 indicator and Expert Advisor developer based in Japan.
    Over 10 years of trading experience (discretionary and systematic), and 90+ MT4/MT5 programs built so far - including 30+ custom-made projects for individual traders.
  • Версия: 2.2
  • Активации: 10

See the market's fear level on the chart you trade.

VixChecker shows the VIX (the volatility index often called the fear index) in a sub-window as one bar per day, colored by level: normal (blue), caution (yellow, 20 or above by default) and fear (red, 30 or above). The current value, the change from the previous close and the time of the value are shown in a small panel, and the value can also be shown on the main chart.

Where the VIX values come from (please read before buying)

  • The indicator does not access the internet. It reads your broker's VIX symbol from Market Watch. It searches automatically for a symbol whose name contains "VIX" (for example VIX, VIX.f, #VIX, VIX-OCT26). You can also enter the symbol name yourself.
  • Many brokers offer VIX as a CFD based on VIX futures. Its value can differ from the Cboe VIX index (spot) by a few points. If your broker has a futures-based symbol with an expiry, the indicator moves to the next contract after the expiry.
  • No VIX symbol at your broker? Download Cboe's daily VIX history (VIX_History.csv, on Cboe's VIX historical data page) and place it in File > Open Data Folder > MQL5\Files (MQL4\Files on MT4). The indicator then shows the history up to the last day in the file (not live, no alerts).
  • A futures contract has only a few months of history. If you also place VIX_History.csv, the earlier days are filled in from the file, so you can see the history since 1990.
  • To check before buying: open Market Watch, press Ctrl+U (Symbols) and search for "VIX".

Features

  1. Three colors by level: normal, caution, fear. Both levels can be changed.
  2. Daily bars in a sub-window on any timeframe. On timeframes below D1 one bar is left empty between days (0 to 3 bars).
  3. The scale keeps the fear level visible even when VIX has been low for a long time.
  4. Panel: current value in the level color, level name, change from the previous close, previous close, symbol and server time.
  5. Text on the main chart: "VIX-Fear index[ value ]". It blinks above the caution level (can be turned off).
  6. Alerts, e-mail and push notifications when VIX crosses the caution or fear level upward. Nothing is sent right after you add the indicator, and the same notice is not repeated for 30 minutes.
  7. For EAs: the VIX value of each bar is in buffer 3 (the fourth buffer), readable with iCustom.
  8. Display scaling: the panel fits at 125% and 150% Windows scaling.

Inputs (main)

  • VIX symbol name (empty = find automatically)
  • Caution level (default 20) and fear level (default 30)
  • How to notify for each level: none, alert, e-mail, push and combinations
  • Text on the main chart: on/off, blink, position, font size and colors
  • Panel font size, gap between days, bar colors

In the Strategy Tester (the free demo)

The indicator reads the VIX symbol of the broker the tester uses. If that broker has no VIX symbol, the panel shows "No VIX symbol" and no bars are drawn. This is expected; on your own terminal it uses your broker's symbol or your CSV file.

This indicator displays the VIX. It does not trade, does not give investment advice and does not promise any results. The values depend on your broker's VIX symbol or on the file you place.

Рекомендуем также
Индикатор для бинарных опцыонов стрелочный прост в использовании и не требует настройки работает на всех валютных парах акцыях крипто валюте сигнал на покупку синяя стрелка вверх  сигнал на продажу красная стрелка в низ  советы не стоит торговать во время новостей и за 15-30 минут перед их выходом так как рынок слишком волотилен и очень много шума  входить в сделки стоит на одну или две свечи от текущего периода ( рекомендуется на 1 свечу ) таймфрейм до м 15 рекомендуемый мани менеджмент фиксир
Это трендовый индикатор без перерисовки Разработан вместо стратегии бля бинарках опционов (по цвету свечи мартингейл) Так же хорошо работает в торговле на рынке форекс Когда открывать сделки ( бинарные опционы ) Сигнал появится в месте с свечой сигналит на текущую свечу  Открывать сделку стоит на одну свечу текущего таймфрейма рекомендуется м1 и М5 При появлении синей точки открываем сделку вверх При появлении красной точки открываем сделку в низ. Как открывать сделки на Форекс. При получени
EZZ Elite Zig Zag is an indicator for the MetaTrader 4 terminal. This indicator traces the peak of the trend based on the market reversal, thus showing various opportunities in the financial market. EZZ Elite Zig Zag is a visual tool, intuitive, and easy to understand and use.  Test it Yourself by Downloading it for Free. Author Paulo Rocha all rights reserved
VR Cub
Vladimir Pastushak
VR Cub это индикатор что бы получать качественные точки входа. Индикатор разрабатывался с целью облегчить математические расчеты и упростить поиск точек входа в позицию. Торговая стратегия, для которой писался индикатор, уже много лет доказывает свою эффективность. Простота торговой стратегии является ее большим преимуществом, что позволяет успешно торговать по ней даже начинающим трейдерам. VR Cub рассчитывает точки открытия позиций и целевые уровни Take Profit и Stop Loss, что значительно повы
Forex Gump
Andrey Kozak
2.4 (5)
Forex Gump - это полностью готовая полуавтоматическая торговая система. В виде стрелок на экран выводятся сигналы для открытия и закрытия сделок. Все, что вам нужно, это следовать указаниям индикатора. Когда индикатор показывает синюю стрелку, Вам нужно открывать ордер на покупку. Когда индикатор показывает красную стрелку, нужно открывать ордер на продажу. Закрываем ордера когда индикатор рисует желтый крестик. Для того, чтобы получить максимально эффективный результат, рекомендуем использовать
Индикатор тренда Riko Trend - революционное решение для торговли по трендам и фильтрации со всеми важными функциями инструмента тренда, встроенными в один инструмент! Индикатор Riko Trend хорош для любого трейдера, подойдет любому трейдеру как для форекс так и для бинарных опционов. Ничего настраивать не нужно все отточено времинем и опытом, отлично работает на во время флета та и в тренде. Индикатор тренда Riko Trend это инструмент технического анализа финансовых рынков, отражающий текущие от
Introducing the POWER TRADE Indicator Created by a small group of experienced traders with years of profitable experience in the financial markets, the Power Trade Indicator is a plug-and-play trading tool designed to help traders spot high-quality setups with ease and confidence. What It Does: It provides powerful entry signals, profit-taking zones, and rebound areas — giving you a complete view of where price action is most likely to move next. The indicator reacts in real time, al
Matrix - стрелочный индикатор Форекс. Отображает сигналы просто и наглядно! Стрелки показывают направление заключения сделки, и окрашиваются соответственно что видно на скриншотах. Как видите торговать с таким индикатором легко. Дождался появления стрелки в нужном направлении – открыл сделку. Сформировалась стрелка в обратную сторону – закрыл сделку. Также индикатор отображает линии с помощью которых формируются сигналы стрелок, с учетом внутренних вильтров.
Color Stochastic Enhanced Stochastic Oscillator with Cross Detection and Visual Signal Support Overview Color Stochastic is a customized version of the classic Stochastic Oscillator designed for momentum analysis and crossover visualization. The indicator provides color-based signal marking and configurable crossover detection at user-defined overbought and oversold levels. It can be used as part of: Momentum analysis Mean reversion workflows DCA-based strategies Multi-indicator confirmation sys
PipFinite Trend PRO
Karlo Wilson Vendiola
4.88 (2252)
Стратегия пробоя для торговли по тренду, фильтрация и все необходимые функции, встроенные в один инструмент! Интеллектуальный алгоритм индикатора Trend Pro с точностью определяет тренд, отфильтровывает рыночный шум и генерирует входные сигналы и уровни выхода. Новые функции с расширенными правилами статистического расчета улучшают общую производительность этого индикатора. Важная информация Для максимального использования потенциала Trend Pro прочитайте полное описание www.mql5.com/en/blogs/p
Noize Absorption Index - is the manual trading system that measures the difference of pressure between bears forces and bulls forces. Green line - is a noize free index that showing curent situation. Zero value of index shows totally choppy/flat market.Values above zero level shows how powerfull bullish wave is and values below zero measures bearish forces.Up arrow appears on bearish market when it's ready to reverse, dn arrow appears on weak bullish market, as a result of reverse expectation. S
Индикатор Perspective Trend отслеживает рыночный тренд с очень высокой надежностью. Все точки пересечения будут идеальными точками, в которых изменяется направление тренда. Игнорируются резкие колебания цены, а также шумы вокруг усредненных цен.  Сигнальные точки, места где изменяется цвет, можно использовать как точки потенциального разворота рынка. Алгоритм индиувтора реализует разновидность технического анализа, основанную на идее о том, что рынок имеет циклическую природу. Данную разработку
Trend Oscillator — это продвинутый пользовательский индикатор Crypto_Forex, эффективный торговый инструмент! - Используется новый продвинутый метод расчета — 20 вариантов параметра «Цена для расчета». - Самый плавный осциллятор из когда-либо созданных. - Зеленый цвет для восходящих трендов, красный цвет для нисходящих трендов. - Значения перепроданности: ниже 5, значения перекупленности: выше 95. - С этим индикатором есть множество возможностей для модернизации даже стандартных стратегий. - С о
«Dynamic Trading Oscillator» — это продвинутый пользовательский индикатор Crypto_Forex, эффективный инструмент для торговли на MT4! — Новое поколение осцилляторов — смотрите изображения, чтобы узнать, как им пользоваться. — Dynamic Trading Oscillator имеет адаптивные зоны перепроданности/перекупленности. — Осциллятор — вспомогательный инструмент для поиска точных точек входа в динамических зонах перепроданности/перекупленности. — Значения перепроданности: ниже синей линии, значения перекупленно
«Dynamic Scalping Oscillator» — это продвинутый пользовательский индикатор Crypto_Forex, эффективный инструмент для торговли на MT4! — Новое поколение осцилляторов — смотрите изображения, чтобы узнать, как им пользоваться. — Dynamic Scalping Oscillator имеет адаптивные зоны перепроданности/перекупленности. — Осциллятор — вспомогательный инструмент для поиска точных точек входа в динамических зонах перепроданности/перекупленности. — Значения перепроданности: ниже зелёной линии, значения перекупл
Индикатор "Two Moving Average Crossover" для MetaTrader 4 (MT4 - это инструмент технического анализа, который отображает две скользящие средние и уведомляет, когда скользящие средние пересекают друг друга. Индикатор рассчитывает и строит график двух скользящих средних, одна из которых быстрее, а другая медленнее. Когда более быстрая скользящая средняя пересекается выше более медленной скользящей средней, это считается бычьим сигналом, указывающим на потенциальный разворот тренда или начало новог
Chart Patterns Detect 15 patterns (Ascending Triangle, Descending Triangle, Rising Wedge, Falling Wedge, Bullish Flag, Bearish Flag, Bullish Rectangle, Bearish Rectangle Symmetrical triangle, Head and Shoulders, Inverted Head and Shoulders, Triple top, Triple Bottom, Double Top, Double Bottom) Use historical data to calculate the probability of each pattern to succeed (possibility to filter notification according to the chance of success) gives graphic indication about the invalidation level and
Сигнальный трендовый индикатор. Определяет направление тренда и  окрашивается в соответствующий цвет. Имеет встроенные звуковые и визуальные оповещение о смене тренда. Может отправлять уведомления на ваш телефон или на емеил. Позволяет вести трендовую и контр трендовую торговлю. Работает на всех таймфреймах, на всех валютных парах, металлах, индексах и криптовалюте. Можно использовать при работе с бинарными опционами. Отличительные особенности Не перерисовывается; Простые и понятные настройки;
Индикаторы [ZhiBiCCI] подходят для всех циклов использования, а также подходят для всех разновидностей рынка. [ZhiBiCCI] Зеленая сплошная линия - разворот бычьей дивергенции. Зеленая пунктирная линия - классическая бычья дивергенция. [ZhiBiCCI] Сплошная линия к красному - обратная медвежья дивергенция. Красная пунктирная линия - классическая медвежья дивергенция. [ZhiBiCCI] можно установить в параметрах (Предупреждение, Отправить почту, Отправить уведомление), установить на (true) для отправк
The Stepping Trend Indicator     The Steppi ng Trend indicator uses the  average true range  (ATR indicator) in its calculation. This gives you control to set your own average true range period, I set the Default as 10.   Indicator Details. Green Arrow Up: This means you are at the starting point of a new bullish trend, it’s time to buy.   Red  Arrow  Down : This means you are at the starting point of a new  bearish  trend, it’ s time to sell .   What if you miss the Arrow Signal?   No prob
Portfolio X-Ray Pro: Stop Trading Blind. See Your True Risk. Do you know exactly how much exposure you have on USD right now? Or Gold? If you have 10 different trades open, calculating your total risk per symbol is a nightmare. A mental mistake here can blow an account. Portfolio X-Ray Pro solves this instantly. It aggregates every single open order, sorts them by volume, and presents your true net exposure in a stunning, professional dashboard that now collapses into a sleek, minimalist arro
Stratos Pali
Michela Russo
4.43 (7)
Stratos Pali Indicator   is a revolutionary tool designed to enhance your trading strategy by accurately identifying market trends. This sophisticated indicator uses a unique algorithm to generate a complete histogram, which records when the trend is Long or Short. When a trend reversal occurs, an arrow appears, indicating the new direction of the trend. Important Information Revealed Leave a review and contact me via mql5 message to receive My Top 5 set files for Stratos Pali at no cost! Dow
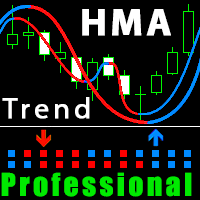
Усовершенствованная версия бесплатного индикатора HMA Trend (для MetaTrader 4) , с возможностью статистического анализа. HMA Trend - трендовый индикатор, базирующийся на скользящей средней Хала (Hull Moving Average - HMA) с двумя периодами. HMA с медленным периодом определяет тренд, HMA с быстрым периодом - краткосрочные движения и сигналы в сторону тренда. Главные отличия от бесплатного варианта: Возможность предсказать вероятность разворота тренда с помощью анализа исторических данных; Постро
Money Flow Profile MT5 HERE   Here   our more valuable tools SMC Trend Trading   ,  Easy SMC Trading  ,  Institutional SMC Architect Volume Analysis Tools  ,  Volume flow Profile  ,  Market volume profile  , FVG with Volume  , Liquidity Heatmap Profile  ,  Volume Spread Analysis This Master Edition is engineered for clarity and speed, featuring a unique Auto-Theme Sync system that instantly beautifies your chart layout upon loading. Key Features: True Money Flow Calculation: Goes beyond stand
Одна из числовых последовательностей носит название - "Последовательность лесного пожара". Она была признана одной из самых красивых новых последовательностей. Её главная особенность заключается в том, что эта последовательность избегает линейных трендов, даже самых кратковременных. Именно это свойство легло в основу этого индикатора. При анализе финансового временного ряда этот индикатор старается отбросить все возможные варианты тренда. И только если это ему не удается, то он признает наличие
The Th3Eng PipFinite indicator is based on a very excellent analysis of the right trend direction with perfect custom algorithms. It show the true direction and the best point to start trading. With StopLoss point and Three Take Profit points. Also it show the right pivot of the price and small points to order to replace the dynamic support and resistance channel, Which surrounds the price. And Finally it draws a very helpful Box on the left side on the chart includes (take profits and Stop loss
Advanced CRT Indicator MT4 — Candle Range Theory Tool Advanced CRT Indicator MT4 is a professional analysis tool that automates Candle Range Theory. It identifies consolidation ranges, breakout levels, Fair Value Gaps (FVG), and profit targets, with a real-time dashboard and alerts. Overview - Multi-timeframe candle range detection   - Automatic breakout levels with buffer settings   - Fair Value Gap identification and tracking   - Up to three customizable target levels (Risk:Reward ratios)  
Устали подбирать настройки индикатора, теряя драгоценное время? Надоела неуверенность в их оптимальности? Пугает неизвестность в их прибыльности? Тогда индикатор Trend IM предназначен именно, для вас. Индикатор сэкономит вам уйму времени, которое можно будет потратить на более полезные занятия, например, на отдых, но при этом эффективность возрастет многократно. Использует всего один параметр для настройки, который задает количество баров для расчета. Trend IM - индикатор разворота, является ч
Phase Analytics Pro: Продвинутый анализатор рыночных циклов Phase Analytics Pro — это высокоточный инструмент, разработанный для трейдеров, которые ценят математический подход и отсутствие запаздывания. В основе индикатора лежат принципы цифровой обработки сигналов, что позволяет раскладывать ценовое движение на фазовые компоненты для определения доминирующего цикла. Принцип работы: Алгоритм вычисляет мгновенную фазу рынка, что позволяет с высокой точностью разделять фазы тренда и консолидации.
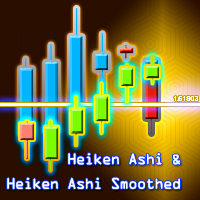
Простая, но эффектиная система для определения форекс-тренда. Представляет собой  два индикатора в одном:  Heiken Ashi и Heiken Ashi Smoothed Moving Average (сглаженная скользящая средняя). Heiken Ashi (HA) и Heiken Ashi Smoothed (HAS) рассчитываются в рамках одного события с необходимыми буферами и циклом, повышая скорость их работы, улучшая оптимизацию и эффективность . По вашему выбору на графике могут отображаться одновременно оба индикатра или только один. Входные параметры Display Heiken A
С этим продуктом покупают
Trend SniperX MT4
Sarvarbek Abduvoxobov
5 (6)
Trend Sniper X — это мультитаймфреймовый трендовый индикатор для MetaTrader 5, который помогает трейдерам точно и четко определять направление тренда и потенциальные точки разворота. Для MT5: https://www.mql5.com/en/market/product/181101 Информация о цене: Текущая цена является промо-ценой и может измениться по мере выхода новых обновлений и функций. Канал Code2Profit Освойте рынок с помощью мультитаймфреймового анализа! Как максимизировать процент побед с Trend Sniper X: ключевые правила и сове
Currency Strength Wizard — очень мощный индикатор, предоставляющий вам комплексное решение для успешной торговли. Индикатор рассчитывает силу той или иной форекс-пары, используя данные всех валют на нескольких тайм фреймах. Эти данные представлены в виде простых в использовании индексов валют и линий силы валют, которые вы можете использовать, чтобы увидеть силу той или иной валюты. Все, что вам нужно, это прикрепить индикатор к графику, на котором вы хотите торговать, и индикатор покажет вам ре
В настоящее время скидка 30%! Лучшее решение для новичка или трейдера-эксперта! Эта приборная панель работает на 28 валютных парах. Он основан на 2 наших основных индикаторах (Advanced Currency Strength 28 и Advanced Currency Impulse). Он дает отличный обзор всего рынка Forex. Он показывает значения Advanced Currency Strength, скорость движения валюты и сигналы для 28 пар Forex на всех (9) таймфреймах. Представьте, как улучшится ваша торговля, когда вы сможете наблюдать за всем рынком с помощ
Smart Trend Trading System — индикатор для MetaTrader 4, который объединяет информацию о тренде, сигналы входа и выхода и ценовые уровни на одном графике. Система объединяет более 10 торговых инструментов в одном решении, включая определение тренда, зоны разворота, Smart Cloud, логику трейлинг-стопа, поддержку и сопротивление, окраску свечей, уведомления и мульти-таймфрейм анализ. Система создана, чтобы помочь вам торговать в разных рыночных условиях: Трендовые рынки: Определяйте главный тренд,
Scalper Vault — это мощная, полноценная торговая система, созданная для трейдеров, которые стремятся к стабильным результатам в внутридневной торговле. Этот высокоточный индикатор представляет собой комплексное, самостоятельное торговое решение, обеспечивающее аналитику профессионального (институционального) уровня как для торговли на рынке Forex, так и для работы с бинарными опционами. Пожалуйста, свяжитесь со мной после покупки, чтобы получить мои торговые советы, а также отличный бонус! Исклю
SIO Oscillator: самооптимизирующийся осциллятор дисбаланса семивариаций Купите индикатор и получите советник (EA) на его основе БЕСПЛАТНО. Большинство осцилляторов воспринимают любое движение цены одинаково. SIO разделяет давление покупателей и продавцов и измеряет дисбаланс между ними, показывая, какая сторона действительно контролирует рынок. Когда дисбаланс достигает экстремума, SIO выдаёт чёткий сигнал с уровнями входа, Stop Loss и Take Profit. Главное отличие SIO в том, что он не полагается
Advanced Supply Demand
Bernhard Schweigert
4.91 (302)
Специальное предложение – скидка 30% Этот индикатор является уникальным, качественным и доступным инструментом для торговли, включающим в себя наши собственные разработки и новую формулу. В обновленной версии появилась возможность отображать зоны двух таймфреймов. Это означает, что вам будут доступны зоны не только на старшем ТФ, а сразу с двух таймфреймов - таймфрейма графика и старшего: отображение вложенных зон. Обновление обязательно понравится всем трейдерам, торгующим по зонам спроса и пре
Gann Made Easy - это профессиональная, но при этом очень простая в применении Форекс система, основанная на лучших принципах торговли по методам господина У.Д. Ганна. Индикатор дает точные BUY/SELL сигналы, включающие в себя уровни Stop Loss и Take Profit. ПОЖАЛУЙСТА, СВЯЖИТЕСЬ СО МНОЙ ПОСЛЕ ПОКУПКИ, ЧТОБЫ ПОЛУЧИТЬ ТОРГОВЫЕ ИНСТРУКЦИИ И ОТЛИЧНЫЕ ДОПОЛНИТЕЛЬНЫЕ ИНДИКАТОРЫ БЕСПЛАТНО! Вероятно вы уже не раз слышали о торговли по методам Ганна. Как правило теория Ганна отпугивает от себя не только н
Zoryk Gold mt4
Reda El Koutbane
5 (3)
Скидка заканчивается через 24 часа — следующая цена $ 69 ограниченное количество копий по стартовой цене ZORYK — продвинутая сигнальная система для XAUUSD в MetaTrader 4 Вам знакомо это чувство. Вы анализируете золото, ждёте вход и наконец открываете сделку. Цена сразу начинает двигаться против вас. Вы закрываете позицию слишком рано, переносите Stop Loss или сомневаетесь несколько секунд. А затем рынок без вас достигает именно той цели, которую вы ожидали с самого начала. Проблема не всегд
This is a professional chart indicator designed for traders focused on stability and clear price action. It helps filter market noise and provides clear visual entry and exit zones for your trading decisions. Core Features: Strictly Non-Repainting: The system is built with strict non-repaint logic. What you see on the chart is the true historical performance. Confirmed Signals: Signals are triggered and confirmed only after the candle closes . Once a trading arrow appears on a closed candle, it
Atomic Analyst — MetaTrader 4 По вопросам продукта, настройки или технической поддержки напишите мне напрямую здесь, на MQL5. Индикатор превращает сложные рыночные расчеты в простые визуальные сигналы, цветные свечи, показания тренда, уровни стоп-лосса и несколько зон тейк-профита, которые трейдеры могут быстро понять и использовать в реальных рыночных условиях. Основные варианты использования: Скальпинг и внутридневная торговля: Создан для быстрого принятия решений, четких стрелок, алертов, цв
SR Liquidity — это торговый индикатор, предназначенный для выявления скрытых зон, где концентрируется рыночная ликвидность и наблюдается наиболее сильная реакция цены. Эти особые зоны ликвидности выступают в качестве мощных уровней поддержки и сопротивления, предоставляя вам четкую картину того, где с наибольшей вероятностью произойдет разворот рынка. Вместо построения стандартных линий поддержки и сопротивления, индикатор SR Liquidity анализирует реальное поведение цены, выявляя зоны концентрац
Этот индикатор исследует ценовую структуру фракталов разных периодов, чтобы определить возможные точки разворота на рынке, предоставляя время позиционным трейдерам, которые уже имеют фундаментальную или техническую модель оценки. В отличие от своего младшего брата, Reversal Fractals , этот индикатор не пропустит развороты из-за выбранного периода и будет находить разворотные фракталы зигзагообразно, игнорируя те развороты, которые не несут достаточного импульса для начала устойчивого движения ц
M1 Sniper
Oleg Rodin
4.97 (30)
M1 SNIPER — это простая в использовании торговая система. Это стрелочный индикатор, разработанный для тайм фрейма M1. Индикатор можно использовать как отдельную систему для скальпинга на тайм фрейме M1, а также как часть вашей существующей торговой системы. Хотя эта торговая система была разработана специально для торговли на M1, ее можно использовать и с другими тайм фреймами. Первоначально я разработал этот метод для торговли XAUUSD и BTCUSD. Но я считаю этот метод полезным и для торговли на д
RFI LEVELS PRO   определяет разворотные конструкции и ключевые зоны возврата цены, где может появляться активность крупных игроков. Индикатор помогает увидеть формирование нового тренда, определить потенциальную точку входа и заранее контролировать уровни риска и прибыли. VERSION MT5     —   Максимальный потенциал индикатора раскрывается при совместном использовании с   TREND LINES PRO . Что показывает индикатор: Разворотные конструкции и уровни, которые активируются в начале нового тренда. Поте
AW Prime Oscillator
AW Trading Software Limited
5 (1)
Комбинация из двух осцилляторов. Первый отображает точки входа, второй - текущий тренд. Индикатор может отображать сигналы осцилляторов стрелками в двух режимах, все сигналы быстрого осциллятора или сигналы только по текущему тренду. Имеет мультитаймфреймовую панель и три типа уведомлений о появлении сигнала.   Преимущества: Подходит для дневной и скальпирующей торговли Трендовая фильтрация Простая и чувствительная настройка Мультитаймфреймовая панель Подходит для интеграции в советник.  Работае
Liquidity Scalper System — торговая система на основе ликвидности в формате индикатора. Большинство индикаторов показывают только стрелку, а дальше трейдер сам решает, где поставить стоп, где цель и можно ли вообще доверять сигналу. Liquidity Scalper System закрывает весь цикл сделки: находит пулы ликвидности, даёт сигнал при их пробое, сразу рассчитывает Entry, Stop Loss и три цели, а на панели показывает статистику и результаты проверки на новых данных. Система сама подбирает настройки и обнов
PRO Renko System - это высокоточная система торговли на графиках RENKO. Система универсальна. Данная торговая система может применяться к различным торговым инструментам. Система эффективно нейтрализует так называемый рыночный шум, открывая доступ к точным разворотным сигналам. Индикатор прост в использовании и имеет лишь один параметр, отвечающий за генерацию сигналов. Вы легко можете адаптировать алгоритм к интересующему вас торговому инструменту и размеру ренко бара. Всем покупателям с удовол
Auto Optimized SpeedAngle — это система векторизации импульса институционального уровня, которая исключает подгонку под исторические данные (curve-fitting) за счет непрерывной форвард-оптимизации (Walk-Forward Optimization, WFO). Вместо того чтобы полагаться на статические входные параметры, которые теряют эффективность при смене рыночных режимов, индикатор динамически перекалибрует свои настройки, используя валидацию на вневыборочных данных (Out-of-Sample, OOS). Это гарантирует, что отображаемы
Индикатор оценивает наиболее вероятное краткосрочное движение цены на основе сложных математических расчетов. Особенности Оценка ближайшего движения цены на таймфрейме графика и на всех старших таймфреймах; Расчет реального тренда рынка; Расчет наиболее важных уровней поддержки и сопротивления; Оповещения о зонах скопления уровней, пересечениях уровней и сменах тренда; Бережно расходует ресурсы системы: линии и панель обновляются только при изменении значения; Самонастройка: работает на любом с
Route Lines Prices - индикатор разработанный для поиска направлений цены. Простой интерфейс индикатора содержит в себе множество алгоритмов поведения цены и расчет будущих направлений. В алгоритмах содержатся расчеты волатильности и сглаживание цены в соответствии с используемыми тайм-фреймами. Индикатор имеет единственный параметр для изменения значений " Calculating price values ". Значение по умолчанию 1 имеет сбалансированную автоматическую форму расчетов, которой можно пользоваться без с
CRT Candle Range Theory HTF MT4 - Ultimate CRT Indicator: Передовые концепции ICT и торговая система Malaysian SnR Освойте следы маркетмейкеров с помощью самого передового индикатора Candle Range Theory. Раскройте истинную силу Smart Money Concepts (SMC) и торгуйте точно так же, как институциональные участники, с помощью Ultimate CRT Indicator. Созданный исключительно для серьезных трейдеров, этот индикатор автоматизирует высокоэффективную теорию CRT (Candle Range Theory), являющуюся основой кон
All in One package includes the  Oscillator Predictor ,  MACD Predictor ,  Thrust Scanner  and  Advanced Fibonacci  indicators which are mandatory for applying  Dinapoli  trade plans.  Please visit below links for detailed explanations of indicators. Advanced Fibonacci Indicator =>  https://www.mql5.com/en/market/product/52834 Thrust Scanner Indicator => https://www.mql5.com/en/market/product/52830 Overbought /Oversold Predictor indicator => https://www.mql5.com/en/market/product/52621 Macd P
Индикатор измеряет дисбаланс между быками и медведями за определенный период и показывает прямую линию между двумя точками. Если быки имеют больший объем, чем медведи, линия становится зеленой.  Если объем медведей больше, она становится красной. Линия также показывает разницу в объемах в процентах. Индикатор показывает те же данные в отдельном окне. Вы также можете увидеть разделенный объем. Индикатор имеет два режима. Для этого слева вверху есть кнопка, которая,  - если она не нажата, и
Dark Support Resistance  is an Indicator for intraday trading. This Indicator is programmed to identify  Support and Resistance Lines , providing a high level of accuracy and reliability. Key benefits Easily visible lines Only the most important levels will be displayed Automated adjustment for each timeframe and instrument Easy to use even for beginners Never repaints, never backpaints, Not Lag 100% compatible with Expert Advisor development All types of alerts available: Pop-up, Email, Push
Volume Profile: мультирежимный, мультипрофильный, с отрисовкой на ценовом графике Индикатор рисует профиль объёма непосредственно на ценовом графике, вместе с линией Point of Control (POC), зоной стоимости (VAH и VAL) и опциональными пиками и впадинами. Вместо чтения объёма в отдельной нижней панели, объём отображается на ценовых уровнях, где он торговался, так что цену и объём можно читать в одном месте. Что отображает индикатор Линия POC (Point of Control): ценовой уровень с наибольшим торгуем
Super Signal – Skyblade Edition Профессиональная система трендовых сигналов без перерисовки и без задержек с исключительным процентом выигрышей | Для MT4 / MT5 Лучше всего работает на младших таймфреймах, таких как 1 минута, 5 минут и 15 минут. Основные характеристики: Super Signal – Skyblade Edition — это интеллектуальная система сигналов, специально разработанная для трендовой торговли. Она использует многоуровневую фильтрацию, чтобы выявлять только сильные направленные движения, подкреплённ
Индикатор Tokyo Indicator обеспечивает наглядное представление о направлении тренда, потенциальных торговых сигналах и текущей рыночной ситуации. Его ступенчатая линия тренда с цветовой индикацией позволяет различать «бычьи» фазы (выделены синим цветом) и «медвежьи» фазы (выделены пурпурным цветом). Соответствующие стрелки указывают на возможные точки входа в рынок (покупку или продажу) при смене тренда. Встроенная информационная панель объединяет данные о текущем сигнале, рыночном настроении,
Elliott Live — индикатор для MetaTrader 5, который автоматически размечает волны Эллиотта на истории и в реальном времени, на текущем баре. Завершённые волны рисуются сплошной линией, формирующаяся — пунктиром с вопросительным знаком (например, «3?»), и к ней сразу строятся уровни Фибоначчи и уровень отмены счёта. MT5-version:  https://www.mql5.com/en/market/product/200604 Как это работает Сначала строятся свинги (ZigZag). Разворот засчитывается, когда цена откатывает от экстремума не меньше, ч
TREND LINES PRO помогает понять, где рынок действительно меняет направление. Индикатор показывает реальные развороты тренда и места, где крупные участники входят повторно. Вы видите BOS-линии смены тренда и ключевые уровни старших таймфреймов — без сложных настроек и лишнего шума. Сигналы не перерисовываются и остаются на графике после закрытия бара. VERSION MT 5     -     Раскрывает свой максимальный потенциал в связке с индикатором  RFI LEVELS PRO Что показывает индикатор: Реальные смены   тр
Другие продукты этого автора
See the Dow Theory direction of six timeframes in one panel. DowgatorPro2 judges the current trend direction (up or down) automatically by Dow Theory, using closed bars only. It carries over the features of the earlier e-DowgatorPro and puts first that even a beginner can read the direction without confusion. The direction of six timeframes (M1 to D1) is shown on the panel in color. Features Check direction mismatch: see on the panel whether your chart's timeframe agrees with the higher timefram
The levels of higher timeframes, on the chart you are watching. LineTraderPro2 finds swing highs and lows with Dow Theory rules and draws horizontal lines at the levels the market watches, for any of 20 timeframes from M1 to W1. Each line is labeled with its timeframe (H1, D1 and so on) and the date of the swing, so you can see at a glance which timeframe a level belongs to without switching charts. What you see on the chart Horizontal lines: the swing highs above the price and the swing lows be
Round numbers on your chart, and a notice when the price gets close. RoundNumberAlert draws horizontal lines at round numbers (150.000, 150.500 ...) and watches them for you. When the price enters the touch range, only that line blinks and you get one notification. Major round numbers stand out in gold, and a small panel shows how many pips are left to the next round number above and below. Features Round-number lines: the step starts at 10 pips (for example 50 pips: 150.000, 150.500 ...). Major
Entry signals as finger marks: yellow for trend-following, pink for counter-trend. SignRAMB combines RSI, ATR, MACD, a moving average, Dow theory and the candles, and marks the places where the price may turn up or down, based on past chart patterns. A finger pointing up is a buy, pointing down is a sell. Signals are decided on closed bars and never repaint. Signals are not always right. Use them as one indicator, together with your own reading of the chart. They are meant for the move right aft
Which currency is strong right now — in one panel. CurrencyStrength takes the RSI of the 28 pairs of USD, EUR, JPY, GBP, AUD, CHF, CAD and NZD, turns it into a score from −100 to +100 for each currency, and shows them as bars, strongest first. Features Strength ranking: strong currencies in green, weak ones in red, scored from −100 to +100. Automatic symbol detection: the pairs are found from each symbol's base and profit currency, so suffixes and prefixes (EURUSD#, EURUSD.pro, m.EURUSD, EURUSDm
Trendlines drawn for you — and a good shape kept as your basis. TrendLineSnap finds the swing highs and swing lows on your chart, joins them and draws one high trendline and one low trendline. Triangles, channels, wedges and horizontal levels used in line trading show up as lines. Automatic trendlines are redrawn whenever a new swing forms. When you see a shape you want to trade, save it. The saved line does not move. When the price comes near it again, show the saved line next to the current li
Where is the price inside the range — in one panel. BoxRangeSnap looks for price zones where the highs and lows touched the same top and bottom again and again, and draws them as a big box and a small box. The panel keeps showing the distance from the price to the top and bottom of the current box. Features Automatic range boxes: a big box and a small box, newest first. The current box is highlighted and extends to the last closed bar. Adjustable detection: minimum touches on the top and bottom,
The Dow Theory structure of the chart — in one look. DowTheoryVisual labels every swing high and low as HH, HL, LH or LL and draws a zigzag colored by the trend: blue for an uptrend, red for a downtrend, gray for a range. The panel keeps showing the trend of the current chart and of two higher timeframes side by side. Features HH / HL / LH / LL labels: each swing high and low is compared with the previous one. Trend-colored zigzag: up blue, down red, range gray. The color changes on the bar wher
Key levels on nine timeframes, and an alert the moment the price breaks out. Prices that were stopped again and again are levels many traders watch. BreakerDetectPro finds the zones where swing highs and swing lows gather and draws one level above and one below the price for each timeframe you select, from M1 to MN1. Higher-timeframe levels are drawn on the chart you are looking at. Features Automatic key levels: one level above and one below the price, from swing highs and lows that gather in t
A small, rule-based edge from the Japanese calendar. For traders who want an EA that never averages down, and for GoldHam users looking for a second EA. It trades only on Gotobi mornings with a stop placed with every order, so its trading days and hours rarely overlap with GoldHam, which trades gold every day (use separate accounts). In Japan, the 5th, 10th, 15th, 20th, 25th and the last day of the month are called "Gotobi". Many Japanese importers settle their dollar payments on these days, so
A gold 1-minute basket EA, profit-seeking type. For traders who want to grow a small account. You pick only the multiplier and the lot grows with your balance. It trades heavier than its sister GoldHam Shield and grows faster; if you would rather keep drawdowns shallow, choose Shield instead. GoldHam Blade trades gold on the 1-minute chart. When price moves against the first entry it adds positions in the same direction, and closes all of them together once the basket is back in profit. Blade gr
A gold 1-minute basket EA, steady type. For traders who want shallow drawdowns and a long run. You choose fixed or compounding lots; at multiplier 1.0 fixed, the deepest drawdown over two years was 6%. It enters on the same signals as GoldHam Blade, only lighter, so pick one of the two rather than both. GoldHam Shield uses the same gold 1-minute basket logic as GoldHam Blade, with lighter positions and a cap on the deepest levels. You choose fixed lots or compounding, and a multiplier of 1.0 (re
A gold 1-minute EA, aggressive type, tuned to today's gold market. You choose two things: the multiplier (3.5 to 5.0) and the stop line (60 to 90 percent of the balance, default 80). What changed in version 2.08 Lots grow more gently than before, so the load stays lighter in a strong one-way move The default stop line is 80% of the balance. If you choose a line below the minimum for your multiplier, the EA raises it to that minimum In a replay of the gold spike on 3 November 2026 (real ticks), t
Copy trades between MT4 and MT5 terminals on one computer. CopyHam Inside Sender is the master side of a trade copier. Attach it to the account you want to copy from. It shows a Receiver code (CT-XXXX-XXXX) on its panel. Paste that code into CopyHam Inside Receiver on the other terminals, and they follow every trade of this account. The Sender and the Receivers exchange data through the common data folder of MetaTrader on the same computer. Nothing is sent over the internet, so there is no URL t
Follow a master account from another terminal on the same computer. CopyHam Inside Receiver is the follower side of a trade copier. Paste the Receiver code shown on CopyHam Inside Sender (CT-XXXX-XXXX) into its inputs, and this account opens, modifies and closes the same trades as the master. The data is exchanged through the common data folder of MetaTrader on the same computer. Nothing is sent over the internet. The master may be MT4 or MT5 and may be with a different broker. What is copied Ma
TradeHam Manager is a trade panel for manual traders. You decide when and where to trade. The panel takes care of the lot size, the order and the clean-up. It does not open trades on its own. It has no entry logic and does not promise any profit. Main features Risk-based lot size. Set the risk as a percent of balance, a fixed amount of money or a fixed lot. Drag the stop-loss line on the chart and the lot is recalculated. One-click orders. BUY / SELL buttons place the order with stop loss and ta
SignalHamToEA reads a signal indicator that draws arrows on the chart and places orders exactly as the arrows say. No programming is needed. Enter the indicator name and the buffer numbers that hold the buy and sell arrows, and it runs. The EA has no trading method of its own. Whether it enters is decided by the arrows of the indicator you connect, so you can try as many signal tools as you like. Four ways to read signals Buy/sell buffers (arrows), the basic mode One buffer that turns + / - (tre
See the Dow Theory direction of six timeframes in one panel. DowgatorPro2 judges the current trend direction (up or down) automatically by Dow Theory, using closed bars only. It carries over the features of the earlier e-DowgatorPro and puts first that even a beginner can read the direction without confusion. The direction of six timeframes (M1 to D1) is shown on the panel in color. Features Check direction mismatch: see on the panel whether your chart's timeframe agrees with the higher timefram
The levels of higher timeframes, on the chart you are watching. LineTraderPro2 finds swing highs and lows with Dow Theory rules and draws horizontal lines at the levels the market watches, for any of 20 timeframes from M1 to W1. Each line is labeled with its timeframe (H1, D1 and so on) and the date of the swing, so you can see at a glance which timeframe a level belongs to without switching charts. What you see on the chart Horizontal lines: the swing highs above the price and the swing lows be
Know exactly how long until the next release, and what came out. EconomicStopper shows the time to each economic release as a countdown, lists the upcoming events with their importance, and shows the actual value and the surprise against the forecast after the release. Everything is in one panel on the chart. It reads the economic calendar built into MetaTrader 5, so it needs no DLL and no web requests. How it behaves over time More than 5 minutes before: the timer counts down every second and t
See the market's fear level on the chart you trade. VixChecker shows the VIX (the volatility index often called the fear index) in a sub-window as one bar per day, colored by level: normal (blue), caution (yellow, 20 or above by default) and fear (red, 30 or above). The current value, the change from the previous close and the time of the value are shown in a small panel, and the value can also be shown on the main chart. Where the VIX values come from (please read before buying) The indicator d
Round numbers on your chart, and a notice when the price gets close. RoundNumberAlert draws horizontal lines at round numbers (150.000, 150.500 ...) and watches them for you. When the price enters the touch range, only that line blinks and you get one notification. Major round numbers stand out in gold, and a small panel shows how many pips are left to the next round number above and below. Features Round-number lines: the step starts at 10 pips (for example 50 pips: 150.000, 150.500 ...). Major
Entry signals as finger marks: yellow for trend-following, pink for counter-trend. SignRAMB combines RSI, ATR, MACD, a moving average, Dow theory and the candles, and marks the places where the price may turn up or down, based on past chart patterns. A finger pointing up is a buy, pointing down is a sell. Signals are decided on closed bars and never repaint. Signals are not always right. Use them as one indicator, together with your own reading of the chart. They are meant for the move right aft
Which currency is strong right now — in one panel. CurrencyStrength takes the RSI of the 28 pairs of USD, EUR, JPY, GBP, AUD, CHF, CAD and NZD, turns it into a score from −100 to +100 for each currency, and shows them as bars, strongest first. Features Strength ranking: strong currencies in green, weak ones in red, scored from −100 to +100. Automatic symbol detection: the pairs are found from each symbol's base and profit currency, so suffixes and prefixes (EURUSD#, EURUSD.pro, m.EURUSD, EURUSDm
Trendlines drawn for you — and a good shape kept as your basis. TrendLineSnap finds the swing highs and swing lows on your chart, joins them and draws one high trendline and one low trendline. Triangles, channels, wedges and horizontal levels used in line trading show up as lines. Automatic trendlines are redrawn whenever a new swing forms. When you see a shape you want to trade, save it. The saved line does not move. When the price comes near it again, show the saved line next to the current li
Where is the price inside the range — in one panel. BoxRangeSnap looks for price zones where the highs and lows touched the same top and bottom again and again, and draws them as a big box and a small box. The panel keeps showing the distance from the price to the top and bottom of the current box. Features Automatic range boxes: a big box and a small box, newest first. The current box is highlighted and extends to the last closed bar. Adjustable detection: minimum touches on the top and bottom,
The Dow Theory structure of the chart — in one look. DowTheoryVisual labels every swing high and low as HH, HL, LH or LL and draws a zigzag colored by the trend: blue for an uptrend, red for a downtrend, gray for a range. The panel keeps showing the trend of the current chart and of two higher timeframes side by side. Features HH / HL / LH / LL labels: each swing high and low is compared with the previous one. Trend-colored zigzag: up blue, down red, range gray. The color changes on the bar wher
Key levels on nine timeframes, and an alert the moment the price breaks out. Prices that were stopped again and again are levels many traders watch. BreakerDetectPro finds the zones where swing highs and swing lows gather and draws one level above and one below the price for each timeframe you select, from M1 to MN1. Higher-timeframe levels are drawn on the chart you are looking at. Features Automatic key levels: one level above and one below the price, from swing highs and lows that gather in t
A small, rule-based edge from the Japanese calendar. For traders who want an EA that never averages down, and for GoldHam users looking for a second EA. It trades only on Gotobi mornings with a stop placed with every order, so its trading days and hours rarely overlap with GoldHam, which trades gold every day (use separate accounts). In Japan, the 5th, 10th, 15th, 20th, 25th and the last day of the month are called "Gotobi". Many Japanese importers settle their dollar payments on these days, so
A gold 1-minute basket EA, profit-seeking type. For traders who want to grow a small account. You pick only the multiplier and the lot grows with your balance. It trades heavier than its sister GoldHam Shield and grows faster; if you would rather keep drawdowns shallow, choose Shield instead. GoldHam Blade trades gold on the 1-minute chart. When price moves against the first entry it adds positions in the same direction, and closes all of them together once the basket is back in profit. Blade gr
Фильтр:
Нет отзывов
Ответ на отзыв