Market Session Analyzer
- Индикаторы
- Версия: 1.0
- Активации: 20

Turn market sessions into measurable historical context.
Market Session Analyzer is an informational indicator for MetaTrader 5 that studies how Asia, London, New York, and the United States cash session behaved across a configurable historical sample.
It combines automatic session boxes with range statistics, London breakouts of the Asia range, New York reactions, ADR context, and a compact tabbed dashboard.
Market Session Analyzer is observation-only. It never sends trading requests and never opens, modifies, or closes orders or positions.
For complete statistical definitions and practical examples, read the detailed Market Session Analyzer guide.
Why Use Market Session Analyzer?
A session box shows where price traded. Market Session Analyzer adds the historical context needed to judge whether the current range or reaction is common, compressed, extended, or unusual for the selected sample.
It can help you review questions such as:
- How often does London break the Asia high, low, or both sides?
- Which side is usually broken first?
- How frequently does the first break return, retest, or fail?
- How large are Asia, London, New York, US cash, or custom-session ranges?
- Does New York tend to continue or reverse the pre-New-York London move?
- How much of the prior ADR has London already consumed?
Automatic Session Model
- Asia range - 00:00-08:00 London time.
- London - 08:00-17:00 London time.
- New York - 08:00-17:00 United States Eastern time.
- US cash - 09:30-16:00 United States Eastern time.
- Custom session - optional user-defined window in London time, including overnight windows.
Historical GMT/BST and EST/EDT rules are applied separately. The default automatic broker-time profile recognizes common UTC+2/UTC+3 New-York-close servers; manual fixed, US-DST, and EU-DST profiles are available for unusual broker histories.
Historical Statistics
The indicator can analyze the last 30, 60, 120, or a custom number of completed trading days. The sample can also be filtered by weekday.
Available statistics include:
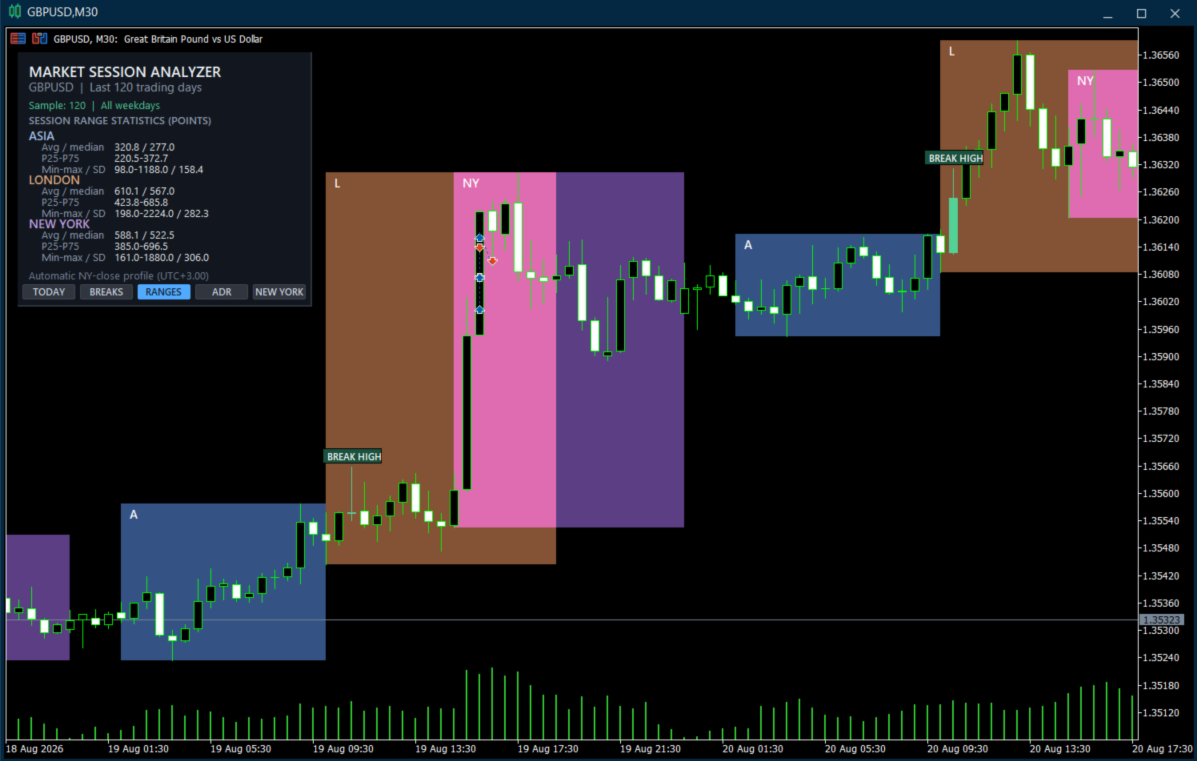
- Average and median session range.
- Minimum, maximum, population standard deviation, P25, and P75.
- Five-bin range distribution when one session is selected.
- Visible sample sizes for percentage-based statistics.
- M5 data-coverage filtering for incomplete sessions.
Asia Range and London Breakouts
Market Session Analyzer measures London breaks of the completed Asia range. A breakout can be defined by a wick touch, one M5 close, or a configurable number of consecutive M5 closes beyond the level.
The effective penetration threshold is the stricter of a fixed number of symbol points and a percentage of the Asia range. This makes the default definition usable across Forex pairs, metals, and index CFDs.
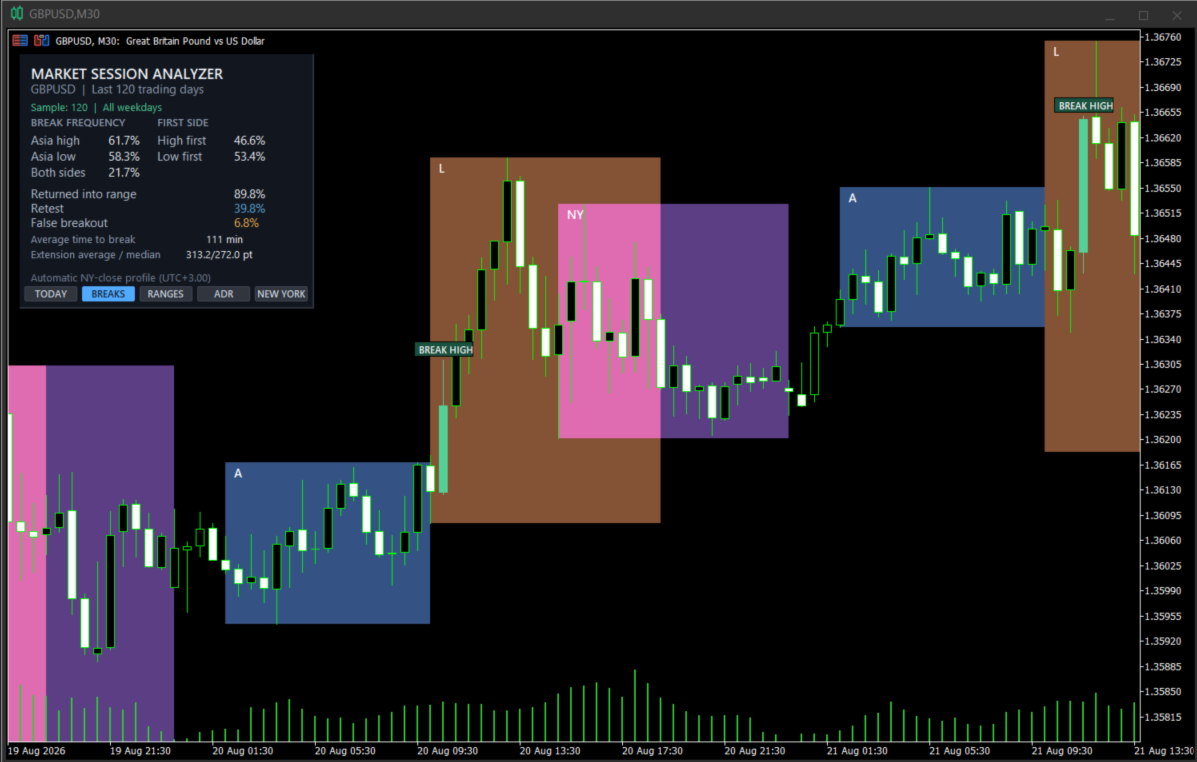
The BREAKS view reports:
- Asia-high, Asia-low, and both-side break frequency.
- High-first and low-first frequency.
- Return into the Asia range.
- Quick retest and false-breakout frequency.
- Average time to the first break.
- Average and median extension beyond the first broken boundary.
If the same M5 candle breaks both sides, the first side is intentionally left unassigned because OHLC data cannot reconstruct the tick order.
New York and ADR Context
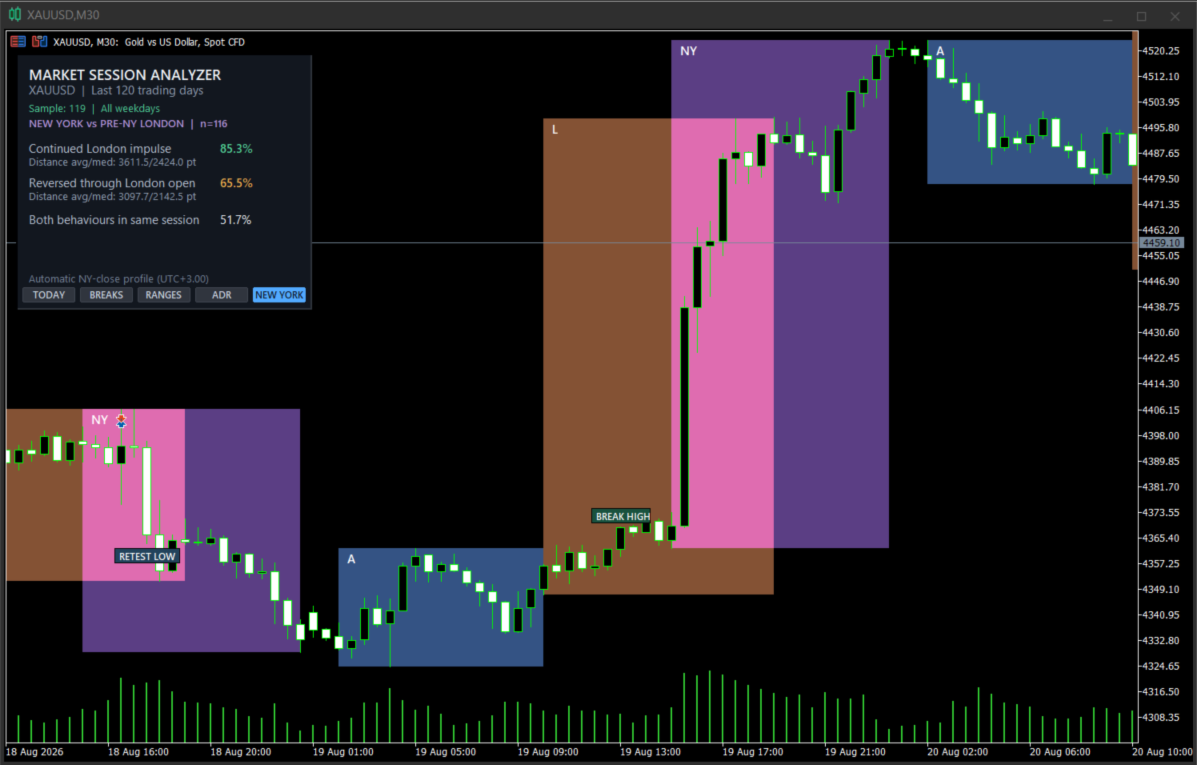
The NEW YORK view compares the New York session with the directional London move formed before New York opens.
- Continuation frequency and average/median continuation distance.
- Reversal frequency and average/median reversal distance.
- Sessions in which both behaviours occurred.
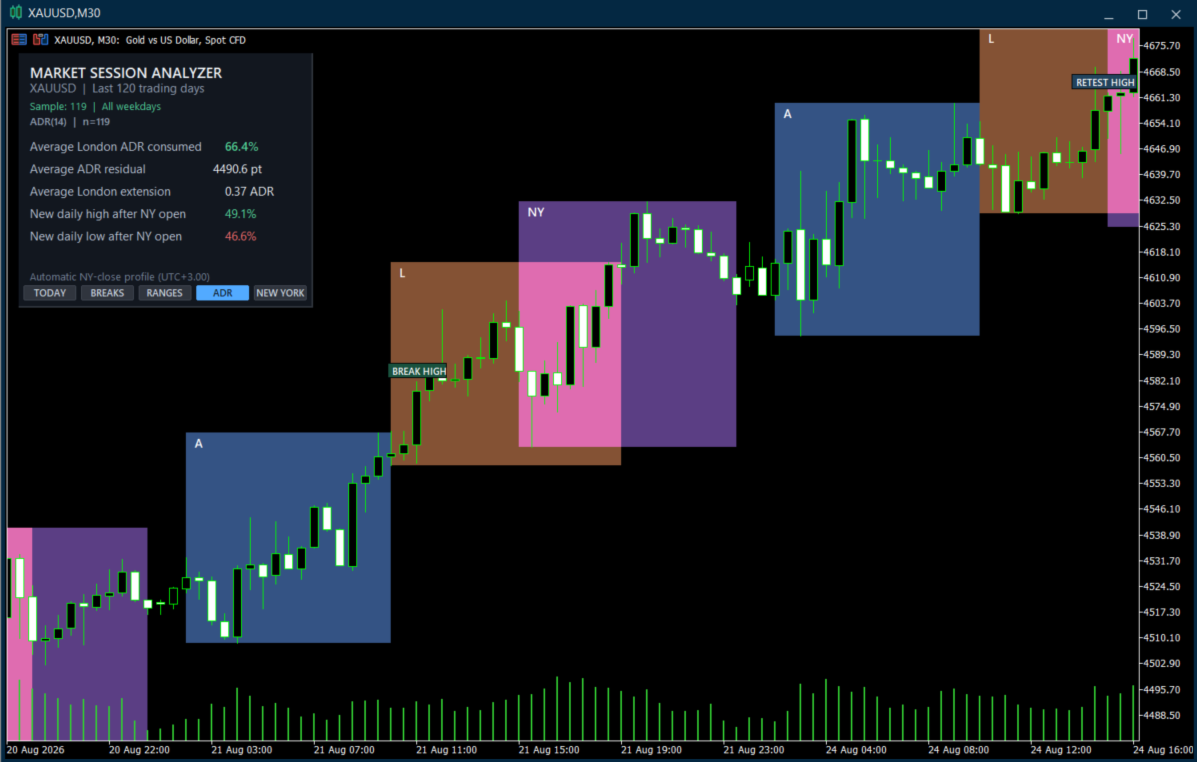
The ADR view uses completed broker D1 bars and reports London ADR consumption, residual ADR, ADR-normalized breakout extension, and the frequency of a new daily high or low after New York opens.
On-Chart Dashboard
The compact dashboard is divided into five tabs:
- TODAY - current Asia range and London outcome.
- BREAKS - Asia-range breakout behaviour during London.
- RANGES - descriptive session statistics and selected-session distribution.
- ADR - daily-range context.
- NEW YORK - continuation and reversal behaviour.
Recent session rectangles can be filled or outlined and use short labels for identification. The first-break candle is recolored and labeled with its final BREAK, RETEST, or FALSE classification, without using trade-like arrows or order lines.
Simple Workflow
- Attach Market Session Analyzer to the symbol you want to study.
- Choose the historical period, weekday filter, and breakout method.
- Leave SessionFilter on the core-session view or select one session for focused range statistics.
- Use the dashboard tabs to compare today with the selected historical sample.
- Use manual time settings only when your broker history does not follow the automatically detected convention.
The indicator can be attached to any chart timeframe. Its statistical engine intentionally uses M5 data so session events have five-minute resolution while long historical samples remain practical.
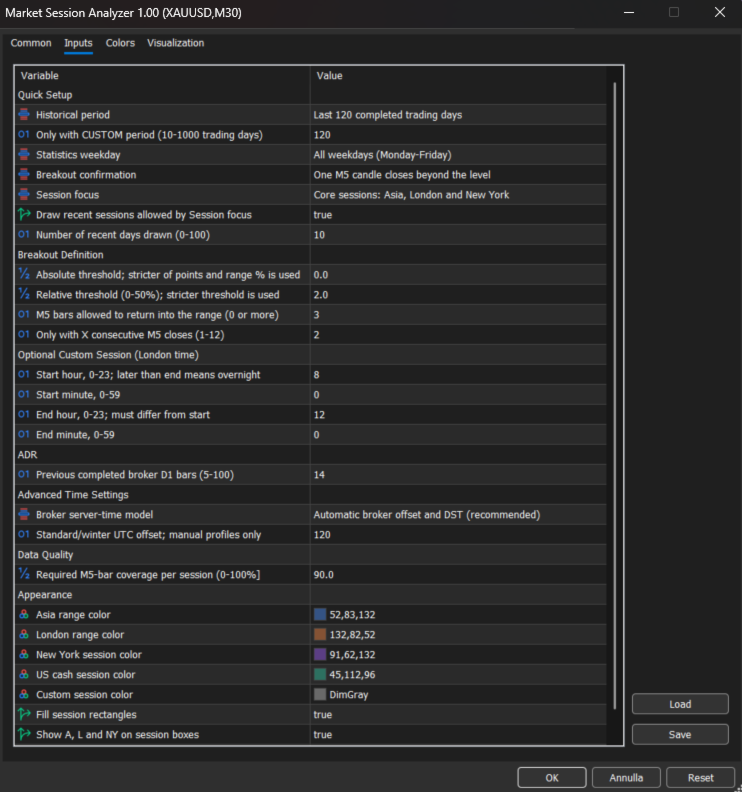
Inputs
Quick Setup
- AnalysisPeriod - last 30, 60, 120, or a custom number of completed trading days.
- CustomLookbackTradingDays - custom sample length from 10 to 1000 trading days.
- WeekdayFilter - all weekdays or one selected weekday.
- BreakoutMethod - wick touch, one M5 close, or consecutive M5 closes.
- SessionFilter - core sessions, Asia, London, New York, US cash, or custom session.
- ShowHistoricalBoxes - shows recent session rectangles allowed by the session filter.
- HistoricalDaysOnChart - number of recent days drawn on the chart.
Breakout Definition
- MinimumBreakoutPoints - absolute penetration threshold in symbol points.
- MinimumBreakoutRangePercent - penetration threshold as a percentage of the Asia range; the stricter of the two thresholds is used.
- FalseBreakoutWindowBars - M5 bars allowed for the quick return into the range.
- BreakoutConfirmationBars - required consecutive closes when that breakout method is selected.
Optional Custom Session
- CustomSessionStartHour / CustomSessionStartMinute - session start in London time.
- CustomSessionEndHour / CustomSessionEndMinute - session end in London time. An earlier end creates an overnight session; identical start and end times are invalid.
ADR, Time, Data Quality, and Appearance
- ADRPeriod - number of completed broker D1 bars used for ADR.
- ServerTimeProfile - automatic, fixed UTC, US DST, or EU DST broker-time model.
- BrokerStandardUtcOffsetMinutes - standard/winter offset used by manual profiles.
- MinimumSessionCoveragePercent - minimum required M5 coverage for a valid session.
- AsiaBoxColor, LondonBoxColor, NewYorkBoxColor, UsCashBoxColor, CustomBoxColor - session colors.
- FillSessionBoxes - switches between filled and outlined rectangles.
- ShowSessionLabels - shows session abbreviations.
- ShowBreakoutMarkers - shows the first London break and its subsequent classification.
Important Notes
- The indicator uses the chart symbol and does not require a fixed chart timeframe.
- Statistics use internally loaded M5 bars; breakout events and times therefore have five-minute resolution.
- Results can differ between brokers because historical prices, missing bars, symbol specifications, and server-time conventions can differ.
- The automatic UTC+2/UTC+3 policy is designed for common New-York-close broker servers. Select a manual profile when the tested history uses another convention.
- In the Strategy Tester, AUTO uses a deterministic UTC+2/UTC+3 New-York-close fallback because MetaTrader reports its simulated server and GMT clocks as equal.
- The weekday filter is applied inside the selected lookback; it does not request that many occurrences of the chosen weekday.
- US cash and the custom session are selected explicitly to avoid excessive overlapping boxes in the default view.
- Historical statistics describe the selected sample and do not predict future market behaviour.
- Market Session Analyzer does not provide trading advice, trading signals, or guaranteed results.