Market Session Analyzer: Statistical Definitions and Practical Guide for MetaTrader 5

Session ranges become more useful when they are measured against a consistent historical sample.
Market Session Analyzer is an informational indicator for MetaTrader 5. It combines automatic Asia, London, New York, and US cash session mapping with historical range statistics, London break analysis, New York behaviour, and ADR context.
This guide explains exactly how the main metrics are constructed and how to interpret the five dashboard tabs. The indicator is available on the Market Session Analyzer product page.
Market Session Analyzer is observation-only. It never opens, modifies, or closes orders or positions. Its statistics describe the selected historical sample and do not predict future market behaviour.
Why Session Statistics Need Explicit Rules
A colored session rectangle is easy to understand: it shows where price traded during a defined period. Historical comparisons require more precision.
Two indicators can display different breakout frequencies if they use different session clocks, treat a wick as a break instead of a close, accept incomplete historical sessions, or define a false breakout differently.
Market Session Analyzer therefore uses fixed, reproducible definitions. The same rules are applied to every day in the selected sample.
The Session Model
- Asia range - 00:00 inclusive to 08:00 exclusive in London civil time.
- London - 08:00 inclusive to 17:00 exclusive in London civil time.
- New York - 08:00 inclusive to 17:00 exclusive in United States Eastern time.
- US cash - 09:30 inclusive to 16:00 exclusive in United States Eastern time.
- Custom session - an optional user-defined interval in London time.
The custom interval may cross midnight. If its end is earlier than its start, it ends on the following day. Identical start and end times are invalid.
Time Zones and Daylight Saving Time
London and New York do not always change daylight saving time on the same date. For this reason, GMT/BST and EST/EDT are converted separately for every historical session.
ServerTimeProfile controls how those UTC sessions are mapped to broker time:
- AUTO recognizes the common UTC+2 winter and UTC+3 summer New-York-close convention.
- FIXED keeps one broker UTC offset throughout the year.
- US DST applies United States daylight-saving transitions to the configured standard offset.
- EU DST applies European daylight-saving transitions to the configured standard offset.
In the Strategy Tester, MetaTrader reports the simulated server and GMT clocks as equal. AUTO therefore uses a deterministic UTC+2/UTC+3 New-York-close fallback. A manual profile should be selected when the tested broker history follows another convention.
Historical Sample and Data Quality
AnalysisPeriod selects 30, 60, 120, or a custom number of completed weekday sessions. The displayed sample can be smaller because sessions that do not meet MinimumSessionCoveragePercent are excluded.
The weekday filter is applied inside the selected lookback. For example, Monday with a 120-day lookback means the Mondays found inside those 120 completed weekday sessions, not the last 120 Mondays.
The statistical engine loads M5 data internally, independently of the active chart timeframe. This gives breakout events five-minute resolution while allowing the indicator to be attached to another chart timeframe.
Different metrics can have different valid sample sizes. Core Asia and London statistics require both sessions to be valid. New York statistics additionally require valid New York data. US cash and custom-session ranges use their own valid observations.
Range Statistics
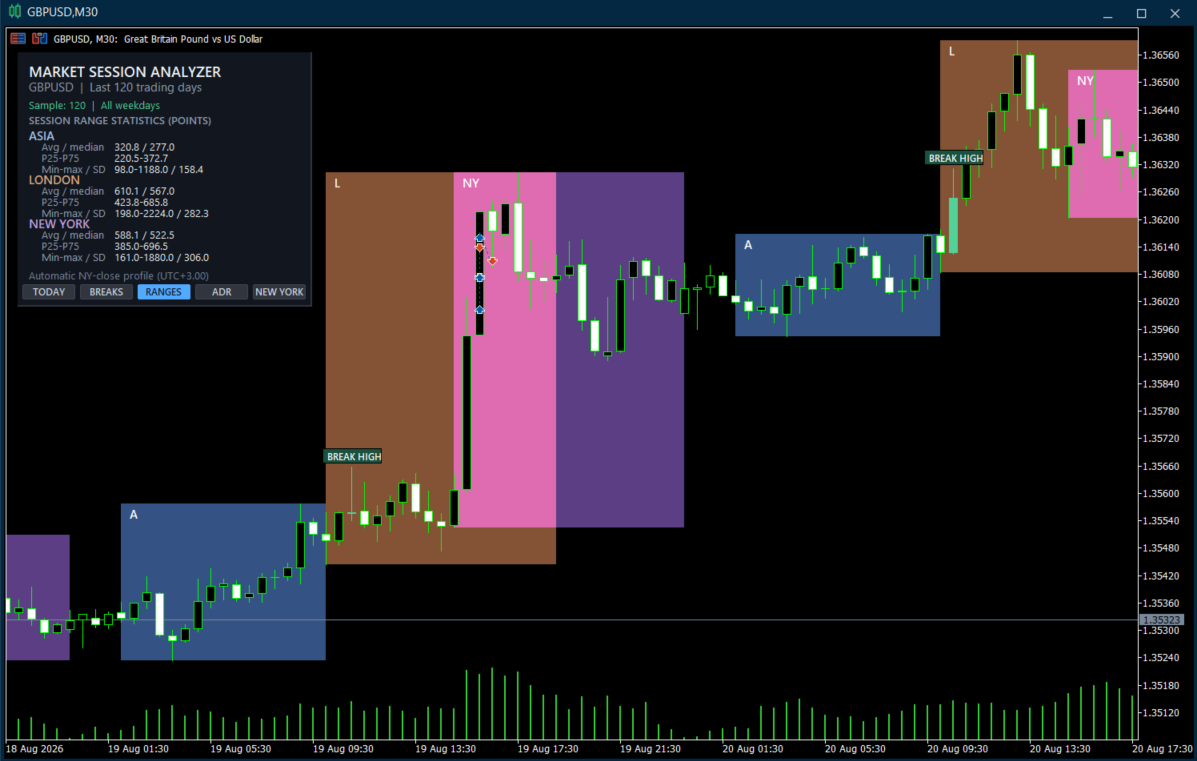
A session range is its highest high minus its lowest low, expressed in symbol points.
- Average - arithmetic mean of the observed ranges.
- Median - central observed value, or the mean of the two central values for an even sample.
- P25 and P75 - linearly interpolated sample percentiles delimiting the central 50% interval.
- Minimum and maximum - observed sample extremes.
- SD - population standard deviation of the observed ranges.
The TODAY tab compares the current range with historical P25-P75. Below P25 indicates a range smaller than the lower quartile of the selected sample; above P75 indicates a range larger than the upper quartile. This is descriptive context, not a directional signal.
The Five-Bin Distribution
When SessionFilter selects one session, the RANGES tab adds a five-bin distribution. The interval between the observed minimum and maximum is divided into five equal-width point ranges.
The first four intervals are left-closed and right-open: [a,b). The final interval is closed at both ends: [a,b]. This prevents boundary overlap and ensures that the observed maximum is counted.
The five counts always sum to the distribution sample, and their percentages sum to approximately 100%, allowing for display rounding. Empty bins are valid, especially with small samples or large outliers.
If every observed range is identical, the normal bin width would be zero. In that case, the dashboard displays one 100% bar for the common value.
London Breakouts of the Asia Range
The completed Asia high and low become fixed reference boundaries during London. BreakoutMethod determines what qualifies as a break:
- Wick touch - the M5 high or low exceeds the boundary by the effective threshold.
- One close - one M5 candle closes beyond the effective threshold.
- Consecutive closes - the configured number of consecutive M5 candles close beyond it.
For consecutive closes, the event time is the final confirming bar.
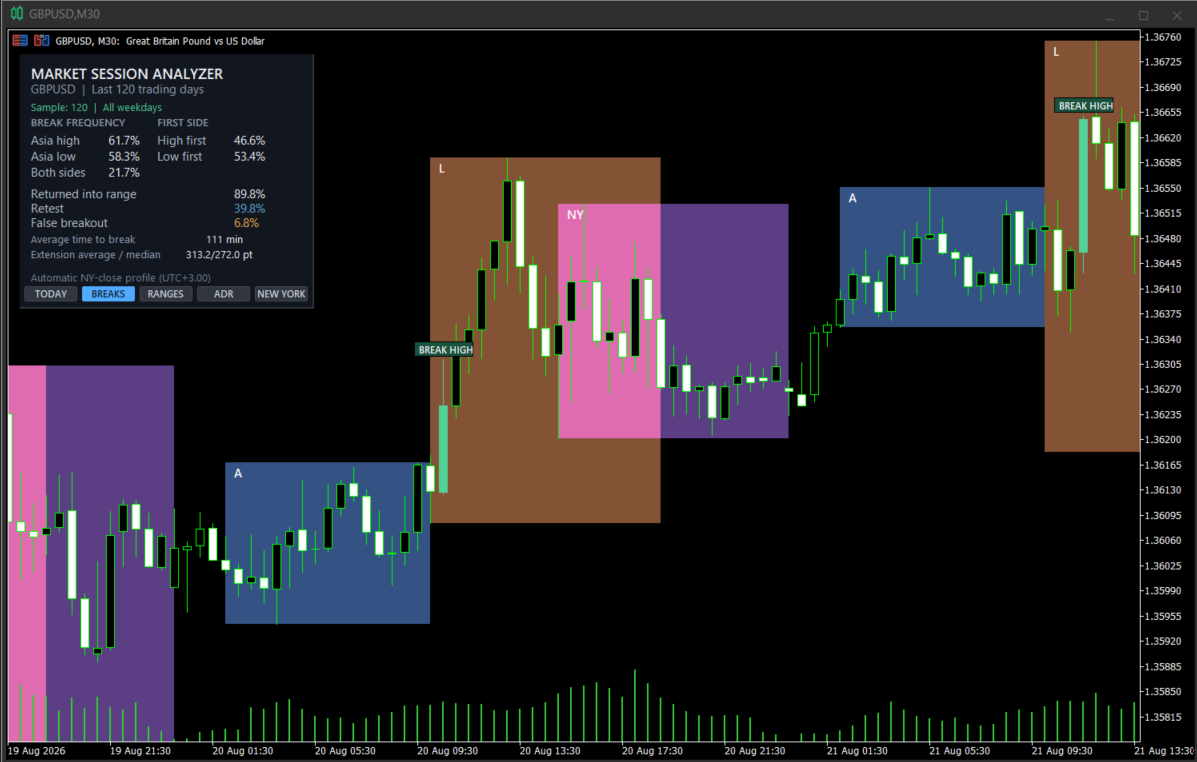
The effective penetration threshold is the greater of MinimumBreakoutPoints and the Asia-range percentage set with MinimumBreakoutRangePercent. Combining an absolute and a relative threshold helps keep the definition comparable across symbols with different point scales and typical ranges.
First Side and Ambiguous Breaks
High first and low first describe the first Asia boundary broken in chronological M5 data.
If the same M5 candle breaks both boundaries, the first side remains unassigned. OHLC data proves that both extremes occurred but cannot reconstruct which one happened first without tick data.
Asia-high, Asia-low, and both-side frequencies use valid core days as their denominator. First-side statistics use only days with an unambiguous directional first break.
Return, Retest, and False Breakout
These terms describe different stages after an unambiguous first break:
- Return into range - a later M5 candle closes between the Asia low and high, inclusive.
- Quick return - that close occurs within FalseBreakoutWindowBars of the first break.
- Retest - after the quick return, the same boundary is broken again before London ends.
- False breakout - after the quick return, the same boundary is not broken again before London ends.
Retest and false-breakout percentages use unambiguous directional first breaks as their denominator. They are final classifications, so a forming current session may first be shown as RETURNED and only later become RETEST or FALSE.
Touch mode also permits a wick outside followed by a close inside on the same M5 candle to qualify as a quick return.
Time to Break, Extension, and Chart Markers
Time to break is measured in minutes from the London open to the first confirmed event. Extension is the maximum excursion beyond the first broken Asia boundary before London closes.
The first-break candle is recolored on the active chart timeframe. Its compact badge shows the final BREAK, RETEST, or FALSE classification. The label remains attached to the first-break candle; it is not moved to the later return or rebreak candle. This avoids trade-like arrows and order lines.
New York Continuation and Reversal
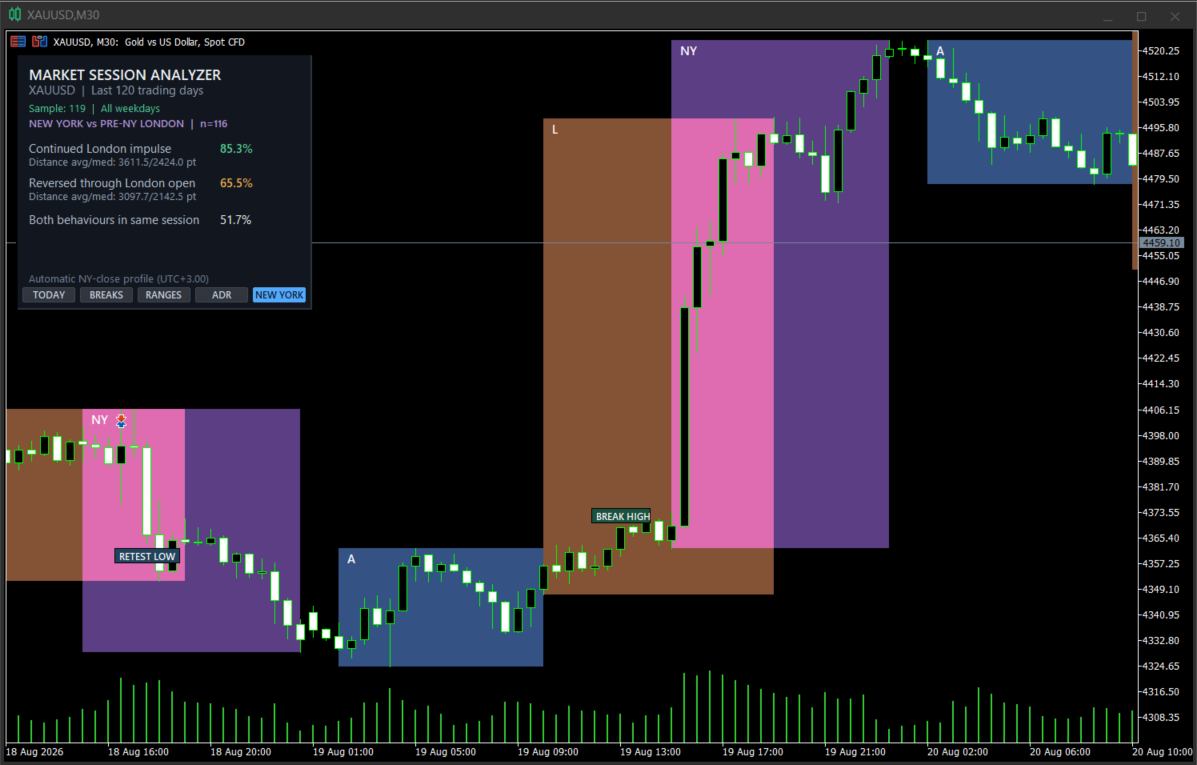
The pre-New-York London impulse is measured from the London open to the final completed M5 close before New York opens.
- Continuation - New York exceeds the directional high or low formed between the London open and New York open.
- Reversal - New York crosses the London open in the direction opposite the pre-New-York impulse.
- Both - continuation and reversal occur during the same New York session.
Continuation and reversal are independent. Their average and median distances are conditional on the corresponding event having occurred. All reference levels are frozen at the New York open to avoid look-ahead.
ADR Context
ADR is the average high-low range of the configured number of completed broker D1 bars preceding the analyzed session.
- ADR consumed - London range divided by the prior ADR. It may exceed 100%.
- ADR residual - the greater of ADR minus London range and zero, expressed in points.
- ADR-normalized extension - London breakout extension divided by ADR.
- New daily high or low after New York opens - New York exceeds an extreme formed between the Asia start and New York open.
New daily high and low are independent events and can both occur in the same session.
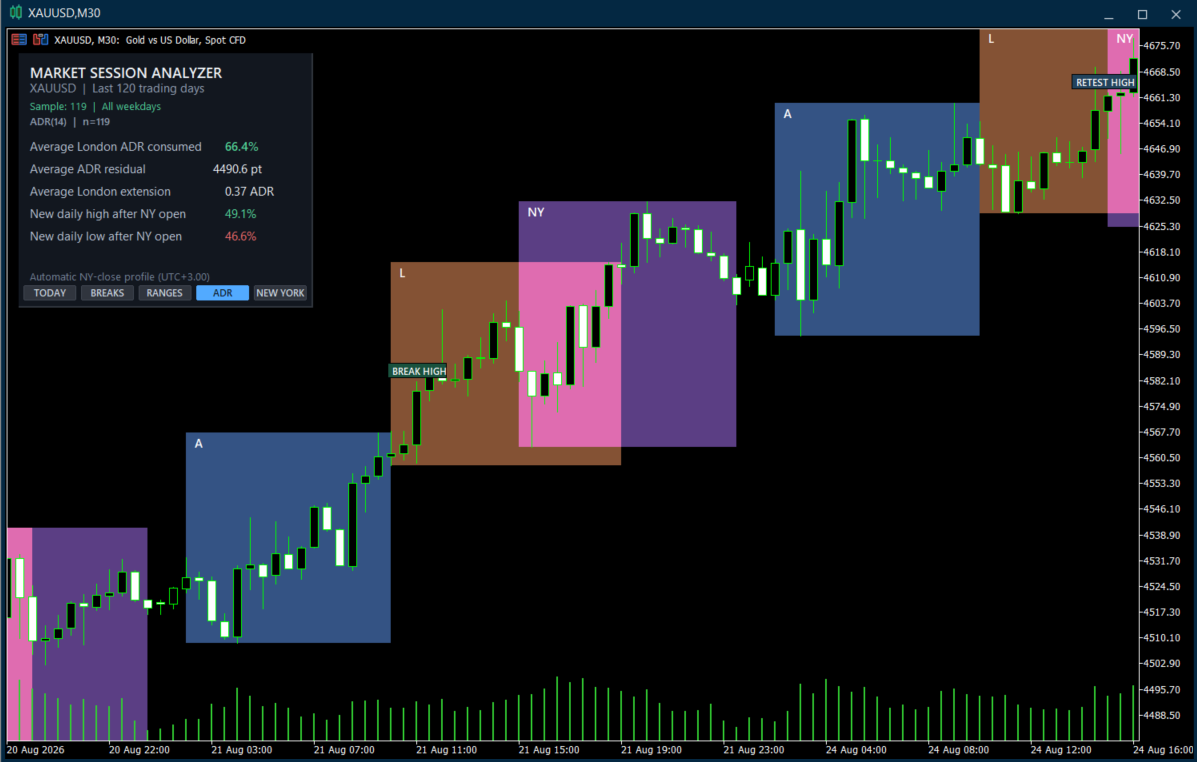
Reading the Five Dashboard Tabs
- TODAY compares the forming or completed current range with historical P25-P75 and reports the current London outcome.
- BREAKS summarizes boundary frequency, first side, returns, retests, false breakouts, time, and extension.
- RANGES shows descriptive statistics and, for one selected session, the five-bin distribution.
- ADR places London range and extension inside the prior daily-range context.
- NEW YORK reports continuation, reversal, both-event frequency, and conditional distances.
A Practical Workflow
- Attach Market Session Analyzer to the symbol you want to study.
- Start with 120 completed weekday sessions and the default close-confirmed breakout method.
- Check the displayed sample before interpreting a percentage.
- Use RANGES to understand typical session size and dispersion.
- Use BREAKS to study how London interacted with the completed Asia range.
- Use ADR and NEW YORK for additional daily-range and overlap context.
- Change one definition at a time when comparing results.
A useful historical percentage is not automatically a trading edge. It should be interpreted together with sample size, instrument, broker history, market regime, costs, and the trader's own execution rules.
Important Limitations
- Results can differ between brokers because prices, missing bars, symbol specifications, and server-time histories can differ.
- M5 OHLC data cannot determine the order of events occurring inside one candle.
- Small samples can produce unstable percentages and empty distribution bins.
- Outliers can widen equal-width distribution bins and compress most observations visually.
- The automatic time profile is intended for common UTC+2/UTC+3 New-York-close servers; other histories may require manual settings.
- Historical statistics describe the selected sample and do not guarantee future outcomes.
Final Thoughts
Market Session Analyzer is designed to turn familiar session concepts into explicit historical measurements. Its purpose is not to tell the trader what to do, but to make questions about ranges, breakouts, retests, ADR, and New York behaviour easier to investigate with consistent definitions.
For product details, inputs, screenshots, and the MetaTrader 5 demo, visit the Market Session Analyzer page on MQL5 Market.


