Breakout Bands
- Индикаторы
- Версия: 1.7

Breakout Bands — Adaptive Scalping & Breakout Retest Indicator
Identify Potential Scalping Entries Around Adaptive Volatility Bands
Breakout Bands is a specialized intraday scalping indicator designed exclusively for M1-M5 charts.
The indicator creates an adaptive band structure around a smoothed 89-period EMA reference, with the band distance derived from the market's ATR-based volatility range.
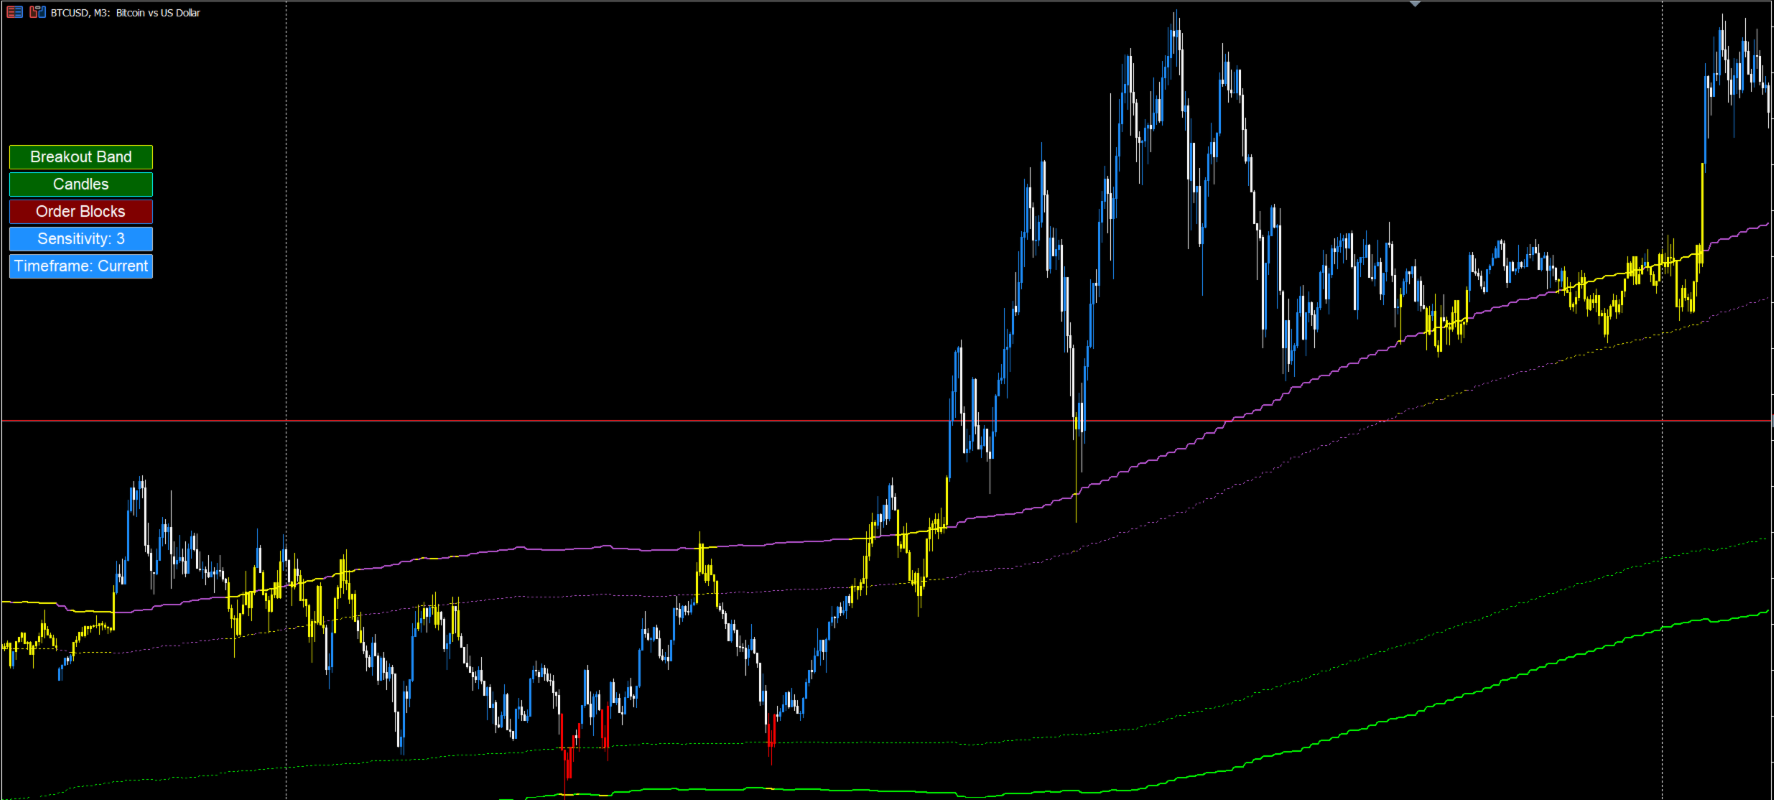
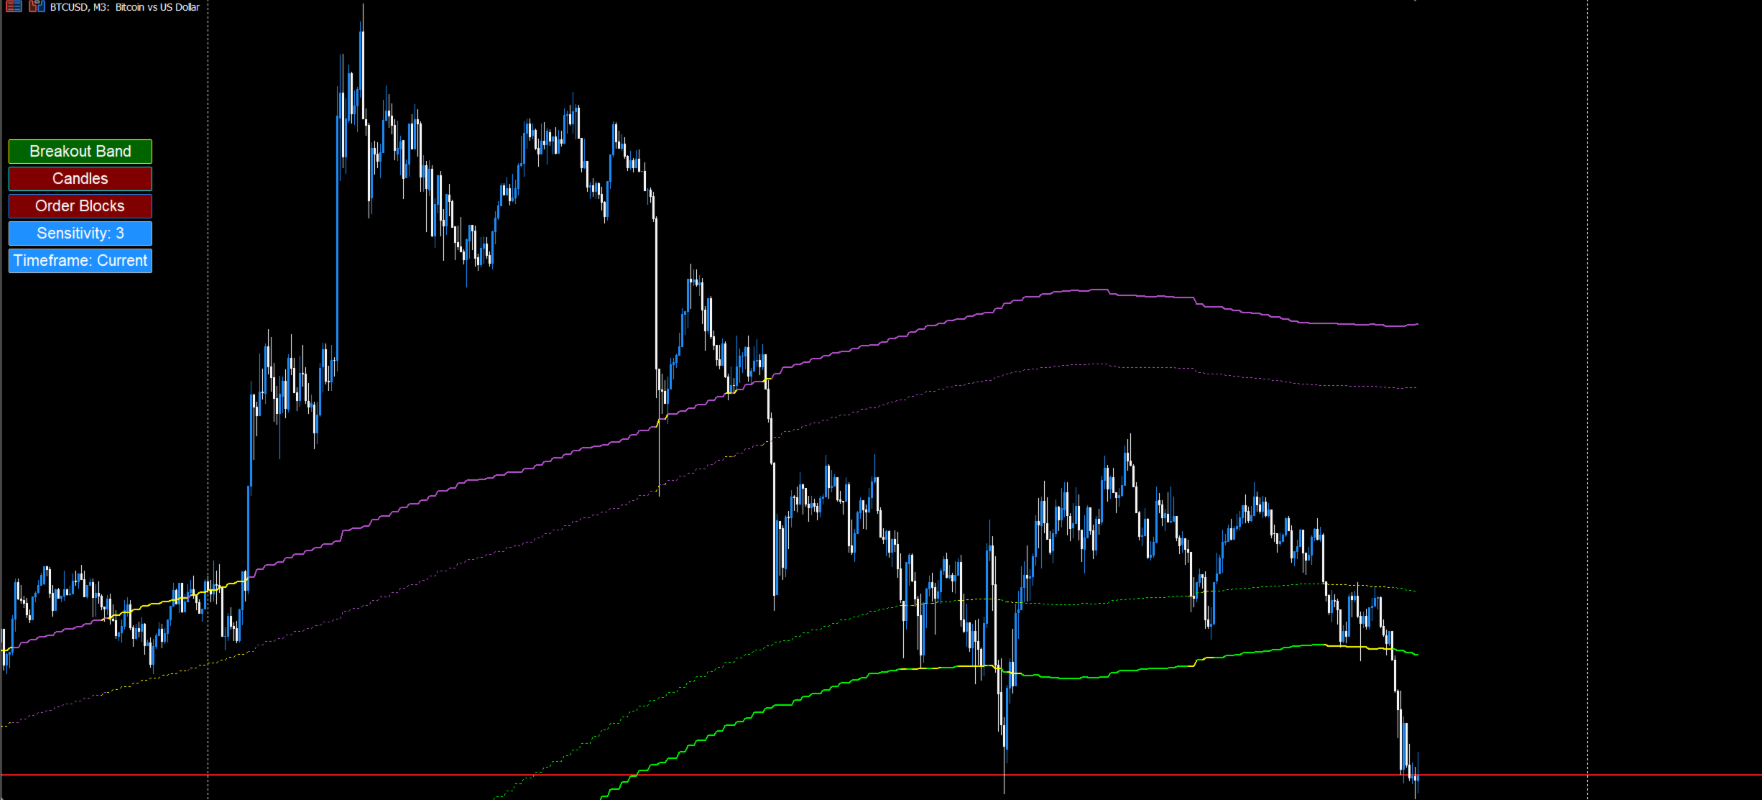
Rather than simply following price, Breakout Bands is designed to help traders identify situations where price breaks outside the established band structure and then retraces toward either the inner or outer band, creating potential areas of interest for short-term breakout-retest and continuation setups.
The indicator combines:
- Adaptive ATR-based volatility bands
- 89 EMA-based reference structure
- Breakout/retracement visualization
- Optional candle-state coloring
- Volume-based Order Blocks
- Tick-volume Buy/Sell estimation
- HMA-based volume analysis
- Adjustable volume sensitivity
- Multi-timeframe Order Block analysis
- Simple on-chart controls
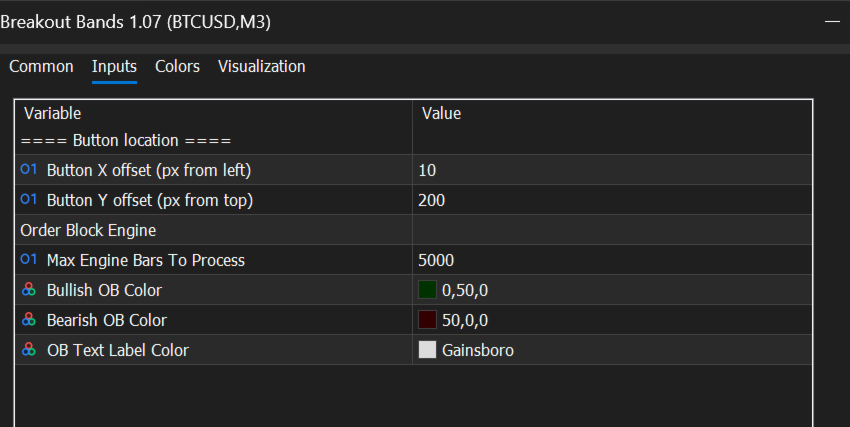
All of this is controlled through a minimal-input interface, allowing traders to configure the indicator primarily from the chart rather than navigating a large settings menu.
How Breakout Bands Works
The core of the indicator is an adaptive band structure calculated from the relationship between an 89-period EMA reference and ATR-derived market range. The EMA structure uses sequential 89-period EMA smoothing rather than a traditional Double Exponential Moving Average (DEMA). The resulting reference is used to establish adaptive upper and lower volatility boundaries. Since the band distance is derived from ATR, the bands automatically respond to changing market conditions asymmetrically.
The Breakout-Retest Concept
Breakout Bands is designed around a simple concept:
Price moves outside the band structure → price retraces toward the band → the reaction around the band can become a potential scalping entry area.
The indicator provides multiple band levels so traders can observe where price is trading relative to the adaptive volatility structure.
Potential setups may occur when price:
- Breaks above the upper structure
- Breaks below the lower structure
- Retraces back toward an inner band
- Retraces toward an outer band
- Rejects a band after a breakout
- Continues in the direction of the original breakout
The indicator does not attempt to predict every market movement or generate a trade signal on every candle. Instead, it provides a visual framework for identifying potential high-interest areas for short-term traders.
Volume-Based Order Blocks
Breakout Bands also includes an optional Volume Order Block engine. Order Blocks are calculated using tick-volume analysis combined with HMA-based calculations to identify areas where elevated market activity may have occurred. The Order Block system can display estimated: Buy % / Sell %
These percentages are derived from tick-volume calculations and should be interpreted as an estimate of buying and selling pressure, rather than actual exchange-level buy/sell volume. This can help traders evaluate whether an identified area is showing relatively stronger bullish or bearish volume characteristics.
Important:
The Buy/Sell percentages are estimates derived from available tick volume. They do not represent actual bid/ask transaction volume or centralized exchange order-flow data.
Adjustable Volume Sensitivity
The Order Block engine provides three sensitivity levels:
1 — High Sensitivity
Designed to identify more volume-based areas.
3 — Moderate Sensitivity
A balanced setting for general use.
5 — Low Sensitivity
Filters more aggressively and focuses on stronger volume conditions.
This allows traders to control how aggressively the Order Block engine responds to changes in tick-volume activity.
The Order Block engine can also be switched between multiple timeframes directly from the chart.
Available selections:
- Current
- M5
- M15
- H1
This allows a trader to use a lower timeframe chart for execution while referencing higher-timeframe volume structures.
On-Chart Control System
Breakout Bands is designed to minimize the need to constantly open the indicator settings window. Five on-chart controls provide quick access to the primary functions.
Button 1 — Breakout Bands
Turn the adaptive band structure ON/OFF.
Button 2 — Candles
Turn the special candle coloring ON/OFF.
When enabled, candles within the band structure can be visually differentiated to help identify changing market conditions.
Button 3 — Order Blocks
Turn the Volume Order Block engine ON/OFF.
Order Blocks are OFF by default to keep the primary chart clean.
Button 4 — Volume Sensitivity
Cycle through the Order Block sensitivity settings:
1 → 3 → 5
This controls how sensitive the volume-based calculations are.
Button 5 — Order Block Timeframe
Cycle through:
Current → M5 → M15 → H1
This allows higher-timeframe Order Block analysis without changing the trader's active chart timeframe.
Suggested Trading Workflow
A basic workflow for using Breakout Bands is:
1. Select an M1–M5 chart
The indicator is designed specifically for these timeframes.
2. Observe the band structure
Allow the adaptive bands to establish the current volatility environment.
3. Watch for a breakout
Look for price to move beyond the established band structure.
4. Wait for the retracement
Rather than immediately chasing the breakout, watch for price to retrace toward the relevant inner or outer band.
5. Evaluate the reaction
Look for rejection, continuation, momentum, or other price-action confirmation around the band.
6. Optionally enable Order Blocks
Use the Volume Order Block engine as an additional layer of market-activity information.
7. Consider higher-timeframe Order Blocks
Switch the Order Block timeframe to M5, M15 or H1 when additional context is desired.
What Makes Breakout Bands Different?
Most traditional volatility indicators simply tell traders whether price is relatively high or low compared with a moving average. Breakout Bands takes a different approach. It combines:
Adaptive Volatility
EMA-Based Market Structure
Breakout/Retest Analysis
Tick-Volume Order Blocks
Multi-Timeframe Context
into a single lightweight scalping tool.
The result is a chart structure designed to answer a practical question:
Where is price relative to the current volatility structure, and what happens when price returns to that structure after a breakout?
Key Features
✅ Designed specifically for M1–M5
✅ Adaptive ATR-based volatility bands
✅ 89 EMA-based reference structure
✅ Sequential EMA smoothing — not traditional DEMA
✅ Inner and outer band levels
✅ Designed for breakout/retest analysis
✅ Optional candle-state visualization
✅ Volume-based Order Block engine
✅ Tick-volume analysis
✅ HMA-based volume calculations
✅ Estimated Buy/Sell pressure percentages
✅ 3 volume sensitivity levels
✅ Current / M5 / M15 / H1 Order Block timeframes
✅ On-chart button controls
✅ Minimal external inputs
✅ Order Blocks OFF by default
✅ No complicated optimization required
Important Disclaimer
Breakout Bands is an analytical and visualization tool. It does not guarantee profitable trades and does not predict future price movements. Traders should use Breakout Bands together with their own risk-management rules, market analysis and trade confirmation. No indicator can eliminate trading risk.