Previous High Low MT5

Previous High Low MTF

Multi-Timeframe Previous High & Low Levels

Previous High Low MTF is a simple and practical MT5 indicator that automatically displays the High and Low of the previous candle from selected timeframes directly on your chart.

Previous High and Low levels are commonly used as important support and resistance zones, breakout levels and reference points for intraday and swing trading.

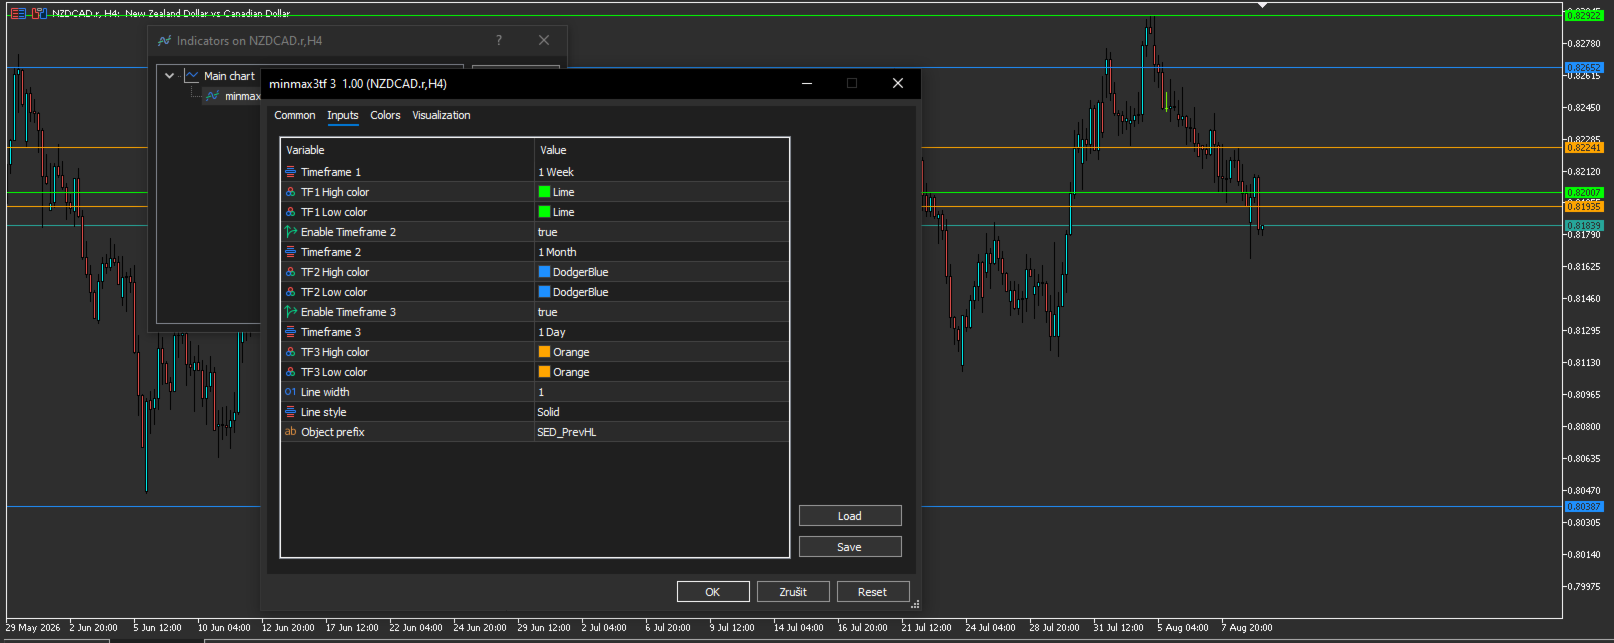
The indicator supports up to 3 independent timeframes, allowing you to display only the levels you need.

⚙️ Main Features

✅ Displays the previous candle High and Low directly on the chart
✅ Supports up to 3 different timeframes
✅ Can be configured to use 1, 2 or 3 timeframes
✅ TF2 and TF3 can be enabled or disabled independently
✅ Custom High and Low colors for each timeframe
✅ Adjustable line width and line style
✅ Levels update automatically when a new candle starts
✅ Works with all symbols and chart timeframes
✅ Clean and simple chart visualization
✅ No external indicators or dependencies required

📊 Example Setup

A typical configuration can be:

TF1 – Daily (D1)
Previous Daily High / Low

TF2 – Weekly (W1)
Previous Weekly High / Low

TF3 – Monthly (MN1)
Previous Monthly High / Low

You can also disable TF2 and TF3 and use the indicator only for a single timeframe.

🎯 How to Use

Previous High and Low levels can help identify important areas where price may react.

They can be used for:

  • Support and resistance analysis
  • Breakout trading
  • Reversal setups
  • Intraday trading
  • Swing trading
  • Take Profit and Stop Loss reference levels

The indicator automatically recalculates and updates the levels based on the selected timeframes.

⚙️ Inputs

Timeframe 1 – Primary timeframe, always active
Timeframe 2 – Optional second timeframe
Timeframe 3 – Optional third timeframe
Enable Timeframe 2 – Show or hide TF2 levels
Enable Timeframe 3 – Show or hide TF3 levels
High Color – Color of the previous High level
Low Color – Color of the previous Low level
Line Width – Width of displayed lines
Line Style – Style of displayed lines

💡 Simple Multi-Timeframe Level Analysis

Instead of manually drawing previous Daily, Weekly or Monthly High and Low levels, Previous High Low MTF automatically keeps these important price levels updated on your chart.

A simple tool for traders who want a clear multi-timeframe view of important market levels without unnecessary chart clutter.

Другие продукты этого автора
MT5 EMA Trend Indicator Smart trend indicator that uses three EMAs to identify clear market direction. Description: The   Triple EMA Trend Detector   is a powerful yet simple indicator for MetaTrader 5 that defines the current market trend using three Exponential Moving Averages (EMA).  It shows you visually when the trend is   UP ,   DOWN , or   NEUTRAL   directly on the chart — no guesswork. When the fast EMA crosses above the medium and both stay above the slow EMA, the indicator signals an
FREE
All-in-One Dashboard for Trend, Momentum & Volatility Indicators Info Panel is a compact yet powerful MT5 tool that summarizes the most important market metrics directly on your chart. It reads built-in MT5 indicators (no custom calculations) and displays real-time data about trend strength, volatility, momentum and multi-timeframe direction — all in one clean panel. Ideal for traders who want a fast overview of market conditions without opening multiple sub-windows. ️ Main Features Display
FREE
Doji Hammer Scanner MT5 Multi-Symbol Doji & Hammer Candlestick Scanner with Clickable Chart Navigation Doji Hammer Scanner is a simple MT5 indicator that automatically scans multiple symbols and detects Doji and Hammer candlestick patterns on the last closed candle. Instead of manually switching between charts, the scanner checks all configured symbols and displays detected patterns directly on the chart. Main Features Multi-symbol candlestick scanning Detects Doji patterns Detects Lower H
FREE
Main Features Calculates average values over a defined number of candles: Average volume Average close price Average candle range Average bullish and bearish candle size Displays current and previous candle statistics (Open, Close, Range, Volume). Provides an instant market summary without opening additional indicator windows. Works on any symbol and any timeframe . ️ Inputs BarsToCheck – number of candles to analyze. TextColor – color of the displayed text. FontSize – text size. (Demo only) D
FREE
Description (English) TrendStreaks Indicator — Analyze Consecutive Bullish and Bearish Runs The   TrendStreaks   indicator provides a clear statistical overview of bullish and bearish streaks in market trends. It automatically analyzes daily and weekly price data to identify how long uptrends or downtrends typically last, how strong they are, and what their average and maximum moves are (in pips and percent). Detects and counts all   bullish   and   bearish streaks   (series of consecutive up o
FREE
RSI 2-Level Scanner MT5 Multi-Symbol RSI Reversal Scanner with Clickable Chart Navigation RSI 2-Level Scanner is a practical MetaTrader 5 tool for monitoring multiple symbols at the same time and detecting potential RSI reversal setups. Unlike a standard RSI scanner that only shows overbought or oversold values, this indicator uses a two-level confirmation system . For a LONG setup, the scanner first waits until RSI reaches the lower ARM level. After that, it waits for RSI to recover above the T
FREE
Фильтр:
Нет отзывов
Ответ на отзыв