Previous High Low MT5
- インディケータ
- バージョン: 1.0

Multi-Timeframe Previous High & Low Levels
Previous High Low MTF is a simple and practical MT5 indicator that automatically displays the High and Low of the previous candle from selected timeframes directly on your chart.
Previous High and Low levels are commonly used as important support and resistance zones, breakout levels and reference points for intraday and swing trading.
The indicator supports up to 3 independent timeframes, allowing you to display only the levels you need.
⚙️ Main Features
✅ Displays the previous candle High and Low directly on the chart
✅ Supports up to 3 different timeframes
✅ Can be configured to use 1, 2 or 3 timeframes
✅ TF2 and TF3 can be enabled or disabled independently
✅ Custom High and Low colors for each timeframe
✅ Adjustable line width and line style
✅ Levels update automatically when a new candle starts
✅ Works with all symbols and chart timeframes
✅ Clean and simple chart visualization
✅ No external indicators or dependencies required
📊 Example Setup
A typical configuration can be:
TF1 – Daily (D1)
Previous Daily High / Low
TF2 – Weekly (W1)
Previous Weekly High / Low
TF3 – Monthly (MN1)
Previous Monthly High / Low
You can also disable TF2 and TF3 and use the indicator only for a single timeframe.
🎯 How to Use
Previous High and Low levels can help identify important areas where price may react.
They can be used for:
- Support and resistance analysis
- Breakout trading
- Reversal setups
- Intraday trading
- Swing trading
- Take Profit and Stop Loss reference levels
The indicator automatically recalculates and updates the levels based on the selected timeframes.
⚙️ Inputs
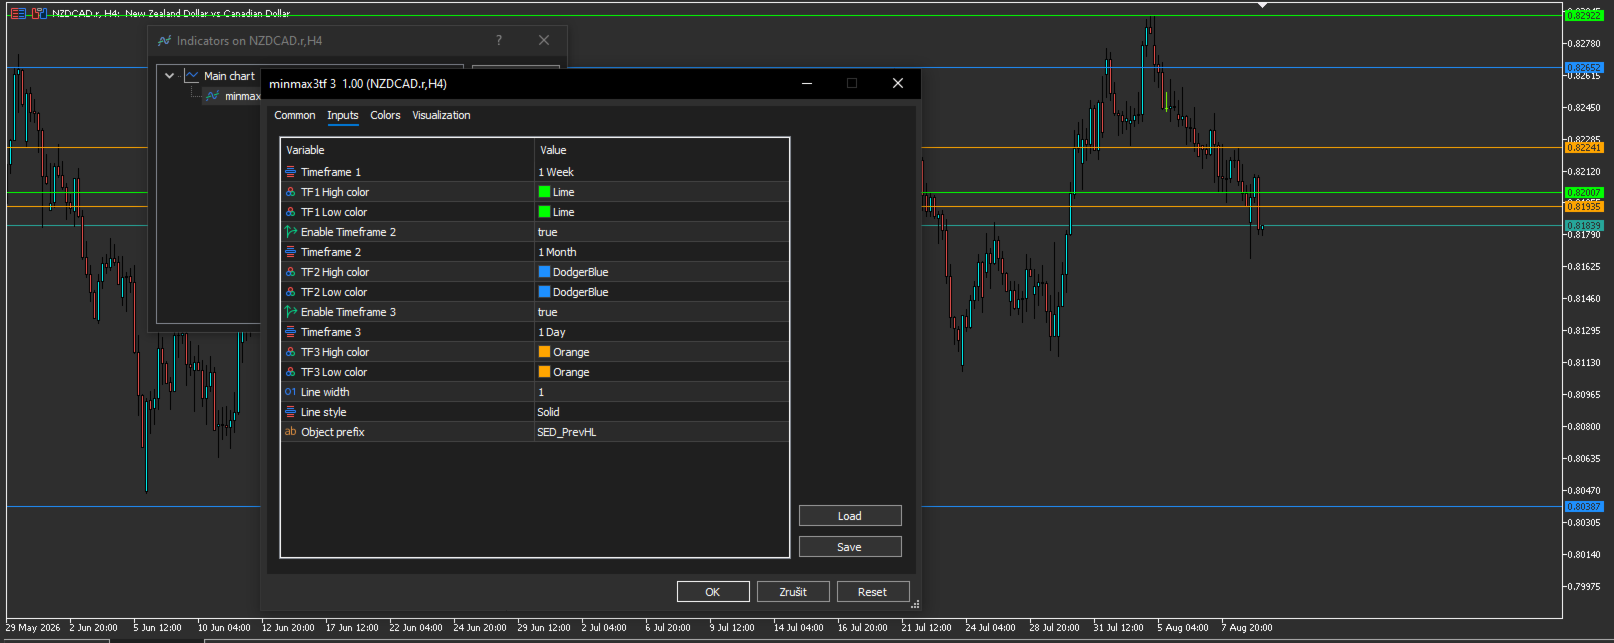
Timeframe 1 – Primary timeframe, always active
Timeframe 2 – Optional second timeframe
Timeframe 3 – Optional third timeframe
Enable Timeframe 2 – Show or hide TF2 levels
Enable Timeframe 3 – Show or hide TF3 levels
High Color – Color of the previous High level
Low Color – Color of the previous Low level
Line Width – Width of displayed lines
Line Style – Style of displayed lines
💡 Simple Multi-Timeframe Level Analysis
Instead of manually drawing previous Daily, Weekly or Monthly High and Low levels, Previous High Low MTF automatically keeps these important price levels updated on your chart.
A simple tool for traders who want a clear multi-timeframe view of important market levels without unnecessary chart clutter.