Spike Distribution Analyzer

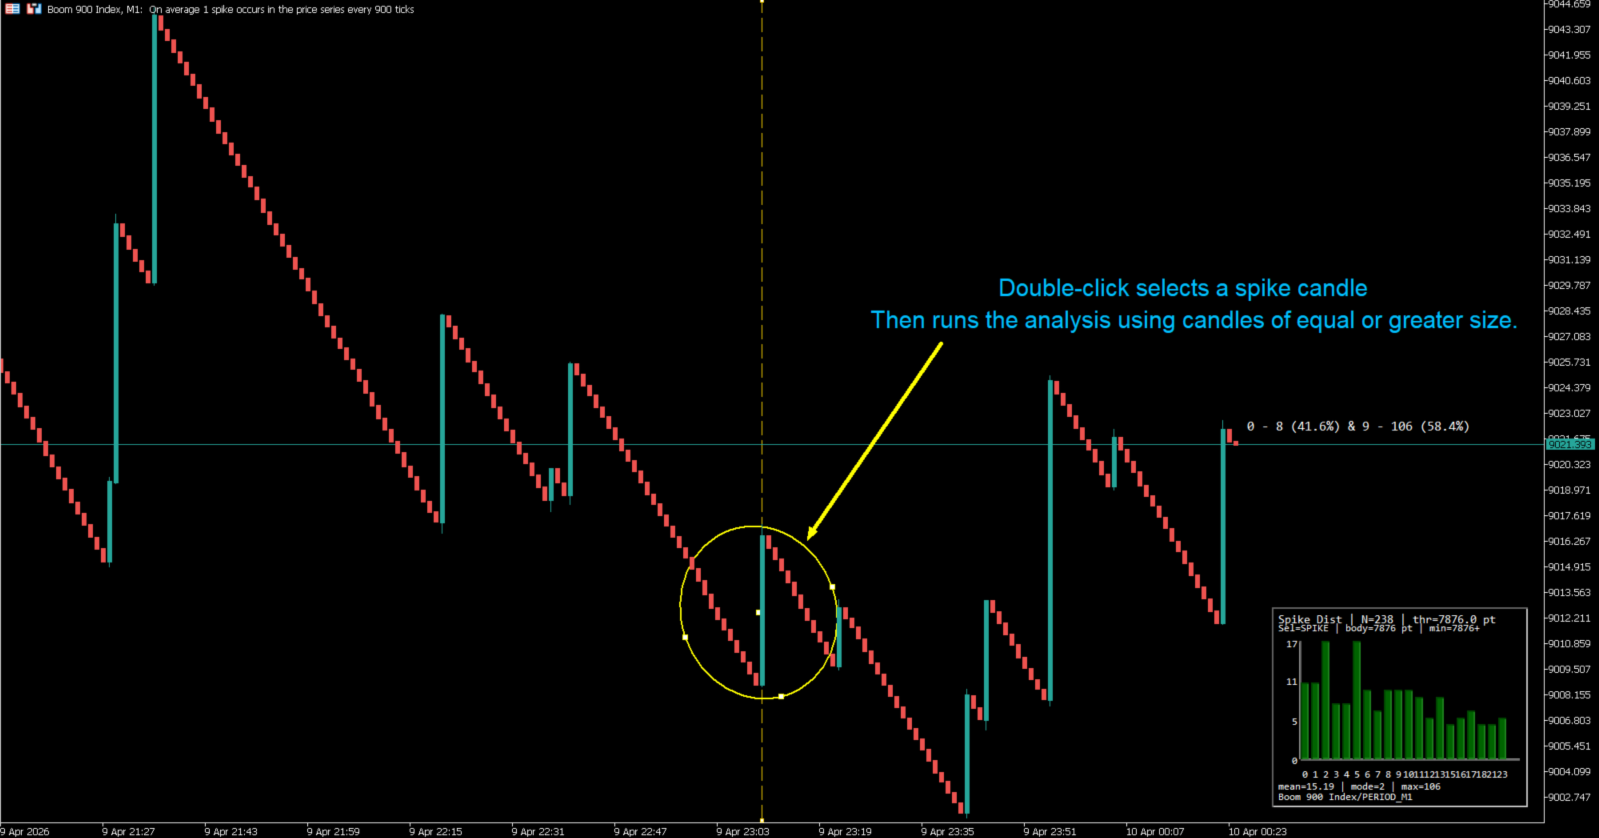
Spike Distribution Analyzer is a visual statistical indicator for MetaTrader 5 designed to study how spikes are distributed after sequences of trend candles. Instead of focusing on entry signals, it summarizes the structure between spikes and trend continuation in a clear visual format. The indicator can display a floating text summary, a graphic panel, or both, depending on the selected display mode.

The main purpose of the indicator is to help the trader understand how often a spike appears after a certain number of trend candles. It analyzes historical candles, identifies spike candles according to the selected threshold method, counts how many trend candles appear between valid spikes, and converts that information into a distribution. This makes it easier to evaluate whether the market is showing short spike cycles, extended trend sequences, or a mixed structure.

The indicator is built for synthetic instruments and other symbols that behave in a spike-like way. It supports Boom, Crash, and generic bull or bear spike structures. Auto detection is available for common naming patterns, and manual index selection is also included when the user wants to define the market context directly.

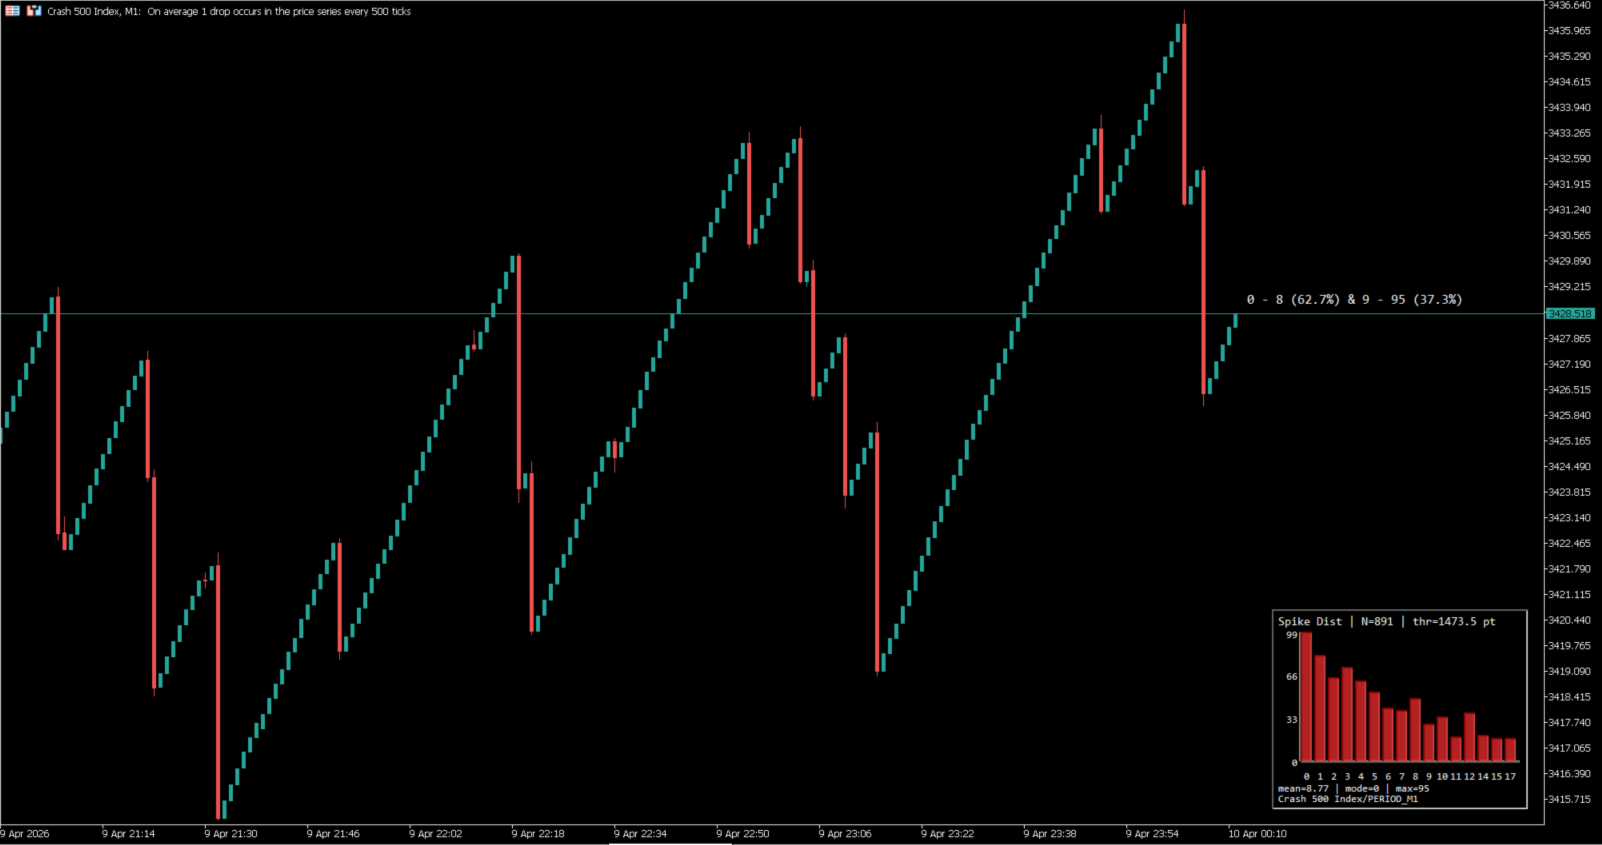
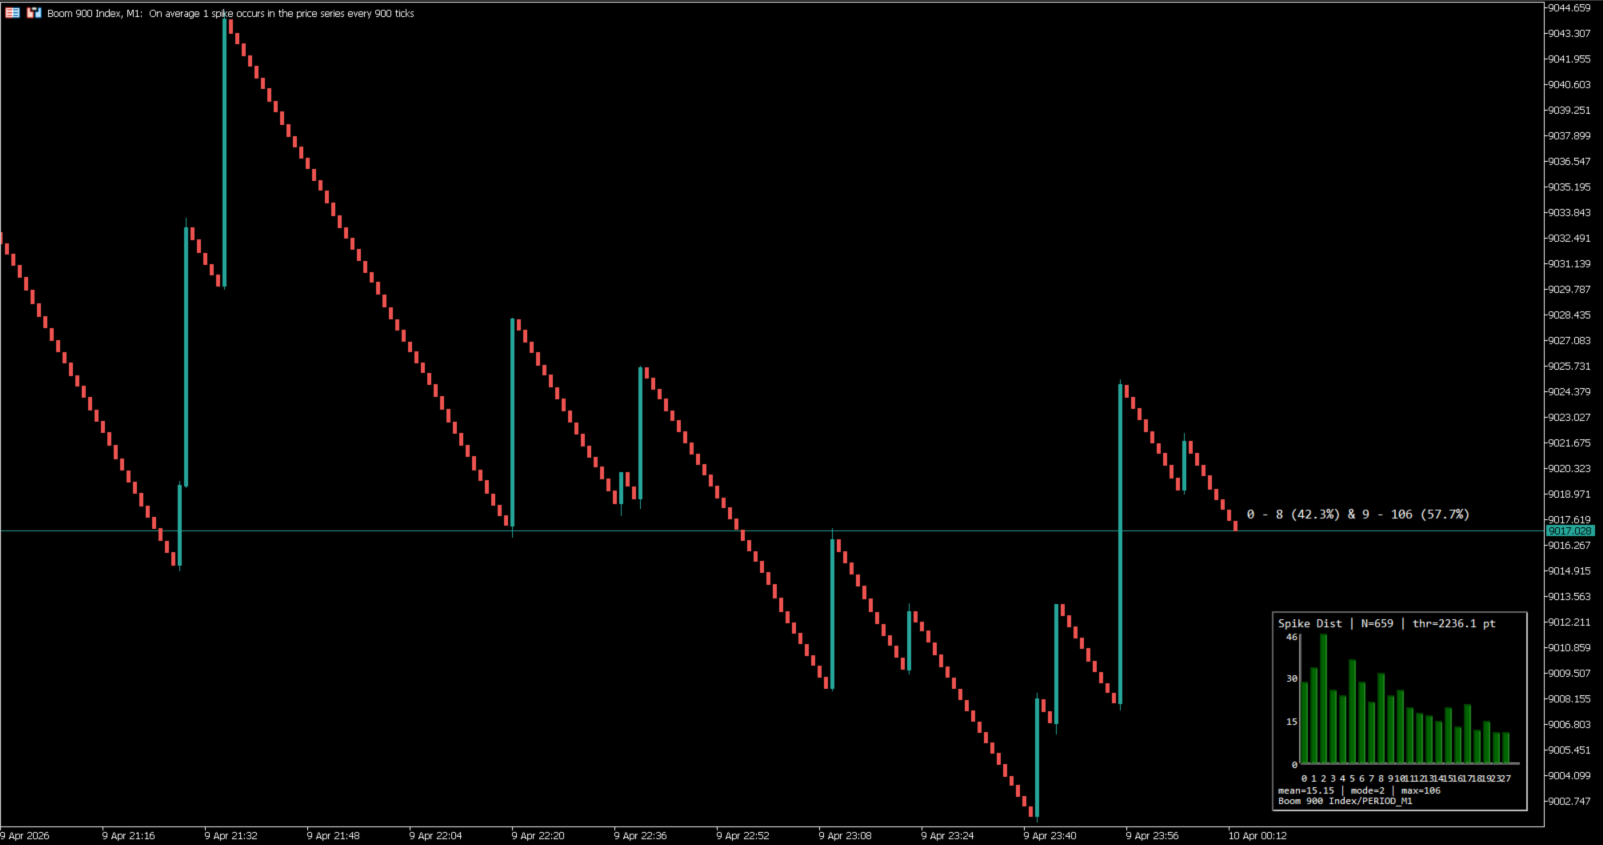
A practical feature of the indicator is its chart-friendly presentation. The floating text can provide a quick summary without filling the screen, while the graphic panel shows the filtered distribution in a more structured way. When a historical candle is selected through the anchor feature, the indicator can re-evaluate the minimum spike threshold from that candle. If the selected candle is not a spike but a trend candle, the panel shows “Not a spike” instead of drawing bars.

This indicator is intended as a decision-support and market-structure reading tool. It does not open trades, send orders, or perform automated trading actions. Its role is to organize statistical context in a visual form that can be read quickly during chart analysis.

How It Works

The indicator first loads historical bars from the selected symbol and timeframe. Then it calculates a spike threshold using one of three methods: preliminary mean body size, modal body size, or a fully manual points threshold. After that, it checks each candle body against the selected spike criteria and optionally applies a directional filter so the spike must also be opposite to the prevailing trend direction.

Once valid spikes are identified, the indicator counts how many trend candles appear between one spike and the next. Those counts are grouped into a frequency distribution. From that distribution, the indicator derives values such as weighted mean, mode, maximum observed k value, total groups, and related percentages. The panel can then plot the filtered bars of that distribution, while the floating text can summarize the percentage split between shorter and longer trend sequences.

What the Indicator Shows

Floating text summary
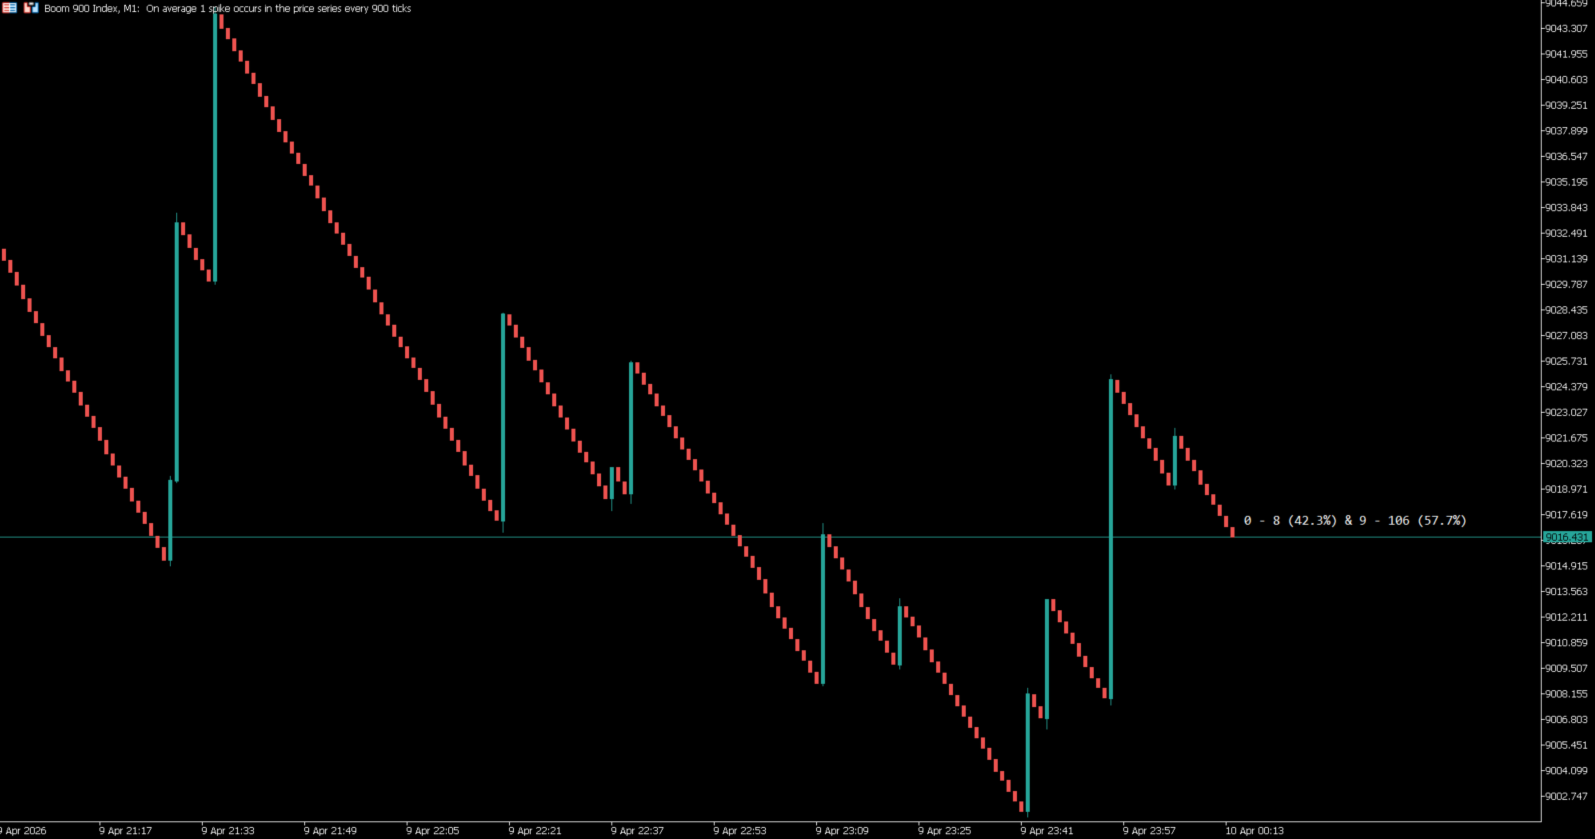
Shows a compact summary of the distribution directly on the chart. It can include the sample size, the active minimum threshold, and the percentage split between two k ranges.

Graphic panel
Shows the statistical distribution as a bar panel. Each bar represents a k value, meaning the number of trend candles found between spikes. The panel can work with absolute frequencies or percentage scale.

Anchor information
When the user selects a historical candle with the anchor, the panel subtitle reports the selected candle class, its body size, and the effective threshold used for the analysis.

Context label
If the analysis is applied to a symbol or timeframe different from the current chart, the indicator can display that external context in the visual output.

Special state for non-spike selection
If the selected anchor candle is a trend candle and not a spike, the graphic panel does not draw bars and shows the message “Not a spike”.

Practical Use

The indicator can be useful for traders who want to:

  • study how often spikes appear after sequences of trend candles;
  • compare short trend-to-spike cycles against longer ones;
  • evaluate whether the current market structure is compressed or extended;
  • review historical candles and re-check the distribution from a selected spike reference;
  • keep the chart cleaner by using text mode, panel mode, or both.

Main Features

  • Statistical analysis of spike distribution
  • Floating text summary, graphic panel, or both
  • Manual or automatic market context selection
  • Three spike threshold calculation methods
  • Optional directional spike filter
  • Historical anchor selection by double click
  • Special handling for non-spike selected candles
  • Symbol and timeframe analysis support
  • Percentage scale or frequency scale in the panel
  • Visual output designed for fast reading on chart

Input Parameters

Data and Analysis Scope

InpSymbol – symbol to analyze. Leave empty to use the current chart symbol.
InpTimeframe – timeframe used for the analysis.
InpBars – number of historical bars loaded for the statistical calculation.

Spike Detection

InpSpikeMethod – method used to define the spike threshold.
InpSpikeDirectionMode – defines whether spikes are detected by body size only or by body size plus opposite direction to trend.
InpManualSpikeMinPts – manual minimum body size in points when manual threshold mode is used.
InpBinPoints – bin size in points used to estimate the modal body value.
InpFallbackThrPoints – fallback threshold used if the selected automatic method cannot produce a valid result.

Market Context and Output Mode

InpIndexKind – defines the market behavior type: auto, Boom, Crash, generic bull, or generic bear.
InpDisplayMode – selects text mode, graphic mode, or both.

Floating Text Summary

InpTextSplitK – split point used to summarize distribution percentages into two k ranges.
InpTextDecimals – number of decimals used in percentage text.
InpTextOffsetX – horizontal offset of the floating text.
InpTextOffsetY – vertical offset of the floating text.
InpTextAboveCandle – places the floating text above or below the reference candle area.
InpTextColor – text color of the floating summary.
InpTextFontSize – font size used in the floating text.
InpShowSampleSize – shows or hides the number of valid groups in the text summary.

Historical Anchor Selection

InpEnableDblClickAnchor – enables anchor selection by double click on the chart.
InpDblClickMs – maximum time interval in milliseconds for double-click detection.
InpDblClickPx – maximum pixel distance between clicks for the anchor selection.
InpShowAnchorLine – shows or hides the vertical line of the selected anchor.
InpSelectedSpikeMinusPts – reduces the selected spike threshold by the specified number of points.

Graphic Panel – Data Filter

InpGraphicMaxBars – maximum number of k bars to display. Use 0 for automatic filtering.
InpGraphicAutoFilter – filter rule used when automatic bar selection is active.
InpUsePercentScale – shows panel bars in percent scale instead of raw frequency.

Graphic Panel – Position and Size

InpPanelCorner – panel corner position on chart.
InpPanelX – horizontal panel offset.
InpPanelY – vertical panel offset.
InpPanelWidth – panel width.
InpPanelHeight – panel height.

Graphic Panel – Layout

InpBarGap – space between bars.
InpBarWidthMin – minimum width of each panel bar.
InpPanelBottomPad – bottom padding of the panel.
InpXAxisLabelPad – padding used for X-axis labels.
InpFooterTextPad – vertical spacing before the footer text.
InpFooterSymbol – spacing between the first and second footer lines.
InpYAxisLabelOffsetX – horizontal offset of Y-axis labels.
InpXAxisLabelOffsetY – vertical offset of X-axis labels.

Graphic Panel – Colors

InpPanelBgColor – background color of the panel.
InpBarColor – color of the distribution bars.
InpAxisColor – color of the panel axes.
InpLabelColor – color of the panel labels.

Notes

This indicator is designed to organize spike statistics in a visual and structured format. It does not predict future prices and does not execute trades. It is intended to help the trader read market structure with less visual noise and with clearer statistical context.
Рекомендуем также
SPECIAL LAUNCH OFFER: $30 (1-Month Rent) Limited time offer to build our community and gather feedback! AmbM GOLD Institutional Scalper A high-precision M5 algorithm for XAUUSD (Gold) , engineered to trade exclusively at Institutional Liquidity Levels ($5/$10 psychological marks). PERFORMANCE DATA (BUY ONLY) • Win Rate: 87.09%. • Safe Growth: +$4,113 profit on $10k (13.75% Max Drawdown). • Extreme Stress Test: Successfully generated +$22,997 in a 5-year stress test (2020-2026), proving
Supply and Demand Indicator + FREE Currency Strength Meter ADD-ON Looking for a powerful tool that can help you identify the most reactive zones in the forex market? Our supply and demand indicator for MetaTrader 4 and 5 is exactly what you need. With its advanced algorithms and real-time analysis, this indicator helps traders of all experience levels make informed trading decisions. The supply and demand indicator is a cutting-edge tool that helps traders identify areas where buyers and sellers
What Is Trend Master Pro? Trend Master Pro   is a professional-grade trend trading indicator built for MetaTrader 5. It was designed with one goal in mind — to keep you on the right side of the market at all times by combining three powerful technical tools into a single, clean, easy-to-read display directly on your price chart. Instead of cluttering your screen with multiple separate indicators, Trend Master Pro fuses an   EMA Ribbon trend filter , a   ZigZag swing point engine , and a   breako
RBreaker Gold Indicators — это краткосрочная внутридневная торговая стратегия для фьючерсов на золото, которая сочетает в себе два подхода: трендовое следование и внутридневные развороты. Она позволяет не только получать прибыль при трендовом движении, но и своевременно фиксировать прибыль при развороте рынка, открывая позиции в новом направлении. Данная стратегия на протяжении 15 лет подряд входила в десятку самых прибыльных торговых стратегий по версии американского журнала Futures Truth. Она
Indicator Name: Fibaction – price action candle Detector Description: Fibo Signal Boxes is a powerful Smart Money Concept (SMC)-inspired indicator that auto-detects price action candles. bullish hammers and shooting stars, then draws precise Fibonacci entry zones and multiple take-profit levels directly on the chart. as for the SL personally i use 40 pips rules  Key Features: Detects bullish hammer and shooting star reversal candles. Automatically draws Fibonacci entry and TP boxes. as
Structure King AI Signal Structure King AI Signal is a professional MetaTrader 5 trading indicator designed to help traders analyze market structure, trend direction, multi-timeframe confirmation and trade management from one clean dashboard. Key Features • Market Structure & Trend Analysis • BUY / SELL Signals • Multi-Timeframe (HTF) Confirmation • Entry Price Levels • Dynamic Stop Loss (SL) • TP1 / TP2 / TP3 Levels • ATR Volatility Analysis • ADX Trend Strength Filter • Adaptive Market Filter
Gold Beast Pro
Marc Henning Hruschka
Gold Beast Pro MT5 Gold Beast Pro MT5 is a professional automated trading system designed specifically for XAUUSD (Gold) on MetaTrader 5. The EA is built to operate fully automatically while maintaining stable trade execution and adaptive market behavior under different market conditions. Gold Beast Pro focuses on precision execution, intelligent market participation, and controlled risk management to provide a smooth and efficient automated trading experience. The system is optimized for trader
MTF Isolator EMA
Jake Jesus Herrera Turizo
Características Principales 1. Medía Móvil Multi-Timeframe (MTF) con Estabilidad Temporal EMA Macro ( InpMATimeframe ): Permite proyectar y visualizar en el gráfico actual una Media Móvil Exponencial (EMA) calculada desde una temporalidad superior (por defecto en gráfico diario PERIOD_D1 ). Independencia de Temporalidad: Mantiene los cálculos exactos y fijos del periodo que se requiera (la temporalidad macro seleccionada) sin que estos se modifiquen, distorsionen o recalibren indebidamente al
FREE
Индикатор подчёркивает те моменты, которые профессиональный трейдер видит в обычных индикаторах. VisualVol визуально отображает разные показатели волатильности в единой шкале и общем масштабе. Подчёркивает цветом превышение показателей объёма. Одновременно могут быть отображены Тиковый и Реальный Объем, Действительный диапазон, ATR, размер свечи и ретурнс (разница open-close). Благодаря VisualVol вы увидите рыночные периоды и подходящее время для разных торговых операций. Индикатор отображает: т
VELOS Trading Indicator Precision. Speed. Confidence. The VELOS Trading Indicator is a professional, non-repainting MT5 trading system developed by DC Trading to help traders identify high-probability trading opportunities with confidence. Designed for both beginner and experienced traders, VELOS combines trend analysis, momentum confirmation, and volatility filtering into one intelligent indicator, delivering precise entry and exit signals while reducing false setups. Built for fast-moving m
Индикатор Shved Supply and Demand Cluster Profile является  частью экосистемы анализа рынка Shved Market Analysis System (SMAS). Определяет области максимальной плотности и совпадения зон спроса и предложения, обеспечивая более глубокое понимание рынка как часть единой экосистемы SMAS. Shved Supply and Demand Cluster Profile — это революционный многофункциональный инструмент визуализации рыночных объемов и плотности зон спроса и предложения, созданный профессиональным трейдером для трейдеров.
GOLD FIBONACCI SNIPER M5 Описание GOLD FIBONACCI SNIPER M5 — это профессиональный индикатор для MetaTrader 5, специально разработанный для торговли XAUUSD (Gold) на таймфрейме M5. Индикатор использует уровни коррекции Fibonacci в сочетании с анализом тренда, волатильности, свечных моделей и силы движения рынка для поиска высокоточных точек входа. Система автоматически определяет зоны коррекции между уровнями Fibonacci 38.2, 50 и 61.8, которые считаются важными институциональными уровнями реакции
Heiken_Ashi_Bars - Усовершенствованный визуализатор тренда для MT5 Обзор Heiken_Ashi_Bars — это мощный, визуально интуитивный пользовательский индикатор, разработанный для фильтрации рыночного шума и выделения истинного базового тренда. Традиционные свечные графики часто бывают хаотичными, что приводит к ложным сигналам и преждевременным выходам. Усредняя ценовые данные, этот индикатор сглаживает движение цены, что значительно облегчает обнаружение продолжения тренда, разворотов и прибыльных зо
Liquidity Order Blocks MT5 Liquidity Order Blocks MT5 is a professional visual indicator for MetaTrader 5 designed to help traders identify and monitor potential bullish and bearish liquidity areas directly on the chart. The indicator detects pivot-based order block zones and displays each zone with a structured visual breakdown of estimated bullish volume, bearish volume, relative strength and delta. Its purpose is to make liquidity areas easier to read, compare and monitor during market analys
X Edge
Ashok Kumar Singha
X-EDGE — Multi-Mode Market Analysis Indicator X-EDGE is a multi-mode MT5 indicator designed to help traders identify potential market direction, entry opportunities and important price areas through a clean, structured chart interface. X-EDGE brings multiple analytical components together in one indicator, allowing traders to study price behaviour without having to switch between several separate tools. Six Signal Modes X-EDGE provides six independent signal modes designed for different market c
Продвинутый пользовательский индикатор Crypto_Forex "Adaptive Flow Oscillator" — эффективный вспомогательный торговый инструмент для MT5!   No repaint! — Этот индикатор относится к новому поколению осцилляторов. — "Adaptive Flow Oscillator" имеет настраиваемые адаптивные зоны перепроданности/перекупленности. — Индикатор использует в расчётах как данные о цене, так и об объёме. — Осциллятор — вспомогательный инструмент для поиска точных точек входа в зонах перепроданности/перекупленности. — Адап
Cycle Projection Pro is a cyclical analysis indicator for MetaTrader 5, designed for the Daily timeframe. It identifies and projects recurring price cycles forward in time, helping you estimate when — not how much — the market may be approaching a turning point. How it works The indicator sums six harmonic cycles with explicit periods — Weekly, Biweekly, Monthly, Quarterly, Semiannual, Annual — each independently adjustable and can be turned on or off. Their combination produces a composite wav
A powerful oscillator that provide Buy and Sell signals by calculating the investor liquidity. The more liquidity the more buy possibilities. The less liquidity the more sell possibilities. Please download the demo and run a backtest! HOW IT WORKS: The oscillator will put buy and sell arrow on the chart in runtime only . Top value is 95 to 100 -> Investors are ready to buy and you should follow. Bottom value is 5 to 0 -> Investors are ready to sell and you should follow. Alert + sound will appe
Directional Trend Cascade Directional Trend Cascade is a visual trend-following indicator for MetaTrader 5 designed to make market direction and potential trading opportunities easier to identify directly on the chart. The indicator analyzes the alignment of six exponential moving averages and displays them as a coordinated trend cascade. When a new directional alignment is confirmed, the system marks it with a BUY or SELL signal. How It Works A bullish trend is identified when the moving averag
English: Indicator Description Name:   ZigZag Multi-Timeframe (ASTRA TREND) Description:   This MetaTrader 5 indicator displays   three independent ZigZag layers   from different timeframes on a single chart. It is an essential tool for multi-timeframe analysis, allowing traders to visualize the trend hierarchy (e.g., M15, H1, and H4) simultaneously. Key Features: Dual Logic:   Offers two methods for pivot detection:   Classic   (Depth/Deviation/Backstep) or   Parabolic SAR   reversal logi
FREE
Автоматизируйте торговлю по пробоям ACB ACB Breakout Arrows EA анализирует пробойные сигналы на текущем графике и управляет сделками с помощью встроенной логики ACB Breakout Arrows и ACB Trade Filter. Установите советник на символ и таймфрейм, которые хотите отслеживать, разрешите автоматическую торговлю, затем выберите правила для объема позиции, сессий, фильтров и выходов в соответствии с вашим планом тестирования. Необходимые индикаторы и зависимости уже встроены в советник, поэтому отдельная
Smart TP SL Signals is a professional, institutional-grade execution and visualization indicator designed for MetaTrader 5. Built on proven Smart Money Concepts (SMC) and ICT market structure principles , this tool automatically identifies high-probability entry levels and projects clean, dynamic Risk-to-Reward targets directly onto your chart in real time. No more guessing where to enter, where to place your stop loss, or when to take profits. The indicator handles all price projection calculat
FREE
This indicator builds a Pivot Anchored Volume Profile (VAP/VPOC approximation using tick volume) and automatically splits the profile into pivot-to-pivot segments , giving you a clean, TradingView-like view of where volume concentrated during each swing. It draws a horizontal histogram for every segment and highlights the Value Area and key levels, making it easy to spot acceptance/rejection zones, high-volume nodes, and potential support/resistance. Key Features Segmented Volume Profile (Pivot-
Unlock the Market's Hidden Blueprint with Advanced Pattern Recognizer Tired of staring at charts, struggling to spot high-probability trading opportunities? What if you had a professional analyst scanning the markets 24/7, drawing perfect trendlines, and calculating precise profit targets for you? Introducing Advanced Pattern Recognizer for MetaTrader 5 – Your Automated Technical Analysis Powerhouse. This isn't just another indicator. It's a sophisticated algorithmic engine designed to do the he
WBS SMC Without Repaint – Ultimate XAUUSD Scalping Engine (M5 Timeframe) Take your Gold trading to the institutional level with "WBS SMC Without Repaint", a highly advanced premium indicator engineered specifically for XAUUSD (Gold) on the M5 (5-Minute) timeframe.  Built upon the core pillars of Smart Money Concepts (SMC) combined with precise algorithmic candle pattern recognition, this tool identifies high-probability institutional footprints in real-time. Best of all: 100% ABSOLUTELY
Техническое описание индикатора – Delta Profile для MetaTrader 5 Delta Profile – это индикатор, разработанный для MetaTrader 5, предназначенный для детального анализа потока объёмов в пределах заданного диапазона свечей. Он структурирует и отображает информацию о дисбалансе положительных объёмов (связанных с движением вверх) и отрицательных объёмов (связанных с движением вниз) на различных ценовых уровнях. В результате пользователь получает чёткое представление о тех участках графика, где сосред
Your Trend Friend
Luigi Nunes Labigalini
5 (1)
The trend is your friend! Look at the color of the indicator and trade on that direction. It does not  repaint. After each candle is closed, that's the color of the trend. You can focus on shorter faster trends or major trends, just test what's most suitable for the symbol and timeframe you trade. Simply change the "Length" parameter and the indicator will automatically adapt. You can also change the color, thickness and style of the lines. Download and give it a try! There are big movements w
EMA256 Fourier Cycle Trader EMA256 Fourier Cycle Trader is an advanced MetaTrader 5 Expert Advisor combining a long-term EMA or TEMA trend model, causal Fourier cycle analysis, configurable averaging and a unified basket take-profit system. The Expert Advisor is designed primarily for CENT accounts and for traders who understand basket recovery strategies, geometric lot progression and the risks associated with trading without a mandatory Stop Loss. RECOMMENDED STARTING CONFIGURATION Recommended
Noize Absorption Index - is the manual trading system that measures the difference of pressure between bears forces and bulls forces. Green line - is a noize free index that showing curent situation. Zero value of index shows totally choppy/flat market.Values above zero level shows how powerfull bullish wave is and values below zero measures bearish forces.Up arrow appears on bearish market when it's ready to reverse, dn arrow appears on weak bullish market, as a result of reverse expectation.
Royal Wave Pro M5
Vahidreza Heidar Gholami
3.5 (4)
Royal Wave is a Trend-Power oscillator which has been programmed to locate and signal low-risk entry and exit zones. Its core algorithm statistically analyzes the market and generates trading signals for overbought, oversold and low volatile areas. By using a well-designed alerting system, this indicator makes it easier to make proper decisions regarding where to enter and where to exit trades. Features Trend-Power Algorithm Low risk Entry Zones and Exit Zones Predictions for Overbought and Over
С этим продуктом покупают
Trend Sniper X
Sarvarbek Abduvoxobov
4.86 (42)
Trend Sniper X — это трендовый индикатор для MetaTrader 5, работающий на нескольких таймфреймах, который помогает трейдерам точно и ясно определять направление тренда и потенциальные точки разворота. для MT4: https://www.mql5.com/en/market/product/193245 Информация о цене: Текущая цена является промо-ценой и может измениться по мере выхода предстоящих обновлений и новых функций. Бонусное предложение: Чтобы получить БЕСПЛАТНЫЙ авто-трейд советник Assistant EA для этого индикатора, пожалуйста, на
Smart Trend Trading System — MetaTrader 5 После покупки напишите мне на MQL5, чтобы БЕСПЛАТНО получить Smart Universal Expert Advisor, а также доступ к онлайн-курсу, руководство в формате PDF и доступ к закрытой группе. STTS объединяет направление тренда, сигналы входа и выхода, зоны разворота и важные ценовые уровни прямо на графике. Торгуйте по системе вручную или подключите отдельный совместимый советник для автоматического исполнения с выбранными вами настройками. ОДНА СИСТЕМА. ЧЕТЫРЕ ТОРГОВ
SuperScalp Pro
Van Minh Nguyen
4.56 (36)
SuperScalp Pro - Professional Multi-Layer Confluence Scalping System SuperScalp Pro — это продвинутый индикатор для скальпинга, который улучшает классический Supertrend с помощью нескольких интеллектуальных фильтров подтверждения. Он помогает определять торговые возможности Buy/Sell с более высокой вероятностью, значительно сокращая количество ложных сигналов. Чёткие стрелки Buy и Sell отображаются непосредственно на графике, а уровни Stop Loss и Take Profit на основе ATR автоматически рассчитыв
Новый король в городе — Индикатор + управление ордерами (TP1 + TP2 + TP3) + опциональный Telegram-сигнал-сендер ВКЛЮЧЁН (БЕСПЛАТНО) (ПОЛНОЦЕННАЯ ТОРГОВАЯ И СИГНАЛЬНАЯ СИСТЕМА) Gold Slayer EA Этот индикатор включает в себя продвинутую стратегию, торговую систему с настраиваемым управлением ордерами и систему mean reversion, которая сочетает расширения Envelope и поддерживается несколькими интеллектуальными фильтрами подтверждения, такими как RSI, для поиска высоковероятных точек разворота с сигн
Boba Analysis Suite
Trade Ready Solutions LLC
5 (1)
Boba Analysis Suite Boba Analysis Suite — аналитический индикатор для MetaTrader 5. Он объединяет структуру рынка, значимые ценовые зоны и общий рыночный контекст в одном представлении на графике. Индикатор разработан на основе практического опыта трейдера и наставника по трейдингу. Он помогает выстроить последовательный процесс анализа: оценивать направление рынка, определять важные уровни и рассматривать несколько таймфреймов в совокупности. Анализ с учётом контекста Значение отдельных сигнало
Auto Optimized SpeedAngle — это система векторизации импульса институционального уровня, которая исключает подгонку под исторические данные (curve-fitting) за счет непрерывной форвард-оптимизации (Walk-Forward Optimization, WFO). Вместо того чтобы полагаться на статические входные параметры, которые теряют эффективность при смене рыночных режимов, индикатор динамически перекалибрует свои настройки, используя валидацию на вневыборочных данных (Out-of-Sample, OOS). Это гарантирует, что отображаемы
Entry Points Pro — топ-1 индикатор по количеству отзывов (600 отзывов и 31 000 скачиваний обеих версий). Индикатор даёт самые перспективные точки входа в сделки без перерисовки на любых инструментах. Индикатор покажет заранее стрелкой точку входа в сделку, укажет цену входа и нарисует на графике уровень входа и стопа, а так же рассчитает рабочий лот под твой депозит и риск, а панель статистики поможет выбрать самый перспективный инструмент и таймфрейм .  Тебе остаётся поставить отложенный ордер
ARIPoint
Temirlan Kdyrkhan
1 (4)
ARIBot is a powerful trading companion designed to generate high-probability entry signals with dynamic TP/SL/DP levels based on volatility. Built-in performance tracking shows win/loss stats, PP1/PP2 hits, and success rates — all updated live. Key Features: Buy/Sell signals with adaptive volatility bands Real-time TP/SL/DP levels based on ATR Built-in MA Filter with optional ATR/StdDev volatility Performance stats panel (Success, Profit/Loss, PP1/PP2) Alerts via popup, sound, push, or email Cus
Gann Made Easy   - это профессиональная, но при этом очень простая в применении Форекс система, основанная на лучших принципах торговли по методам господина У.Д. Ганна. Индикатор дает точные BUY/SELL сигналы, включающие в себя уровни Stop Loss и Take Profit. ПОЖАЛУЙСТА, СВЯЖИТЕСЬ СО МНОЙ ПОСЛЕ ПОКУПКИ, ЧТОБЫ ПОЛУЧИТЬ ТОРГОВЫЕ ИНСТРУКЦИИ И ОТЛИЧНЫЕ ДОПОЛНИТЕЛЬНЫЕ ИНДИКАТОРЫ БЕСПЛАТНО! Вероятно вы уже не раз слышали о торговли по методам Ганна. Как правило теория Ганна отпугивает от себя не только
M1 SNIPER   — это простая в использовании торговая система. Это стрелочный индикатор, разработанный для тайм фрейма M1. Индикатор можно использовать как отдельную систему для скальпинга на тайм фрейме M1, а также как часть вашей существующей торговой системы. Хотя эта торговая система была разработана специально для торговли на M1, ее можно использовать и с другими тайм фреймами. Первоначально я разработал этот метод для торговли XAUUSD и BTCUSD. Но я считаю этот метод полезным и для торговли на
Adaptive Price Action Engine Купи индикатор — получи советник (EA) к нему бесплатно Самооптимизирующийся мульти-таймфреймовый анализ тренда и свечных моделей Рынок постоянно меняется — и не каждая модель Price Action имеет одинаковую ценность в разных рыночных режимах. Adaptive Price Action Engine создан для адаптации к изменяющимся рыночным условиям, объединяя трендовую структуру, мульти-таймфреймовый анализ, свечные модели и статистическую оптимизацию в единой аналитической системе. Два адапти
FiboSniper Pro – Multi-Filter Fibonacci System with Auto SL/TP and Control Panel FiboSniper Pro — это технический индикатор, который объединяет динамические Fibonacci Envelopes с несколькими фильтрами подтверждения для формирования отборных сигналов Buy и Sell. Уровни Fibonacci рассчитываются на основе Moving Average и ATR, а затем фильтруются с помощью ADX, EMA, RSI, ATR, Volume, Time и структуры свечи. Индикатор отображает на графике автоматические уровни Stop Loss и Take Profit на основе ATR,
Break and Retest Hunter is a powerful MetaTrader 5 indicator designed to automatically identify support and resistance levels, breakout structures, and potential retest opportunities in real time. Bonus Indicator: After purchasing Break and Retest Hunter , contact me to receive Trade Indicator Assistant EA completely free as a bonus utility. $65 for the next 10 copies . Next price is $120.  Combining adaptive market analysis, clear BUY/SELL signals, Fibonacci-based profit targets, and a premiu
Neuro Poseidon - новый индикатор от Дарьи Резуевой. Он сочетает точные торговые сигналы с адаптивными уровнями TP/SL , в результате создавая максимально выгодные сделки! TO SWITCH TO   ENG   PLEASE CHOOSE IT IN THE UPPER-RIGHT CORNER OF THE WEBSITE Напишите мне и получите  Neuro Poseidon Assistant  в подарок для автоматизации вашей торговли! Что отличает его от других индикаторов? 1. Доказанная прибыльность на всех активах и таймфреймах 2. На графике присутствуют только подтвержденные сигналы н
Apex Patterns PRO Купите индикатор — получите Expert Advisor на его основе БЕСПЛАТНО. Самооптимизирующаяся система анализа графических паттернов и пробоев Традиционные сканеры паттернов полагаются на фиксированные входные параметры, что часто приводит к снижению их эффективности при изменении рыночной волатильности и структуры. Apex Patterns PRO разработан для адаптации к меняющимся рыночным условиям, объединяя распознавание структурных графических паттернов, фильтрацию по моментуму и статистич
Entry In The Zone and SMC Multi Timeframe is a real-time market analysis tool based on Smart Money Concepts (SMC), designed to analyze market structure, price direction, and key trading zones. It supports both Single-Timeframe and Multi-Timeframe Analysis, providing a clearer view of overall market structure across multiple timeframes, with real-time BUY / SELL signals designed with a strict focus on No-Repaint principles. The signals are designed to help filter unclear setups and evaluate tradi
Trend Catcher   анализирует движения рыночных цен, используя комбинацию собственных и индивидуально разработанных адаптивных индикаторов анализа тренда. Он определяет истинное направление рынка, отфильтровывая краткосрочные шумы и фокусируясь на силе импульса, расширении волатильности и поведении ценовой структуры. Он также использует комбинацию сглаживающих и фильтрующих тренд индикаторов, таких как скользящие средние, RSI и фильтры волатильности. Мониторинг реальных операций, а также другие
Unix Scalper — MetaTrader 5 После покупки напишите мне на MQL5, чтобы БЕСПЛАТНО получить Smart Universal Expert Advisor, а также доступ к онлайн-курсу, руководство в формате PDF и доступ к закрытой группе. Найдите торговую ситуацию. Оцените план. Выберите способ торговли. UNIX Scalper объединяет анализ рынка, решения BUY/SELL/WAIT и уровни Entry, Stop Loss, TP1 и TP2 в одной удобной панели. УВИДЬТЕ СИГНАЛ И ТОРГОВЫЙ ПЛАН • Понятные решения: BUY, SELL или WAIT. • Определённые уровни: Entry, Stop
FX Trend NG: Следующее поколение интеллектуального анализа трендов на разных рынках Обзор FX Trend NG — это профессиональный инструмент анализа трендов и мониторинга рынка с поддержкой нескольких таймфреймов. Он позволяет за секунды получить полное структурное понимание текущего состояния рынка. Вместо переключения между десятками графиков вы мгновенно видите, какие инструменты находятся в тренде, где импульс ослабевает и где наблюдается сильная синхронизация между таймфреймами. Специальное пр
Этот индикатор является уникальным, качественным и доступным инструментом для торговли, включающим в себя наши собственные разработки и новую формулу. В обновленной версии появилась возможность отображать зоны двух таймфреймов. Это означает, что вам будут доступны зоны не только на старшем ТФ, а сразу с двух таймфреймов - таймфрейма графика и старшего: отображение вложенных зон. Обновление обязательно понравится всем трейдерам, торгующим по зонам спроса и предложения. Важная информация Для макс
Представляем       Quantum Breakout PRO   , новаторский индикатор MQL5, который меняет ваш способ торговли в зонах прорыва! Разработан командой опытных трейдеров со стажем торговли более 13 лет,       Квантовый прорыв PRO       разработан, чтобы поднять ваше торговое путешествие к новым высотам с его инновационной и динамичной стратегией зоны прорыва. Quantum Breakout Indicator покажет вам сигнальные стрелки на зонах прорыва с 5 целевыми зонами прибыли и предложением стоп-лосса на основе поля
Atomic Analyst — MetaTrader 5 После покупки напишите мне на MQL5, чтобы БЕСПЛАТНО получить Smart Universal Expert Advisor, а также доступ к онлайн-курсу, руководство в формате PDF и доступ к закрытой группе. Atomic Analyst объединяет анализ ценового движения, направление тренда, сигналы входа и выхода, уровни Stop Loss и несколько уровней Take Profit прямо на графике. УВИДЬТЕ СИГНАЛ. ОЦЕНИТЕ ТОРГОВУЮ СИТУАЦИЮ. Atomic Analyst представляет результаты анализа в понятном визуальном виде: • Стрелки п
Scalper Vault — это мощная, полноценная торговая система, созданная для трейдеров, которые стремятся к стабильным результатам в внутридневной торговле. Этот высокоточный индикатор представляет собой комплексное, самостоятельное торговое решение, обеспечивающее аналитику профессионального (институционального) уровня как для торговли на рынке Forex, так и для работы с бинарными опционами. Пожалуйста, свяжитесь со мной после покупки, чтобы получить мои торговые советы, а также отличный бонус! Исклю
SR Liquidity   — это торговый индикатор, предназначенный для выявления скрытых зон, где концентрируется рыночная ликвидность и наблюдается наиболее сильная реакция цены. Эти особые зоны ликвидности выступают в качестве мощных уровней поддержки и сопротивления, предоставляя вам четкую картину того, где с наибольшей вероятностью произойдет разворот рынка. Вместо построения стандартных линий поддержки и сопротивления, индикатор SR Liquidity анализирует реальное поведение цены, выявляя зоны концентр
Power Candles V3 — самооптимизирующийся индикатор силы Power Candles V3 преобразует силу валюты и инструмента в готовый к использованию торговый план на каждом графике, к которому он прикреплен. Вместо того, чтобы просто раскрашивать свечи, он выполняет автоматическую оптимизацию в режиме реального времени в фоновом режиме и предоставляет вам оптимальные значения Stop Loss, Take Profit и порог сигнала для выбранного вами символа. Один клик — и все готово для реальной торговли: на графике появляю
Btmm state engine pro
Garry James Goodchild
5 (4)
BTMM State Engine Pro by G-Labs — Beat The Market Maker indicator for MetaTrader 5. Asian session range, London and New York kill zones, level progression (L1/L2/L3), peak formation detection (PFH/PFL), entry signals, and a multi-pair scanner from one chart. Stop scanning charts one pair at a time. The State Engine tracks the BTMM daily cycle automatically — Asian box, room boundaries, level blocks, peak formations, and filtered entries — while the scanner dashboard shows level, peak status, d
Каждый покупатель этого индикатора получает дополнительно Бесплатно: Авторскую утилиту "Bomber Utility", которая автоматически сопровождает каждю торговую операцию, устанавливает уровни Стоп Лосс и Тейк профит и закрывает сделки согласно правилам этой стратегии, Сет-файлы для настройки этого индикатора на различных активах, Сет-файлы для настройки Bomber Utility в режимы: "Минимум Риска", "Взвешенный Риск" и "Стратегия Выжидания", Пошаговый видео-мануал, который поможет вам быстро установить, н
FX Power: Анализируйте силу валют для более эффективной торговли Обзор FX Power — это ваш незаменимый инструмент для понимания реальной силы валют и золота в любых рыночных условиях. Определяя сильные валюты для покупки и слабые для продажи, FX Power упрощает принятие торговых решений и выявляет высоковероятные возможности. Независимо от того, хотите ли вы следовать за трендами или предсказывать развороты с использованием экстремальных значений дельты, этот инструмент идеально адаптируется под
DayTrader PRO DayTrader PRO — это передовой торговый индикатор, сочетающий фильтр Лагерра (Laguerre Filter) Джона Элерса с мощным движком автоматической оптимизации. Вместо использования фиксированных параметров индикатор автоматически подбирает оптимальные настройки на основе недавних рыночных условий, что позволяет адаптироваться к изменяющейся волатильности без необходимости ручной корректировки. Индикатор генерирует четкие сигналы на ПОКУПКУ и ПРОДАЖУ, а также адаптивные уровни Stop Loss и T
ICT PO3 (Power of 3) AMD Protocol Framework Indicator True Time & Structure Integration   |  Non-Repainting | Real-Time  | Multi-Asset  | MT4 Version Available Full Setup Guide & Strategy Playbook: https://www.mql5.com/en/blogs/post/768683 The ICT Power of Three (PO3): The Complete Guide to Accumulation, Manipulation, and Distribution https://www.mql5.com/en/blogs/post/771729 MT4 Version: https://www.mql5.com/en/market/product/171742 Indicator Overview The ICT PO3 AMD Protocol Framework i
Другие продукты этого автора
MTF Channel Panel
Manuel Alejandro Montoya Martinez
MTF Channel Panel MTF Channel Panel is an analytical indicator for MetaTrader 5 that displays channel information from multiple timeframes in a single panel. For each enabled timeframe, the indicator displays the calculated channel direction, its angle, and the current price position within the projected channel. Each row also includes an ON/OFF control that allows the corresponding channel to be displayed or removed independently from the chart. The indicator is designed to provide a summarize
Impulse Zone Spike Detector
Manuel Alejandro Montoya Martinez
Impulse Zone Spike Detector is a MetaTrader 5 indicator designed to identify and display horizontal price zones associated with previous impulsive movements on Boom and Crash indices. The indicator analyzes recent price behavior and marks historical levels where significant price reactions or impulsive movements have occurred. These levels are displayed as visual references that can be used to study subsequent price behavior. The indicator can automatically adapt its analysis to Boom or Crash i
Boom Crash Multi Entry Risk Calculator  is a panel-style indicator for MetaTrader 5 designed for risk planning on Boom and Crash synthetic index strategies. The panel helps organize multiple entries, define a common exit, estimate monetary risk per trade, and display a simple visual projection of the plan before execution. The indicator can automatically detect the index type from the symbol loaded on the chart. It also allows the user to set the index manually when a specific reference is prefe
MTF MultiAsset Channel Panel
Manuel Alejandro Montoya Martinez
MTF Multi-Asset Channel Panel is a multi-timeframe and multi-symbol indicator for MetaTrader 5 that summarizes channel structure in a compact table directly on the chart. Instead of drawing several channel objects at the same time, the indicator organizes the most relevant channel information into a structured panel. For each enabled timeframe and each selected symbol, it shows three practical elements: channel direction, channel angle, and the current price position inside the channel in percen
Step RSI Stochastic Signal Scanner Step RSI Stochastic Signal Scanner is an analytical indicator for MetaTrader 5 designed specifically for the analysis of Step Index and Step 200 Index . The indicator monitors Relative Strength Index (RSI) and Stochastic Oscillator conditions across multiple timeframes from a single panel. Its signal methodology evaluates oscillator levels, recent level crossings, and the relationship between RSI and Stochastic. According to the configured rules, each timeframe
Фильтр:
Нет отзывов
Ответ на отзыв