Spike Distribution Analyzer
- 지표
- 버전: 1.0
- 활성화: 5

Spike Distribution Analyzer is a visual statistical indicator for MetaTrader 5 designed to study how spikes are distributed after sequences of trend candles. Instead of focusing on entry signals, it summarizes the structure between spikes and trend continuation in a clear visual format. The indicator can display a floating text summary, a graphic panel, or both, depending on the selected display mode.
The main purpose of the indicator is to help the trader understand how often a spike appears after a certain number of trend candles. It analyzes historical candles, identifies spike candles according to the selected threshold method, counts how many trend candles appear between valid spikes, and converts that information into a distribution. This makes it easier to evaluate whether the market is showing short spike cycles, extended trend sequences, or a mixed structure.
The indicator is built for synthetic instruments and other symbols that behave in a spike-like way. It supports Boom, Crash, and generic bull or bear spike structures. Auto detection is available for common naming patterns, and manual index selection is also included when the user wants to define the market context directly.
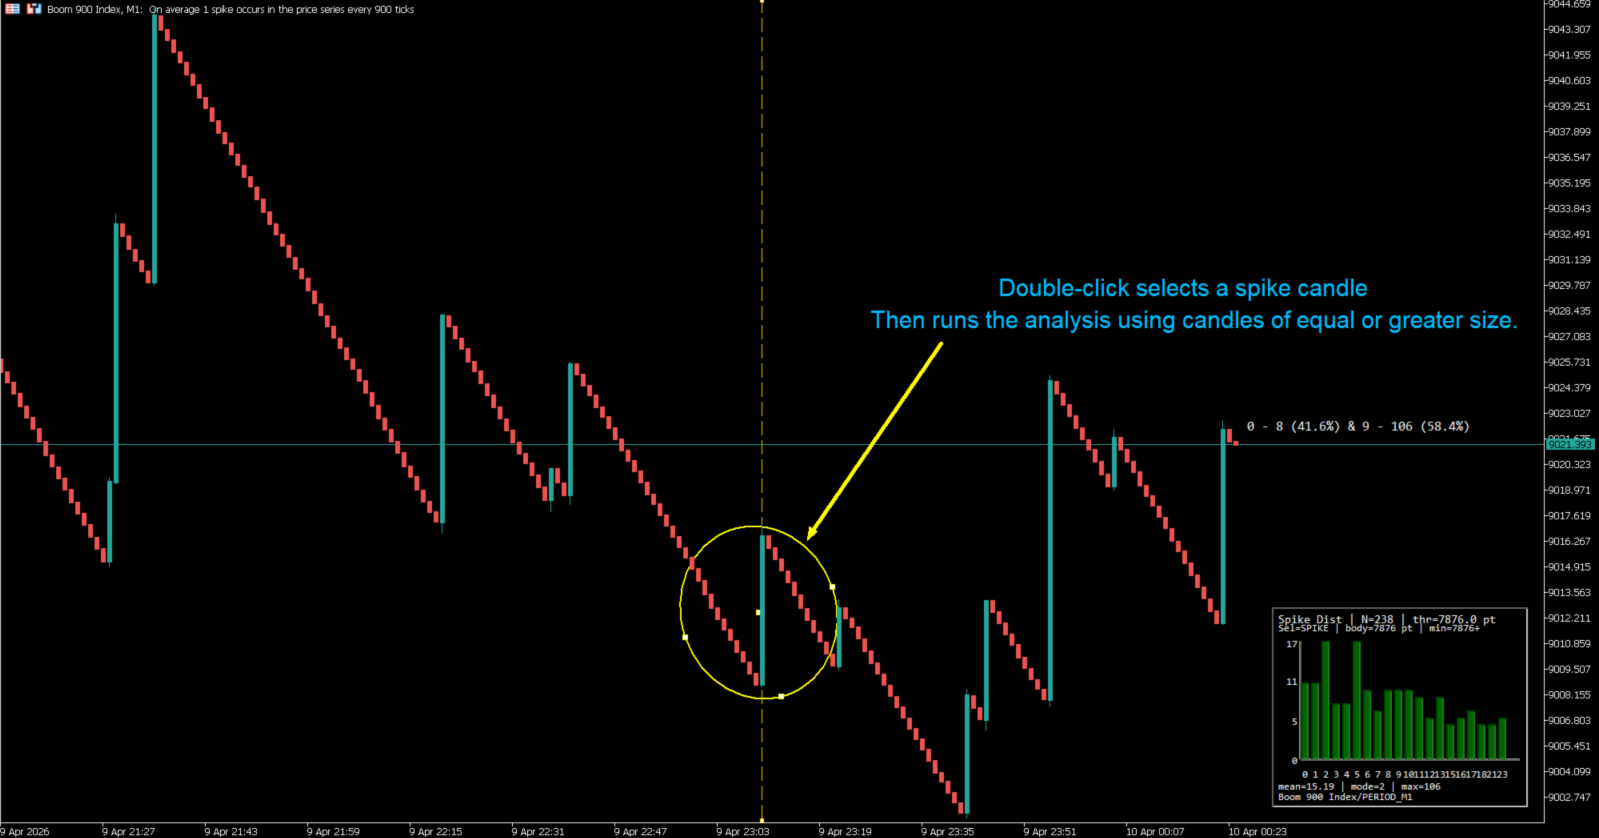
A practical feature of the indicator is its chart-friendly presentation. The floating text can provide a quick summary without filling the screen, while the graphic panel shows the filtered distribution in a more structured way. When a historical candle is selected through the anchor feature, the indicator can re-evaluate the minimum spike threshold from that candle. If the selected candle is not a spike but a trend candle, the panel shows “Not a spike” instead of drawing bars.
This indicator is intended as a decision-support and market-structure reading tool. It does not open trades, send orders, or perform automated trading actions. Its role is to organize statistical context in a visual form that can be read quickly during chart analysis.
How It Works
The indicator first loads historical bars from the selected symbol and timeframe. Then it calculates a spike threshold using one of three methods: preliminary mean body size, modal body size, or a fully manual points threshold. After that, it checks each candle body against the selected spike criteria and optionally applies a directional filter so the spike must also be opposite to the prevailing trend direction.
Once valid spikes are identified, the indicator counts how many trend candles appear between one spike and the next. Those counts are grouped into a frequency distribution. From that distribution, the indicator derives values such as weighted mean, mode, maximum observed k value, total groups, and related percentages. The panel can then plot the filtered bars of that distribution, while the floating text can summarize the percentage split between shorter and longer trend sequences.
What the Indicator Shows
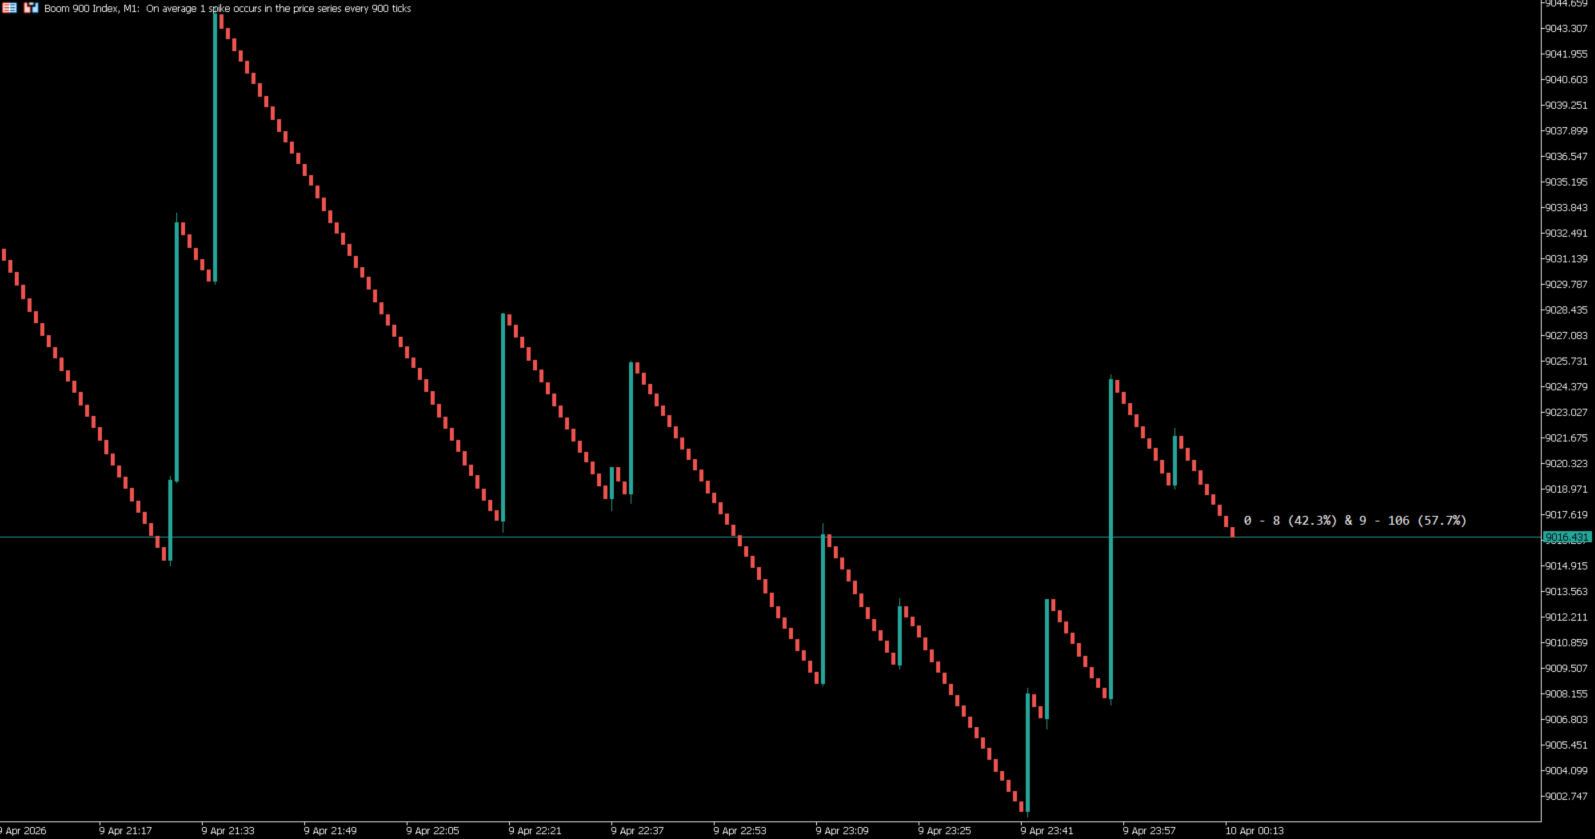
Floating text summary
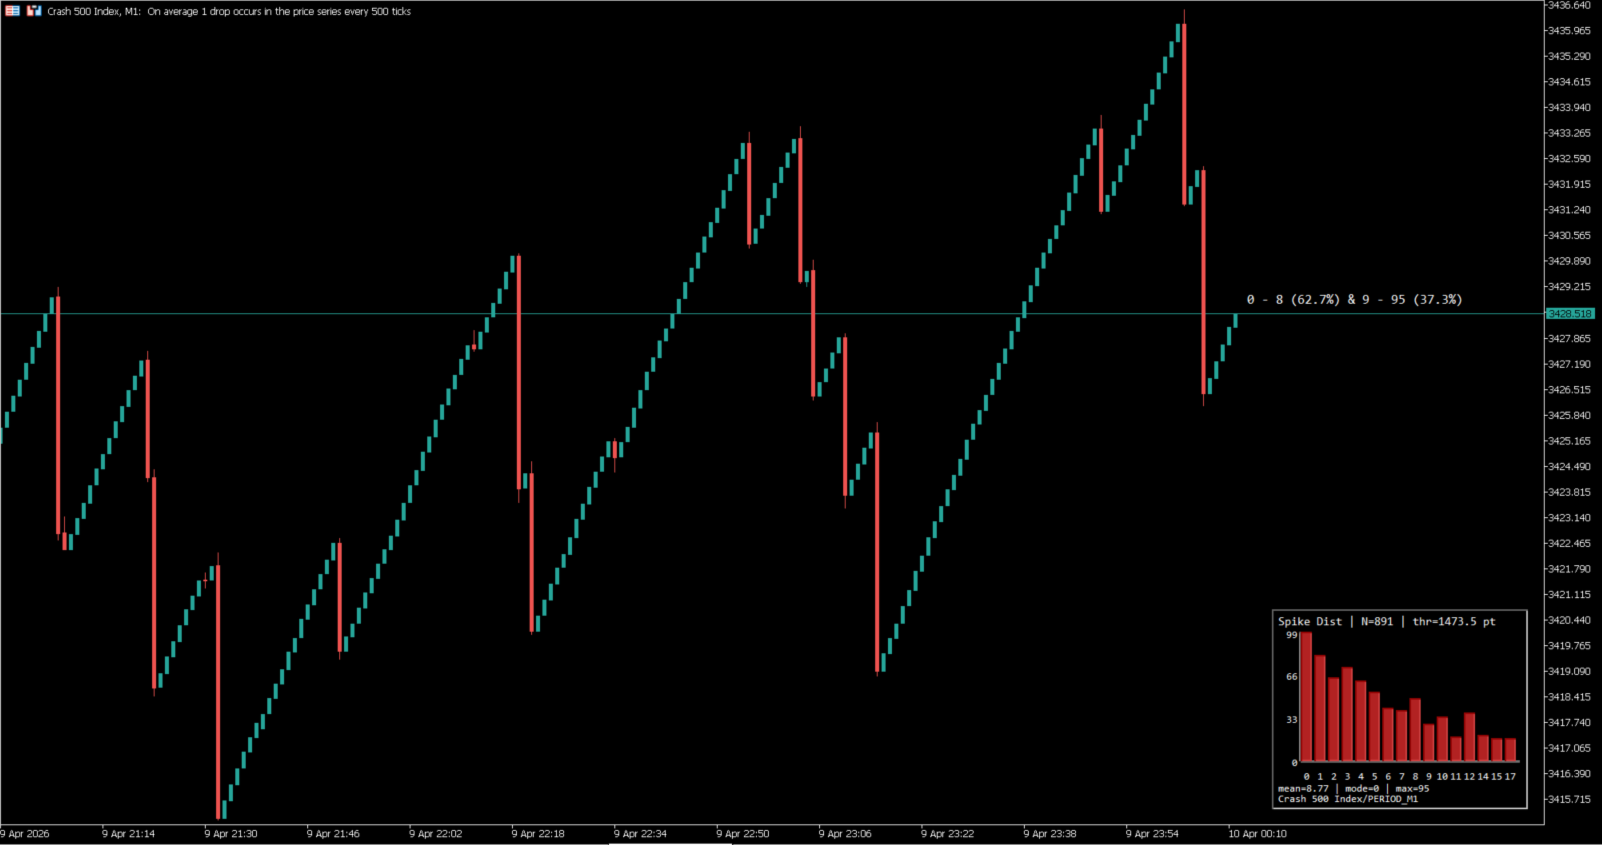
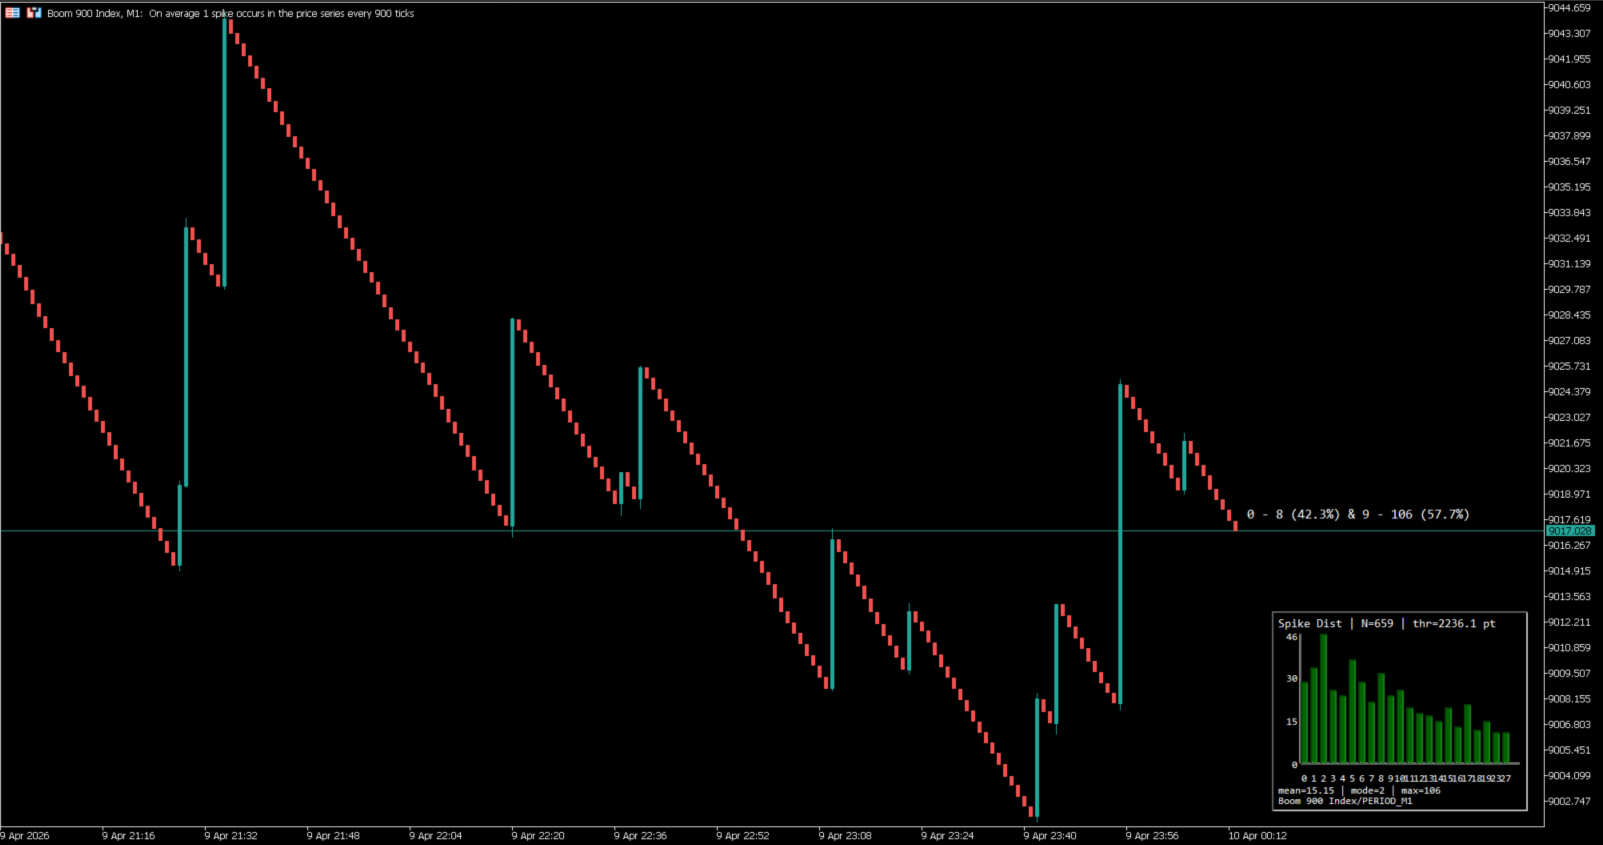
Shows a compact summary of the distribution directly on the chart. It can include the sample size, the active minimum threshold, and the percentage split between two k ranges.
Graphic panel
Shows the statistical distribution as a bar panel. Each bar represents a k value, meaning the number of trend candles found between spikes. The panel can work with absolute frequencies or percentage scale.
Anchor information
When the user selects a historical candle with the anchor, the panel subtitle reports the selected candle class, its body size, and the effective threshold used for the analysis.
Context label
If the analysis is applied to a symbol or timeframe different from the current chart, the indicator can display that external context in the visual output.
Special state for non-spike selection
If the selected anchor candle is a trend candle and not a spike, the graphic panel does not draw bars and shows the message “Not a spike”.
Practical Use
The indicator can be useful for traders who want to:
- study how often spikes appear after sequences of trend candles;
- compare short trend-to-spike cycles against longer ones;
- evaluate whether the current market structure is compressed or extended;
- review historical candles and re-check the distribution from a selected spike reference;
- keep the chart cleaner by using text mode, panel mode, or both.
Main Features
- Statistical analysis of spike distribution
- Floating text summary, graphic panel, or both
- Manual or automatic market context selection
- Three spike threshold calculation methods
- Optional directional spike filter
- Historical anchor selection by double click
- Special handling for non-spike selected candles
- Symbol and timeframe analysis support
- Percentage scale or frequency scale in the panel
- Visual output designed for fast reading on chart
Input Parameters
Data and Analysis Scope
InpSymbol – symbol to analyze. Leave empty to use the current chart symbol.
InpTimeframe – timeframe used for the analysis.
InpBars – number of historical bars loaded for the statistical calculation.
Spike Detection
InpSpikeMethod – method used to define the spike threshold.
InpSpikeDirectionMode – defines whether spikes are detected by body size only or by body size plus opposite direction to trend.
InpManualSpikeMinPts – manual minimum body size in points when manual threshold mode is used.
InpBinPoints – bin size in points used to estimate the modal body value.
InpFallbackThrPoints – fallback threshold used if the selected automatic method cannot produce a valid result.
Market Context and Output Mode
InpIndexKind – defines the market behavior type: auto, Boom, Crash, generic bull, or generic bear.
InpDisplayMode – selects text mode, graphic mode, or both.
Floating Text Summary
InpTextSplitK – split point used to summarize distribution percentages into two k ranges.
InpTextDecimals – number of decimals used in percentage text.
InpTextOffsetX – horizontal offset of the floating text.
InpTextOffsetY – vertical offset of the floating text.
InpTextAboveCandle – places the floating text above or below the reference candle area.
InpTextColor – text color of the floating summary.
InpTextFontSize – font size used in the floating text.
InpShowSampleSize – shows or hides the number of valid groups in the text summary.
Historical Anchor Selection
InpEnableDblClickAnchor – enables anchor selection by double click on the chart.
InpDblClickMs – maximum time interval in milliseconds for double-click detection.
InpDblClickPx – maximum pixel distance between clicks for the anchor selection.
InpShowAnchorLine – shows or hides the vertical line of the selected anchor.
InpSelectedSpikeMinusPts – reduces the selected spike threshold by the specified number of points.
Graphic Panel – Data Filter
InpGraphicMaxBars – maximum number of k bars to display. Use 0 for automatic filtering.
InpGraphicAutoFilter – filter rule used when automatic bar selection is active.
InpUsePercentScale – shows panel bars in percent scale instead of raw frequency.
Graphic Panel – Position and Size
InpPanelCorner – panel corner position on chart.
InpPanelX – horizontal panel offset.
InpPanelY – vertical panel offset.
InpPanelWidth – panel width.
InpPanelHeight – panel height.
Graphic Panel – Layout
InpBarGap – space between bars.
InpBarWidthMin – minimum width of each panel bar.
InpPanelBottomPad – bottom padding of the panel.
InpXAxisLabelPad – padding used for X-axis labels.
InpFooterTextPad – vertical spacing before the footer text.
InpFooterSymbol – spacing between the first and second footer lines.
InpYAxisLabelOffsetX – horizontal offset of Y-axis labels.
InpXAxisLabelOffsetY – vertical offset of X-axis labels.
Graphic Panel – Colors
InpPanelBgColor – background color of the panel.
InpBarColor – color of the distribution bars.
InpAxisColor – color of the panel axes.
InpLabelColor – color of the panel labels.
Notes
This indicator is designed to organize spike statistics in a visual and structured format. It does not predict future prices and does not execute trades. It is intended to help the trader read market structure with less visual noise and with clearer statistical context.