Смотри обучающее видео по маркету на YouTube
Как купить торгового робота или индикатор
Запусти робота на
виртуальном хостинге
виртуальном хостинге
Протестируй индикатор/робота перед покупкой
Хочешь зарабатывать в Маркете?
Как подать продукт, чтобы его покупали
Технические индикаторы для MetaTrader 4 - 19

Ants Lite ATR позволяет открывать сделки и управлять ими на основе рыночной волатильности, предоставляя более безопасные точки входа и выхода. Основано на работе Дэрила Гуппи (Daryl Guppy).
Особенности Возможность задать бар, с которого будут начинаться расчеты сигналов для коротких и длинных сделок. Может использоваться для подачи сигналов как на вход, так и на выход. Настраиваемый период и множитель ATR. GMMA - надежный и проверенный индикатор, доказавший свою эффективность. Сигналы на вход и
Сканер Moving Average Multicurrency Scanner Dashboard MT5 — это мощный торговый инструмент, предназначенный для мониторинга множества валютных пар и таймфреймов с использованием настраиваемых скользящих средних. Он организует сигналы в табличном формате, отображая статус каждого символа по таймфреймам от M1 до MN1. Трейдеры могут включать или отключать определенные таймфреймы в соответствии со своими стратегиями. Версия для MT4 доступна здесь: Moving Average Multicurrency Scanner MT4 Для подробн

Binary Scalper 6 – Мощный индикатор для торговли бинарными опционами на MT4 Binary Scalper 6 – это современный инструмент для анализа трендов и торговли бинарными опционами на платформе MetaTrader 4 (MT4) . Этот индикатор подходит как начинающим, так и профессиональным трейдерам, предоставляя ясные сигналы и статистику для успешной торговли. Ключевые особенности: Обнаружение тренда
Индикатор точно определяет трендовые рынки, давая трейдерам ясное представление о направлении торговли. Поддержка
Для MT5
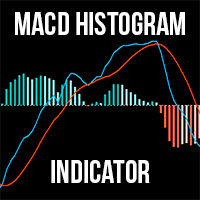
Индикатор MACD Histogram — это улучшенная версия традиционного индикатора MACD, предоставляющая превосходное понимание рыночных тенденций и изменений в импульсе. В отличие от стандартного MACD в MT4, эта версия включает гистограмму , что облегчает визуализацию и интерпретацию рыночных условий. Преимущества по сравнению со стандартным индикатором MACD: Улучшенная визуализация: Гистограмма предоставляет столбчатое представление разницы между линией MACD и сигнальной линией, что упрощает

Nebula Bow — Trend Direction Filter Nebula Bow is a clean and efficient trend direction filter designed to help traders stay aligned with the dominant market flow while avoiding unnecessary noise. Rather than overwhelming the chart with complex calculations or multiple indicators, Nebula Bow focuses on clarity, stability, and practical trend guidance . It is built on the idea that a well-structured and disciplined approach often outperforms excessive complexity . This indicator is especially sui
FREE

DiverX - это мощный многофункциональный индикатор дивергенций, разработанный для платформы MetaTrader 4 . Он позволяет выявлять как регулярные, так и скрытые дивергенции на основе пяти популярных технических индикаторов: RSI (Relative Strength Index) , RVI (Relative Vigor Index) , Stochastic Oscillator , CCI (Commodity Channel Index) и MACD (Moving Average Convergence Divergence) . Индикатор отображает результаты непосредственно на основном графике, предоставляя визуальны
FREE

Rtc ML Ai | Predictor CORE MACHINE LEARNING ENGINE
Adaptive ML Market Predictor – Multi-Bar Trend & Candle Forecast What This Indicator Does This indicator is a real-time market prediction engine designed to analyze price behavior and estimate future market tendencies . Unlike conventional indicators, this system does not rely on static parameters or historical curve-fitting , but adapts its internal state dynamically during live market operation. Instead of using static rules, the indic

The Multi Trendlines indicator automatically draws the dominant trendlines on the current chart. The indicator looks for the 5 best Up trends and the 5 best Down trends as at the current price, drawing each trendline if filter conditions are met. The trendlines are named "Trendline"+[Direction]+Symbol()+TrendlineSequenceNumber For example: The second Up trendline on a EURUSD chart would be named "TrendlineUpEURUSD2". To get its current value would be: ObjectGet("TrendlineUpEURUSD2",OBJPROP_PRI
FREE
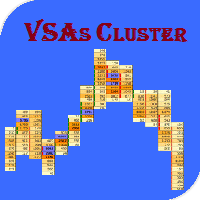
Индикатор горизонтальных и вертикальных объемов. Предназначен для внутридневной и среднесрочной торговли (до Н4).Рассчитывается на основе тиковых или реальных объёмах (если их предоставляет брокер). Ценовой уровень, внутри свечи, на котором было максимальное количество сделок, выделяется цветом. Вертикальные объемы определяют паттерны Price Action (SonicR, BetterVolume) или импульсы (Enhanced) на выбор. Сочетание вертикальных и горизонтальных значений позволяет определить среднесрочные уровни по
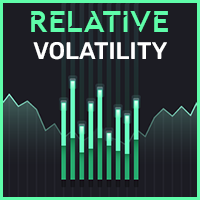
Like most things that work in trading, it's really simple. However, it's one of the most powerful tools I have that makes entries of many systems much more precise.
In its essence, it measures the recent volatility against the medium-term average. How does it work? Markets tend to be prone to strong trending movements when relative volatility is low and tend to be mean-reverting when relative volatility is high.
It can be used with both mean-reversion systems (like the Golden Pickaxe) and mo
FREE

This indicator is designed to make reviews of many charts on different timescales quicker, and easier to do. Track Time and Price across multiple charts Change Symbol on one chart and all other charts of the same symbol will be changed too. Easy to use, quick to master The indicator allows you to identify the price and time where the mouse pointer is on the current chart, across all other charts open on the same Symbol. This allows you to quickly see information on multiple charts whereas normal
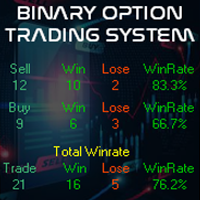
Buy And Sell Binary Option on the MetaTrader 4 (MT4) platform is a specialized technical analysis tool designed to assist traders in identifying binary option trading opportunities using the latest market algorithms. This indicator has been enhanced with an algorithm that incorporates the most up-to-date market information and processes it into a histogram. Additionally, the indicator comes with alert features, including pop-up alerts and email notifications. Latest Market Algorithm : Our indica

Renko Trade Alarm is designed to work on chart with Renko and Mean Renko candles. It generate B uy and S ell signals on the chart and send notifications. Visualization of signals: Swing - Formations 123. Pattern - Double Bottom, Double Top, Triple Bottom, Triple Top, Formations 123 Reverse. Scalp - Periodic change in the price direction, plus additional filters in the form of oscillators Stochastic and MACD. Ichi - Signals filtered by the Ichimoku indicator. For correct operation an offl

Moving Average Stack:
MA Stack single timeframe, multi-timeframe and multi-currency versions for MT4 (Metatrader 4) Very useful for finding current and higher timeframe trends. Best suited for long term trend based trading. For quick scalping use fewer moving averages. And not suitable during low volatility. Only use during high volatility and steady trending markets. Use this to enhance your existing Trend based strategies to find best trends. Instead of using as a standalone indicator.
You ca
Индикатор LTS для MT4 (Level + Trends + Speed)
Индикатор LTS был создан для быстрого анализа консолидаций на графике , существенно облегчающий принятие решений при торговле. LTS выделяет точки напряжения и дает информацию о силах, влияющих на него, а так же текущую скорость и средний ход. Индикатор легко настраивается под любой стиль торговли и может анализировать любой таймфрейм. LTS использует уникальный алгоритм анализа трендов по 4м параметрам от глобального до локального.
Настройка
Order Block Tracker is here to solve one of the biggest challenges traders face: identifying order blocks. Many traders fail to spot these critical zones, often missing out on key market entries. But with Order Block Tracker , you no longer have to worry about that. This advanced indicator automatically highlights these crucial zones for you, giving you the confidence to enter the market at the right time. MT5 Version - https://www.mql5.com/en/market/product/123362/ Key Features of Order Block

True Order Blocks is an excellent indicator for day traders, swing traders, and even scalpers. It is combined with multiple market-moving strategies. It identifies market structure, marks supply and demand zones, displays imbalance moves, structure break, trendline breakout, and much more. True order blocks are compatible with forex, stocks, cryptocurrency, and any market with any timeframe. And I'll show you how to use this tool in your day-to-day trading life. Please watch the video to learn h

У каждого индикатора есть свои достоинства и недостатки. Трендовые показывают хорошие сигналы во время тренда, но запаздывают во время флэта. Флэтовые прекрасно себя чувствуют во флэте, но при наступлении тренда сразу же умирают. Все это не было бы проблемой, если было бы просто предсказать, когда тренд сменится флэтом, а флэт сменится трендом, но на практике это крайне серьезная задача. Что если разработать такой алгоритм, который сможет в индикаторе устранить недостатки и усилить его достоинс

Индикатор Углов Ганна Индикатор Углов Ганна - это мощный технический инструмент, основанный на теории Уильяма Делберта Ганна. Он помогает трейдерам определять потенциальные уровни поддержки и сопротивления, а также направление тренда на различных временных интервалах. Основные характеристики: Автоматическое определение экстремума в заданном временном диапазоне Построение 9 линий веера Ганна с углами 82.5, 75, 71.25, 63.75, 45, 26.25, 18.75, 15 и 7.5 Гибкая настройка цвета линий Адаптаци

Anchored Volume Weighted Average Price (AVWAP, or Anchored VWAP). Tells you who is in control, the buyers or the sellers. Better than all other moving averages because it adds weight to the traded volume. This technique was made popular by Brian Shannon of Alphatrends. It is calculated by multiplying typical price by volume, and the dividing by total volume. It is very simple to use. 1. Press a number from 1 to 9 on the keyboard, then click the chart where you want to anchor the VWAP. 3. Hold C
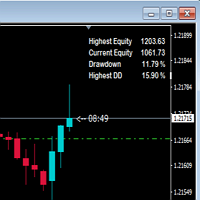
This indicator shows drawdown based on highest equity. Usually drawdown is used to show performance of a trading account especially when someone participate in a trading contest. If drawdown exceed a determined number, the contest account will be disqualified. So, I hope, this indicator will warn us in maintaining the drawdown and the account still be saved.
FREE

This indicator identifies swing highs and swing lows in the price chart by comparing the Highs and lows of each candle to a specified number of candle before and after it. Once it has identified the swing highs and swing lows, it can use them to determine potential support and resistance levels. A support level is formed when the price drops and bounces back up from a swing low, indicating that there is buying pressure at that level. A resistance level is formed when the price rises and reve
FREE
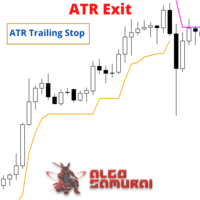
The ATR Exit indicator uses the candle close + ATR value to draw trailing stop lines (orange under buys, magenta over sells) that advance with the trend until the trend changes direction. It uses a multiple of the Average True Range (ATR), subtracting it’s value from the close on buy, adding its value to the close on sell. Moreover, the trailing stop lines are generated to support the order’s trend direction (long or short): In an upward trend, the long trailing stop line (orange line under bu
FREE
Данный индикатор находит фигуры технического анализа "Двойное дно" и "Двойная вершина", показывает их на графике валютной пары и может сигнализировать, если фигура была сформирована недавно. Эти фигуры являются разворотными, часто после из появления тренд поворачивает обратно или происходит коррекция. Чтобы не искать их самостоятельно, достаточно добавить индикатор на график, после этого, можно изменять разные таймфреймы, чтобы быстро найти такие фигуры на одном из тайфреймов. Имеются некоторые
FREE

Draw and Sync Objects Multiple Charts 1. Draw objects by key press. ( You must: 1. Press Function key => 2. Click where you want to draw => 3. Draw it => 4. Press ESC to complete). (If you don't want to draw after pressing function key, you must press ESC to cancel). 2. Developing : Sync selected objects to multiple charts by button. 3. Developing: Hide objects that do not belong to the current symbol (Objects drawn with this indicator will belong to the symbol they are plotted
FREE

ADX Channel - это индикатор, который рисует канал в зависимости от показаний индикатора ADX (Average Directional Movement Index). Канал получается немного похож на Envelopes, однако его линии зависят от волатильности рынка. Сделка на продажу обычно осуществляется, когда цена коснется и отскочит от верхней линии канала, покупка - от нижней. Рекомендуется торговать в то время, когда нет важных новостей. Таймфремы, которые лучше использовать: M5 - H1. Индикатор не предназначен для торговли на таймф
FREE

All-in-one trading powerhouse: trend, reversal, and exhaustion detection
This indicator is a personal implementation of the famous Traders Dynamic Index, which uses RSI, moving averages and volatility bands to find trends, reversals and price exhaustions. However, this particular implementation supports not only RSI, but many others. It is suitable for scalping, day trading, and swing trading and aims to provide a full picture of the current market conditions. [ Installation Guide | Update Guid
FREE
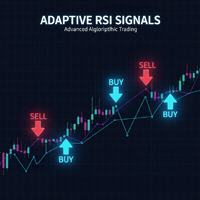
Powered by SVX Strategies Quant Team This is the full implementation of our "Self-Adaptive Trading Rules." It combines Market Structure (Dynamic Support & Resistance) with Adaptive RSI intelligence to generate high-probability buy and sell signals. Want this strategy fully automated?
Manual execution requires constant screen time. If you prefer to have our team manage the execution for you, copy our official algorithms: Copy "Friday Pulse" (Conservative/Stable) Copy "SVX AI Systems" (High Growt
FREE

Мультивалютный и мультитаймфреймовый индикатор Moving Average (MA). На панели вы можете видеть текущее состояние индикатора — прорывы и касания (ценой) Быстрой МА и Медленной МА, а также пересечение линий МА между собой. В параметрах можете указать любые желаемые валюты и таймфреймы. Также индикатор может отправлять уведомления о касании ценой линий и о их пересечении. По клику на ячейке будет открыт данный символ и период. Параметры
Fast MA
Averaging period — период усреднения для вычисления
TrendBite v1.5 - Профессиональный индикатор слежения за трендом Разработчик: 8aLt4 Версия: 1.5 Платформа: MetaTrader 4
Обзор TrendBite v1.5 — это усовершенствованный индикатор технического анализа, предназначенный для определения изменений тренда на рынке и предоставления инвесторам четких сигналов на покупку и продажу. Основанный на алгоритме полос Боллинджера, этот инструмент точно фиксирует развороты тренда и идеально подходит как для начинающих, так и для опытных трейдеров.
Основные хар
FREE
What is the ADX_DI Indicator? ADX_DI is an advanced technical analysis indicator developed for MetaTrader platform. It combines Average Directional Index and Directional Indicator components to analyze market trend strength and direction. What Does It Do? Measures Trend Strength : ADX line shows the strength of market trends Determines Direction : DI+ (green) and DI- (red) lines identify trend direction Detects Trend Changes : DI+ and DI- crossovers provide trend reversal signals Automatic Alert
FREE
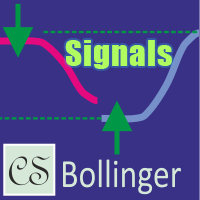
CS Bollinger – это сигнальный индикатор на основе полос Боллинджера, разработанный для быстрого определения ключевых уровней поддержки и сопротивления с визуальными торговыми сигналами. Благодаря доработанной логике переключения уровней, индикатор автоматически корректирует уровни на графике, отображая сигнальные стрелки при подтверждении разворота цены. Это помогает трейдерам оперативно находить благоприятные моменты для входа в рынок и выхода из позиции. Индикатор обладает гибкой настройкой, п
FREE

Индикатор синхронизирует восемь видов разметки на нескольких графиках одного торгового инструмента.
Этот индикатор удобно использовать вместе с "Multichart Dashboard" или другим похожим помощником, который позволяет работать сразу с несколькими графиками одновременно.
"Multichart Dashboard" можно найти по ссылке на моём youtube-канале.
Настройки:
включение синхронизации Vertical Line
включение синхронизации Horizontal Line
включение синхронизации Trend Line
включение синхронизации Fi
FREE
Shows Kaufman Efficiency Ratio value and smoothed by MA. Calculation is based on movement divided by volatility on a specified period. Levels are adjustable as well as visualization. Parameters: KERPeriod - period for ratio calculation. EMAPeriod - period for moving average. Shift - indicator shift. HigherLevel - low value of the higher zone. LowerLevel - high value of the lower zone. ShowHigherZone - allow higher zone drawing. HigherZoneColor - higher zone color. ShowLowerZone - allow lower zon
FREE
Classic ZigZag formula. But no lags and repaints. You can see on screenshots that it shows values between peaks and it is useful to test strategies based on indicator. Because sometimes people find a good idea about it but don't understand that repainting indicators have some things to keep in mind. The parameters are the same as original ZigZag indicator: Depth, Deviation and Backstep.
FREE

Automatically detect bullish or bearish order blocks to optimize your trade entries with our powerful indicator. Ideal for traders following ICT (The Inner Circle Trader). Works with any asset type, including cryptocurrencies, stocks, and forex. Displays order blocks on multiple timeframes, from M2 to W1. Alerts you when an order block is detected, migrated, or a higher timeframe order block is created/migrated. Perfect for both scalping and swing trading in Smart Money Concepts. Enhanced by st
** All Symbols x All Time frames scan just by pressing scanner button ** After 18 years of experience in the markets and programming, Winner indicator is ready. I would like to share with you! *** Contact me to send you " Trend Finder indicator " free, instruction and add you in "M1 Signal Scanner group" for sharing or seeing experiences with other users. Introduction: M1 Signal Scanner is the indicator designed scalping M1 time frame to detect Small trend switching in the direction

Title: Price Action Pro - Advanced Multi-Timeframe Reversal Scanner Product Overview: Price Action Pro is not just another candlestick pattern indicator. It is a complete trading system designed to detect high-probability reversal setups. Unlike standard indicators that spam signals on every pattern, Price Action Pro uses a Smart Swing Filter to ensure patterns are only detected at valid swing highs or lows. Combined with Multi-Timeframe (MTF) capabilities and Dynamic ATR Sizing , this tool adap

Parabolic MA Pro - Système de Trading Avancé Détectez les retournements de tendance avec précision grâce à notre système unique combinant SAR Parabolique et Moyenne Mobile ! CARACTÉRISTIQUES RÉELLES SYSTÈME HYBRIDE INNOVANT SAR Parabolique calculé sur la Moyenne Mobile (au lieu du prix direct) Filtrage des faux signaux grâce à la double validation Algorithme exclusif de retournement de tendance ALERTES PRÉCISES Notifications sonores aux points de retournement Détection automati
FREE
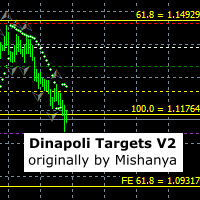
This indicator sets stop, start and target 1, 2 and 3 levels based on detected market swings on multiple timeframes. It was originally written by Mishanya and has been updated by Ramoletane to move with the price and automatically update the levels. A trade can be placed when price has crossed the white start line and stop loss placed on the red stop line. The lot size can be reduced at the green target 1 level, the yellow target 2 level and the position finally closed at target 3. Most of the t
FREE

Recommended on M15 and higher timeframes
Sends alerts and notifications when the zone is create
Sends alerts and notifications if zones are retested
You will see the trading zones and identify the most profitable points to open positions. The indicator marks the supply and demand zones.
With this show you will now make profitable trades that will set the trends.
Shows all support and resistance zones.
Can work in all time zones.
No need to mess with complicated settings, all settings are
FREE

. Simple Trading System Update !!! Follow this link to see our Strategy !!! (With auto trade indicator)
Description This is an indicator Free Version and showing only history signals, Not real time. Binary Deal Trading Indicator is an indicator on MT4 for Binary Option Trading. It forecasts the overbought / oversold level, Reversal and Fractal point. This indicator will help you to decide a reversal price on any time frame (Recommend M1, M5 and M15). The expiry time is 5-15 minutes after rec
FREE

ICT Silver Bullet
If you are searching for a reliable indicator to trade the ICT Silver Bullet concept, or ICT concepts, Smart Money Concepts, or SMC, this indicator will respond to your need! This indicator will help you identify the following: FVG - fair value gaps Market structure: BOS and CHOCH. It is based on ZIGZAG as it is the most subjective way to do it. ICT Silver Bullet windows and related notifications when it starts and when an FVG appears Swing High and low that are potential bu

What is the Super Ichi Indicator? Super Ichi is an advanced combination of Ichimoku Kinko Hyo and SuperTrend indicators. This powerful technical analysis tool is designed to identify market trends and generate trading signals. What Does It Do? Dual-Level Trend Analysis : Uses customized versions of Tenkan-sen and Kijun-sen lines Automatic Signal Generation : Displays visual markers (arrows) at crossover points Real-Time Alert System : Provides audio and visual alerts when new signals occur Dynam
FREE

Обзор:
Индикатор Цветной Parabolic SAR – это визуально улучшенный торговый инструмент, разработанный для облегчения следования за трендом и идентификации сделок. Этот настраиваемый индикатор предоставляет четкие визуальные подсказки с цветными сигналами для бычьих (покупка) и медвежьих (продажа) трендов прямо на вашем графике MT4. Основные особенности: Цветные сигналы: Лаймовый зеленый символ "o" для сигналов на покупку. Красный символ "o" для сигналов на продажу. Настраиваемые параметры: Регул
FREE

How the Indicator Works:
This is a Multi-timeframe MA multimeter indicator which studies if price is above or below a particular EMA range and shows Red/Green/Yellow signals. Red: Price Below EMA range Green: Price above range Yellow: Price within range
Indicator Properties:
EMA Settings: - Default Period is 200. You can change all MA Settings like Period, MA Method (SMA, EMA, etc) or MA Applied Price (Close, Open, etc).
- EMA Range list is a comma separated value list for different timeframes
FREE
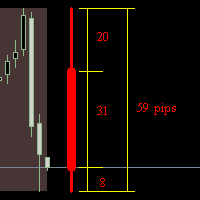
Индикатор 'рисует' дневную, недельную или месячную свечу на текущем графике. Показывает в пунктах размеры верхней и нижней тени, тела и всей свечи. Работа в реальном времени. Работает в тестере стратегий. Параметры индикатора: How_much_to_show - сколько показать блоков. Block_period - период блока (день/неделя/месяц)
Shift - смещение от края графика в барах. language - выбор языка.
FREE
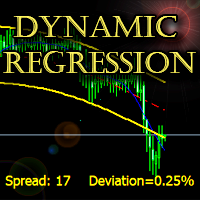
Индикатор строит динамический канал регрессии с высокой точностью без запаздывания. Отклонение канала рассчитывается по уникальной формуле и отображается на графике. Support: https://www.mql5.com/en/channels/TrendHunter Возможно использование на любом таймфрейме и любом инструменте. MT5-version: https://www.mql5.com/ru/market/product/64257
Можно использовать как готовую торговую систему, как и дополнение к существующей. Настройки:
Fast Period - Период быстрого сглаживания; Slow Period - Перио

ATR Bands с Зонами Тейк-Профита для MT4 Индикатор ATR Bands для MT4 создан для помощи трейдерам в управлении рисками и анализе рыночной волатильности. Используя Средний Истинный Диапазон (ATR), он помогает определять ключевые уровни цены и устанавливать реалистичные стоп-лоссы и тейк-профиты. Основные функции: Полосы на основе ATR : Индикатор рассчитывает динамические верхние и нижние полосы с использованием ATR. Эти полосы адаптируются к волатильности цены, указывая потенциальные уровни поддерж
FREE

Dominate the Market with Reversal Dominator! Tired of chasing trends only to get caught in a sudden reversal? Reversal Dominator is your ultimate weapon for spotting high-probability market turns before they become obvious. This powerful indicator leverages a sophisticated Absolute Strength calculation, paired with an intelligent moving average filter, to give you the precise edge needed to enter or exit trades with confidence. Why Choose Reversal Dominator? Pinpoint Reversals: Never miss a cr
FREE

Full Stochastic - это осциллятор Стохастик, который отображает все три основные линии: %K Медленная K %D Стандартный осциллятор Стохастик отображает только медленную K и %D.
Почему важно анализировать все три линии осциллятора Стохастик? Пользователям стандартного осциллятора Стохастик приходится выбирать, использовать ли быстрый или медленный Стохастик. При работе с быстрым Стохастиком трейдеры обычно устанавливают параметр замедления равным 1 или 2, а при работе с медленным Стохастиком зачаст
FREE

Relative Volume or RVOL is an indicator that averages the volume of X amount of days, making it easy to compare sessions volumes.
The histogram only has 3 colors:
Green - Above average volume
Yellow - Average volume
Red - Below average volume
The default setting is 20 days, which corresponds more or less to a month of trading.
With the data obtained from this indicator you can better gauge the commitment behind a move. For example, you will be better equipped to judge if a breakout of a r
FREE
Features List 1:
FVG->iFVG Order Block High Transaction Line (Personal strategy) Premium Discount 50% and 61% Previous day high low Previous week high low Candle end countdown Feature List 2 : (Implemented based on feedback from community groups) trend identification Hide FVG, Order Block, Large Transaction line below 50% equilibrium. Hide all/Individual texts/features FUTURE Feature List (Will be implemented only if at least 5 people request for it.)
Asia, London, NY lq zones (Implemented) Def

Индикатор силы, который измеряет движение цены для подтверждения тренда и силы. Продвинутый мультивалютный и мультитаймфреймовый индикатор, который позволяет одним взглядом на график увидеть все валютные пары в тренде , а также самые сильные и слабые валюты, движущие этими трендами. Этот индикатор интеллектуально анализирует движения цен 28 валютных пар одновременно на всех таймфреймах в режиме реального времени , поэтому вы всегда будете знать о самых сильных и слабых валютах в составе пары . C

TickFlow — инструмент для анализа тиковых данных и визуального выделения значимых зон на графике. Утилита агрегирует текущие и исторические тики, отображает соотношение покупателей и продавцов, а также помогает видеть уровни поддержки/сопротивления и зоны кластеров. Здесь версия для Metatraider 5. Как это работает (коротко) TickFlow собирает тиковые данные и агрегирует их по ценовым шагам и свечам. По накопленным данным строится визуализация: счётчики тиков вверх/вниз, соотношение покупателей/п

RoundNumbers indicator is a simple and powerful psychological price levels. Trader usually use these levels as a Support and Resistance (SnR). Indicator Input: Levels - Numbers of levels drawn on chart. Default 30 levels. BoxSize - Box size drawn on each levels, indicate buffers around levels. Default value 1pips (10point) above and below each levels. ZoneSize - Distance between each levels, default value 10pips (100point). Style & Colours - User inputs customization.
For MT5 version, please re
FREE

The MT4 indicator that we are describing is designed to provide traders with an alert, notification, and email when Fibonacci levels are crossed. The Fibonacci levels are calculated based on the zigzag indicator, which helps to identify potential trend reversals in the market. When the indicator detects that a price has crossed a Fibonacci level, it will trigger an alert and send a notification to the trader's MT4 mobile app. Additionally, the indicator can be configured to send an email to the
FREE

This indicator uses the Zigzag indicator to identify swing highs and swing lows in the price chart. Once it has identified the swing highs and swing lows, it can use them to determine potential support and resistance levels. A support level is formed when the price drops and bounces back up from a swing low, indicating that there is buying pressure at that level. A resistance level is formed when the price rises and reverses downward from a swing high, suggesting selling pressure at that leve
FREE

Introduction To Time Box Indicator Time Box Indicator is a must have indicator for any trader. It will display daily, weekly and Monthly box according to your preferences. Yet, you can extend any important price levels in your chart automatically. You can use them as the significant support and resistance levels. It is very simple but effective tool for your trading.
Graphic Setting Use White Chart Line Style for Current Open price
Daily Setting Update Timeframe for daily box Number of days to
FREE

Footprint Hunter – Ваш радар усилий и результата в MT4 Footprint Hunter — это идеальный индикатор для трейдеров, которые хотят видеть настоящую игру за ценами на MetaTrader 4 Он четко и интуитивно показывает агрессивные объемы покупок и продаж на основе POC (Point of Control), позволяя визуализировать усилия рынка и реальный результат на каждом свече. ️ Почему это важно?
Не весь объем двигает цену! Footprint Hunter показывает, действительно ли усилия (агрессивный объем) эффективно влияют

The volume weighted average price (VWAP) is a trading benchmark used by traders that gives the average price a security has traded at throughout the day, based on both volume and price. VWAP is calculated by adding up the dollars traded for every transaction (price multiplied by the number of shares traded) and then dividing by the total shares traded. You can see more of my publications here: https://www.mql5.com/en/users/joaquinmetayer/seller
FREE

is a user-friendly MetaTrader 4 indicator that creates a centralized dashboard for traders to oversee several cryptocurrency pairs simultaneously across different timeframes, presenting price movements through simple dots or miniature candlestick charts, complemented by volume indicators to facilitate quick assessments of market trends and fluctuations. It automatically resizes grid cells according to the number of bars shown per timeframe for better use of screen space, features adjustable co
FREE
WHAT IS NEXT MOVE? SIMPLE ANSWER IS, THIS PROGRAM IS BASED ON PRICE ACTION THEREFORE FINDING NEXT MOVE IS EASY TO IDENTIFY THIS PROGRAM IS USING STANDARD CALCULATIONS FOR SUPPORT RESISTANCE IN SHAPE OF 2 WAYS TREND LINES SELECT HORIZONTAL LINES TREND LINES WILL GUIDE TRADERS TO TRADE IN RANGE WITH PIVOT LEVEL ALSO HORIZONTAL LINES GUIDE YOU ABOUT SUPPORT RESISTANCE OF DIFFERENT TIMEFRAMES FOR EXAMPLE: IF TRADER INTERESTED TO TRADE IN 15 MINUTES TIME FRAME, THEN HE CAN SELECT 15 MINUTES IN PR
FREE

Esse indicador mede o 1º Canal de referencia e a 1º Zona Neutra * configurar o canal macro para verificar a frequencia MAIOR H1 H4 1D * configurar o canal micro para verificar a frequencia Menor 1M 5M 15M Como instalar o Indicador fimathe. E uma pré mentoria tem uma estrategia Secreta bonus nesse video . assitao o video para enteder as logicas que podemos iniciar com esse indicador.
https://www.youtube.com/playlist?list=PLxg54MWVGlJzzKuaEntFbyI4ospQi3Kw2
FREE

Trend Reversal pro is a histogram type indicator that give long and short signals, the indicator can be traded on its own with following entry rules . Buy Rule, histogram gives green bar. Sell Rule, histogram gives red bar. This indicator doesn't repaint or back paint, this indicator signals are not delayed. -------------------------------------------------------
FREE

Фрактальная дивергенция - это скрытая дивергенция , построенная на фракталах Билла Вильямса. Бычья фрактальная дивергенция представляет собой комбинацию из двух нижних фракталов, последний из которых расположен ниже предыдущего, и при этом две свечи справа от минимума последнего фрактала имеют минимумы выше уровня предыдущего фрактала (см. скриншот 1). Медвежья фрактальная дивергенция - это комбинация из двух соседних верхних фракталов, последний из которых расположен выше, чем предыдущий верхни
FREE

RSI Candle Signal Indicator will change bars’ color when set overbought or oversold levels reach.
How to Use RSI Candle Signal Uptrend/Downtrends - RSI may be used to detect trending markets. For example, the RSI may stay above the mid line 50 in an uptrend. Top and Buttoms - RSI may help in identifying the tops around the overbought readings (usually above 70), and the bottoms around the oversold area (usually below 30). Divergence - divergence occurs when RSI directional movement is not co
FREE

FUNDING DEVIL INDICATOR has been developed by traders for traders and is not another combination out of existing indicators or a "magic, solve all situations" tool.
PASS THE FUNDED ACCOUNTS WITH IT.
It is the answer for beginners and experienced traders about the misleading concepts of the mainstream, causing 90% of retail traders, never making a living out of trading.
Successful traders are "following the smart money" and do NOT try to catch every move from start to end. Consistent traders
FREE

Stop Chasing Trends, Start Sniping Reversals: Introducing Stochastic Sniper Are you tired of trading sideways markets or getting caught by false breakouts? The Stochastic Sniper indicator is engineered for precision entry . It combines the volatility channels of Keltner Bands with the momentum timing of the Stochastic Oscillator to pinpoint extreme price reversals with high accuracy. Think of it as having a sniper scope on the market. It waits for the price to stretch to its maximum, confirms t
FREE

Многие Forex-трейдеры предполагают, что такого понятия как объем на валютном рынке не существует. И будут по-своему правы. Центральной биржевой площадки еще никто не создал. А даже если бы она и была, какие данные об объме она могла бы предоставить? Мы имеем дело с торговой активностью, которая выражается в тиковом объеме. Ведь в конечном итоге объем - это просто проявление активности покупателей и продавцов на рынке. То есть, для получения данных об объеме требуется анализ активности и наоборот
Узнайте, как легко и просто купить торгового робота в MetaTrader AppStore - магазине приложений для платформы MetaTrader.
Платежная система MQL5.community позволяет проводить оплату с помощью PayPal, банковских карт и популярных платежных систем. Кроме того, настоятельно рекомендуем протестировать торгового робота перед покупкой, чтобы получить более полное представление о нем.
Вы упускаете торговые возможности:
- Бесплатные приложения для трейдинга
- 8 000+ сигналов для копирования
- Экономические новости для анализа финансовых рынков
Регистрация
Вход
Если у вас нет учетной записи, зарегистрируйтесь
Для авторизации и пользования сайтом MQL5.com необходимо разрешить использование файлов Сookie.
Пожалуйста, включите в вашем браузере данную настройку, иначе вы не сможете авторизоваться.