KT Volume Profile MT4

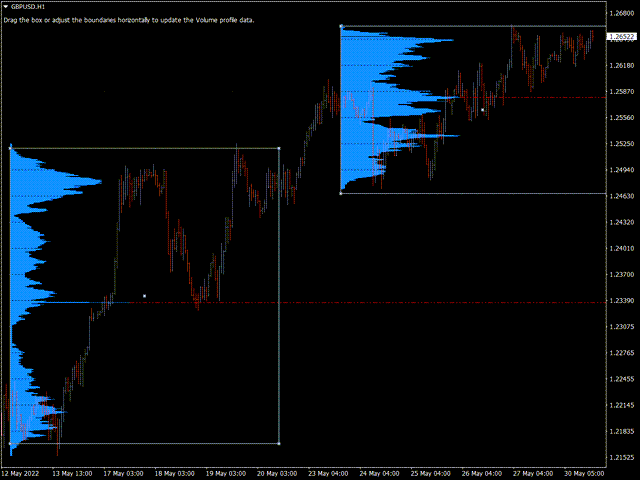
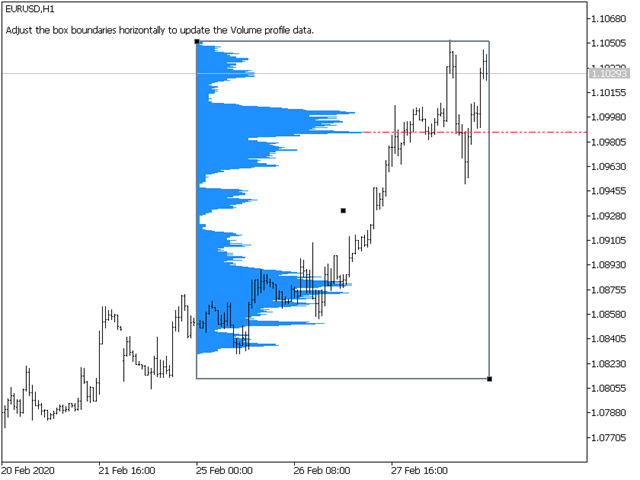
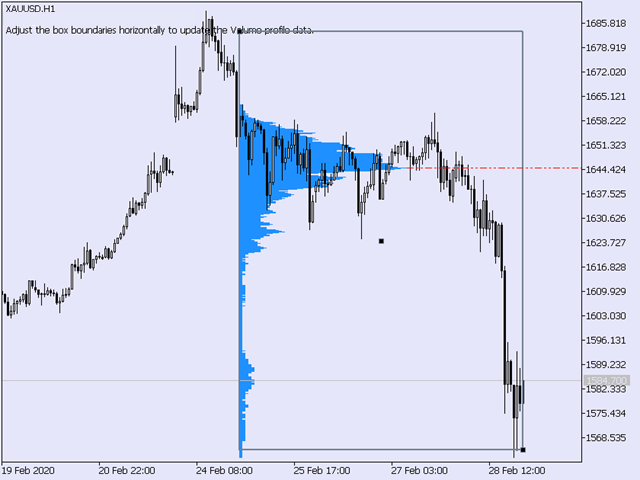
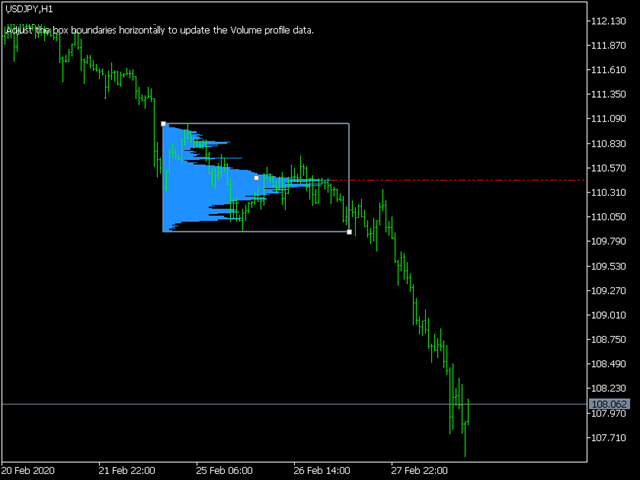
O KT Volume Profile exibe os dados de acumulação de volume como um histograma no eixo Y, permitindo visualizar a atividade de negociação ao longo de determinados períodos e níveis de preço.

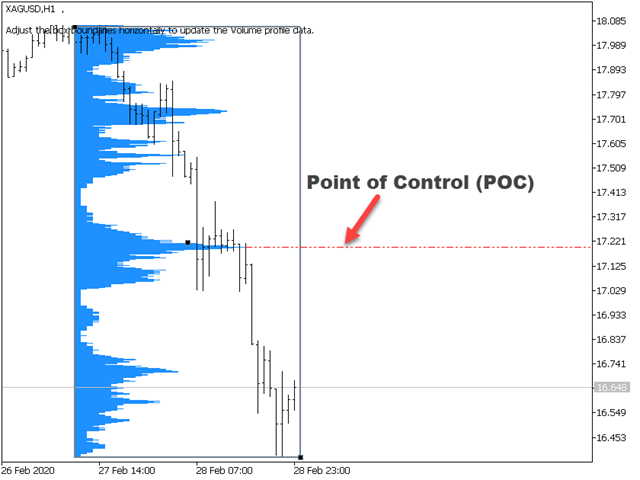
Ponto de Controle (POC) no Perfil de Volume

O POC representa o nível de preço com o maior volume negociado dentro do histograma do perfil de volume. Geralmente, é utilizado como suporte/resistência ou como um nível-chave onde o mercado pode fazer um reteste antes de seguir em uma direção específica.

Recursos

  • Muito fácil de usar. Basta arrastar e soltar o retângulo em qualquer lugar do gráfico para atualizar os dados em tempo real.
  • Pode gerar alertas quando o preço cruza o POC.
  • Codificado do zero, utilizando o mínimo de CPU e memória.

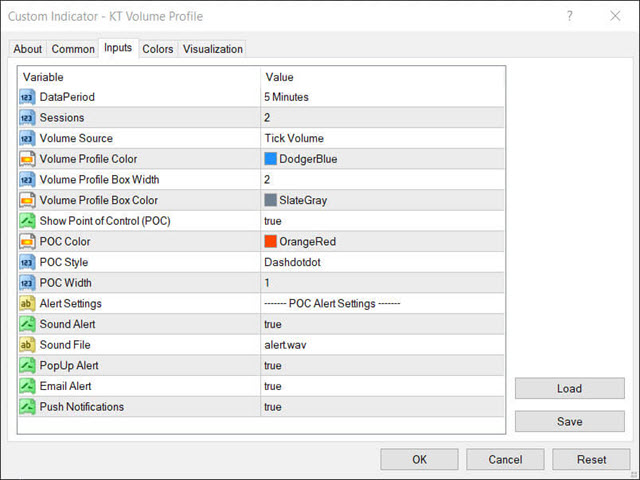
Parâmetros de Entrada

  • Fonte de Volume:  Volume por Tick / Volume Real.
  • Cor do Perfil de Volume:  Cor do histograma do perfil.
  • Largura da Caixa:  Largura do retângulo.
  • Cor da Caixa:  Cor do retângulo.
  • Exibir POC:  true/false
  • Cor do POC:  Cor do nível POC.
  • Estilo do POC:  Estilo da linha POC.
  • Largura do POC:  Espessura da linha POC.
  • Configurações de Alerta:  autoexplicativas.

Volume Real vs Volume por Tick

Obter dados de volume real pode ser difícil para traders de varejo devido à natureza descentralizada do mercado Forex. Se o seu corretor fornecer volume real, o KT Volume Profile pode usá-lo. Caso contrário, será usado o volume por tick, que é amplamente fornecido por corretores.

Em 2011, o experiente trader Caspar Marney publicou uma pesquisa que revelou alta correlação entre o volume por tick e o volume real negociado.

Produtos recomendados
MarketProfileTPO: Análise TPO no MetaTrader 5 O indicador   MarketProfileTPO   para MetaTrader 5 é uma ferramenta poderosa projetada para trazer o conceito de   Perfil de Mercado   ( Market Profile ), baseado na análise de   Oportunidade de Tempo e Preço (TPO) , diretamente para a sua janela principal do gráfico. Este indicador calcula e exibe a distribuição de preços ao longo de um período especificado, destacando as áreas-chave de atividade e concentração do mercado. É particularmente otimiza
BoxChart MT4
Evgeny Shevtsov
4.4 (5)
The market is unfair if only because 10% of participants manage 90% of funds. An ordinary trader has slim changes to stand against these "vultures". This problem can be solved. You just need to be among these 10%, learn to predict their intentions and move with them. Volume is the only preemptive factor that faultlessly works on any timeframe and symbol. First, the volume appears and is accumulated, and only then the price moves. The price moves from one volume to another. Areas of volume accumu
The "MR Volume Profile Rectangles 4" indicator is a charting tool that displays trading volume at different price levels rather than time intervals. A key concept in volume profile is the point of control (POC) —the price level with the highest volume traded during the session or time range. While tools like VWAP or OBV provide volume trends, the "MR Volume Profile Rectangles 4" indicator offers granular detail about where the most market activity occurs at specific price levels. This makes it a
O indicador cria cotações atuais, que podem ser comparadas com as históricas e, com base nisso, fazer uma previsão do movimento dos preços. O indicador possui um campo de texto para navegação rápida até a data desejada. Opções: Símbolo - seleção do símbolo que o indicador exibirá; SymbolPeriod - seleção do período do qual o indicador coletará dados; IndicatorColor - cor do indicador; HorisontalShift - deslocamento das cotações desenhadas pelo indicador pelo número especificado de barras; I
Um indicador técnico que calcula suas leituras nos volumes de negociação. Na forma de histograma, mostra o acúmulo da força do movimento do instrumento de negociação. Possui sistemas de cálculo independentes para direções de alta e baixa. Funciona em quaisquer instrumentos de negociação e prazos. Pode complementar qualquer sistema de negociação. O indicador não redesenha seus valores, os sinais aparecem na vela atual. É fácil de usar e não carrega o gráfico, não requer cálculos de parâmetros adi
UPD1 Profile Levels
Vitaliy Kuznetsov
5 (6)
O indicador localiza os níveis de volume máximo e mínimo de preços (perfil do mercado) no histograma de trabalho para o número especificado de barras.   Perfil composto. A altura do histograma é totalmente automática e se adapta a qualquer instrumento e período de tempo. O algoritmo do autor é usado e não repete análogos conhecidos. A altura dos dois histogramas é aproximadamente igual à altura média da vela. Um alerta inteligente irá ajudá-lo a informar sobre o preço relativo ao nível de volum
VPO Profile MT4
Kyra Nickaline Watson-gordon
5 (2)
Definition : VPO is a Volume Price Opportunity. Instead of using bars or candles with an Open, High, Low, and Close price, each "bar" in a Market Profile is represented by horizontal bars against the price It is called Market Profile terminology. In other words volume-price-opportunity (VPO) profiles are histograms of how many volumes were traded at each price within the span of the profile. By using a VPO chart, you are able to analyze the amount of trading activity, based on volume, for each
Intraday Volume Profile Forex MT4   Intraday Volume Profile  - This is a visualization tool for understanding the high activity zone and low activity zone, as part of the  D1  senior timeframe. The volume profile provides an excellent visual image of supply / demand at each price for the selected timeframe. Introducing  POC  - Point of Control, which indicates the price at which the maximum volume was sold, as well as Value Area - the area where 68% of the instrument's assets are traded. POC  -
AQ XFifteen Pro
HIT HYPERTECH INNOVATIONS LTD
Χ15 indicator is a MetaTrader 4 tool that allows you to  BUILD & BACKTEST ON REAL TIME  your own strategies quickly, easily and efficiently. It contains  15 of the most popular technical analysis indicators  that you can use, each one in a different way. Choose the indicators that you want to use, select how you will use them and you will see on the chart BUY (green) and SELL (red) arrows implementing your strategy. Choose Take Profit and Stop Loss and you will see the results of your strategy w
Order Book
Thomas Bradley Butler
Combine com o Delta Footprint Chart para obter uma imagem completa do perfil de volume do mercado:   https://www.mql5.com/en/market/product/9415 3 O indicador "Order Book" exibe um histograma no gráfico de preços que representa os clusters de volume de compra e venda.   O indicador analisa os dados de preços históricos e calcula os clusters de volume de compra e venda para cada nível de preço dentro de um número especificado de barras. Os clusters de volume de lances são mostrados em azul, en
VolumeProfile
Robert Hess
3.8 (5)
Descption: The Volume Profile displays detailed informations of historical trading activities at certain price levels (Market Profile). So you can locate the areas with the best prices in the market and get an advantage about other market participants. Features: Customizable Volume Profile / Market Profile Shows the "fair" Value Area with 70% of all Volume Shows critical low volume zones Shows VPOC, VAL and VAH Points Works on all timeframes Also available for MT5 ( https://www.mql5.com/en/mark
Concept of  Market Profile  was created at Chicago Board of Trade (CBOT) by trader   Peter Steidlmayer  and first published during the 1980s as CBOT product. Market profile by itself is not a stand-alone strategy, but a different way how you can view the market and make better trading decisions. They have seen a market as an auction process which is affected by supply and demand the same way as every other auction, for example, development of prices of food, gas etc. The price goes up as long th
Delta Single Volume
Chantal Sala
3.67 (3)
Volume Delta is a very powerful indicator that reads the supply on the Market. It calculates the Delta from movement of the price and the difference of BUY and SELL Tick volumes. Its special structure allows you to get all timeframe values available on the MT4 platform. A good observation of this instrument can suggest great entry points and possible reversal. We are confident that this tool will help you to improve your trading timing. See also for MT5:  https://www.mql5.com/en/market/product/5
Blahtech Market Profile
Blahtech Limited
4.53 (15)
Was: $249  Now: $99   Market Profile defines a number of day types that can help the trader to determine market behaviour. A key feature is the Value Area, representing the range of price action where 70% of trading took place. Understanding the Value Area can give traders valuable insight into market direction and establish the higher odds trade. It is an excellent addition to any system you may be using. Blahtech Limited presents their Market Profile indicator for the MetaTrader community. Ins
Blahtech Supply Demand
Blahtech Limited
4.58 (36)
Was: $299  Now: $99   Supply Demand uses previous price action to identify potential imbalances between buyers and sellers. The key is to identify the better odds zones, not just the untouched ones. Blahtech Supply Demand indicator delivers functionality previously unavailable on any trading platform. This 4-in-1 indicator not only highlights the higher probability zones using a multi-criteria strength engine, but also combines it with multi-timeframe trend analysis, previously confirmed swings
Volume Profile Master Pro — Visible Range Volume Profile for MT4 Volume Profile Master Pro brings institutional-grade volume analysis to your MT4 charts. Unlike standard volume indicators that show when volume occurred, this tool shows where — at each price level — giving you a precise map of market activity to identify high-probability trade setups. OVERVIEW The indicator calculates and displays a Visible Range Volume Profile (VRVP) that automatically updates as you scroll the chart. Every time
The indicator calculates volume profiles dynamically and displays the result as VAL, VAH and POC curves. Indicator features The indicator uses the historical data of the lower (relative to the current) timeframes for calculations: M1 - for timeframes up to H1, M5 - for timeframe H1, M15 - for timeframe H4, H1 - for timeframe D1, H4 - for timeframe W1, D1 - for timeframe MN. The color of the DPOC curve sections is determined by comparing the volume of the POC levels of all profiles that make up
Versão MT4: https://www.mql5.com/en/market/product/166784 Versão MT5: https://www.mql5.com/en/market/product/166785 PERFIL DE LIQUIDEZ O PERFIL DE LIQUIDEZ é uma ferramenta visual de estrutura de mercado que mapeia as zonas de liquidez potenciais no gráfico utilizando um perfil dinâmico em formato de mapa de calor. Este indicador analisa a ação histórica do preço e o volume de ticks, destacando as áreas de preço onde a liquidez está provavelmente concentrada. Ele desenha: Linhas de liquidez
The balance of supply and demand is a simple and effective market analysis method. The supply and demand diagram can show you in advance, even before the trend reversal, where the supply ends and the demand is already emerging, where the demand ends and the supply is emerging, while substantially increasing the probability of making a deal in the right direction and with a high profit factor. Indicator Signals The indicator uses the price/volume values to generate signals: ED – excess demand. E
Description The Market Profile & Volume Profile Indicator is a powerful technical analysis tool designed to visualize market activity and price distribution over specific timeframes. Unlike standard technical indicators that focus solely on price over time, this indicator organizes price data to show where the market spent the most time (TPO) and where the most volume was traded (Volume Profile). It automatically calculates and displays key structural levels such as the Point of Control (POC) ,
Ninja Shadow HUD - Minimalist Multi-Analysis Sidebar for MT4 Product Concept: The Invisible Strategic Advisor In the modern trading environment, information overload often leads to analysis paralysis. Excessive indicators on a chart frequently obscure the most critical data: Price Action. Ninja Shadow HUD is designed with the philosophy of "Stealth and Efficiency." Like a "Ninja," it remains hidden in the periphery (sidebar) of your chart, silently monitoring Dow Theory, Currency Strength, an
Simply The Best Pro
Szymon Palczynski
5 (1)
This indicator displays the histogram and arrows on chart. When Simple The Best Pro are placed on a chart, they identify the trend.  The color of may be blue or red. The blue color stands for upside moves and the red color stands for downside trends. The indicator offers to set Stop Loss (SL) and  Take Profit (TP)  setting. The default value is ATR. Indicator has automatic optimization. The STB is a unique indicator that shows the tendency (button Bars) of a particular signals. The STB tells us
This indicator is a conventional analytical tool for tick volumes changes. It calculates tick volumes for buys and sells separately, and their delta on every bar, and displays volumes by price clusters (cells) within a specified bar (usually the latest one). The algorithm used internally is the same as in the indicator VolumeDelta , but results are shown as cumulative volume delta bars (candlesticks). Analogous indicator for MetaTrader 5 exists - VolumeDeltaBars . This is a limited substitution
VPPD - Volume Profile POC Delta *Ferramenta profissional de análise de volume para MetaTrader 4* ---   CARACTERÍSTICAS DO INDICADOR   Capacidades exclusivas: **Volume Profile Avançado** - Histogramas horizontais de volume por períodos selecionados - Identificação precisa do Point of Control (POC) — nível de máximo volume **Análise de Delta (Recurso exclusivo!)** - Cálculo do delta de volume — relação entre compras e vendas - Simulação do movimento de ticks dentro da barra - Codific
VR Grid
Vladimir Pastushak
5 (3)
O indicador VR Grid foi projetado para criar uma grade gráfica com configurações definidas pelo usuário. Ao contrário da grade padrão , a VR Grid é usada para construir níveis circulares . Dependendo da escolha do usuário, o passo entre os níveis de rodada pode ser arbitrário. Além disso, ao contrário de outros indicadores e utilitários, o VR Grid mantém a posição da rede mesmo quando o período de tempo muda ou o terminal é reiniciado. Configurações, arquivos de configuração, versões demo, instr
FREE
VN Trade Panel II
Vyacheslav Nekipelov
4 (1)
The new version of the trading panel, which now has the ability to separately close Buy and Sell orders, display targets for all orders on the chart, as well as the ability to use the panel to trade with brokers working on the FIFO rule. Also, the new version adds option buttons for separate management of open orders. It has a convenient visualized interface and intuitive control without a lot of additional tabs to which traders have to be distracted and switch their attention. Thanks to this,
Volume Compair
Thiago Pereira Pinho
Indicador Profissional de Delta Cumulativo e Mediana de Volume Acompanhe a pressão real de compra/venda com esta poderosa ferramenta de análise de volume. O Volume Compare Indicator combina o Delta Cumulativo e as Medianas de Volume para ajudar você a identificar a atividade institucional, desequilíbrios e potenciais reversões. Principais Recursos:  Histograma de Delta Cumulativo – Visualiza o volume líquido de compra vs. venda em tempo real.  Medianas de Volume de Compra/Venda – Linhas horizont
Volume Candles
Alexander Nikolaev
Volumes are one of the most important factors of trading, as it is the high volumes that move the market in either direction. But there are very few standard indicators for volumes in MetaTrader 4. The Volume Candles analyses the volumes of the trades and displays candles depending on these volumes. The candle appears once the required number of volumes has passed during trading (the VolumeCandle parameter). If the candles close frequently and are thin, then the volumes on the market are current
MarketProfile EForex
Veridiana Adorno Kendrick
O Perfil de Mercado Mostra onde o preço passou mais tempo, destacando níveis importantes que podem ser usados na negociação. É uma ferramenta poderosa que se destina a reunir os componentes fundamentais que compõem cada mercado; preço / volume / tempo, e exibir visualmente sua relação em tempo real à medida que o mercado se desenvolve por um período de tempo pré-determinado. Ferramenta muito poderosa!
Quantum Tick Volumes Indicator
QUANTUM TRADING SOFTWARE LIMITED
5 (1)
Many Forex traders assume there is no volume in the foreign exchange market. And they would be correct. There is no central exchange, not yet anyway. And even if there were, what would it report? What there is however is activity, and this is captured as tick volume. After all, volume is simply displaying activity, the buyers and sellers in the market. So for volume read activity, and for activity read volume – simple. The MT4 platform delivers tick data which the Quantum Tick Volumes indicator
Os compradores deste produto também adquirem
Gann Made Easy
Oleg Rodin
4.83 (157)
Gann Made Easy é um sistema de negociação Forex profissional e fácil de usar, baseado nos melhores princípios de negociação usando a teoria do sr. W. D. Gann. O indicador fornece sinais precisos de COMPRA e VENDA, incluindo níveis de Stop Loss e Take Profit. Você pode negociar mesmo em movimento usando notificações PUSH. ENTRE EM CONTATO COMIGO APÓS A COMPRA PARA RECEBER DICAS DE NEGOCIAÇÃO, BÔNUS E O ASSISTENTE EA "GANN MADE EASY" GRATUITAMENTE! Provavelmente você já ouviu muitas vezes sobre os
M1 Sniper
Oleg Rodin
5 (19)
O M1 SNIPER é um sistema indicador de negociação fácil de usar. É um indicador de seta projetado para o período M1. O indicador pode ser usado como um sistema independente para scalping no período M1 e pode ser usado como parte do seu sistema de negociação existente. Embora este sistema de negociação tenha sido projetado especificamente para negociação no M1, ele também pode ser usado em outros períodos. Originalmente, desenvolvi este método para negociar XAUUSD e BTCUSD. Mas considero-o útil ta
Game Changer Indicator
Vasiliy Strukov
4.13 (23)
Game Changer es un indicador de tendencia revolucionario, diseñado para usarse en cualquier instrumento financiero y transformar su MetaTrader en un potente analizador de tendencias. Funciona en cualquier marco temporal y facilita la identificación de tendencias, señala posibles reversiones, actúa como mecanismo de trailing stop y proporciona alertas en tiempo real para una respuesta rápida del mercado. Tanto si es un profesional experimentado como si es un principiante que busca una ventaja com
Scalper Inside PRO
Alexey Minkov
4.74 (69)
An exclusive indicator that utilizes an innovative algorithm to swiftly and accurately determine the market trend. The indicator automatically calculates opening, closing, and profit levels, providing detailed trading statistics. With these features, you can choose the most appropriate trading instrument for the current market conditions. Additionally, you can easily integrate your own arrow indicators into Scalper Inside Pro to quickly evaluate their statistics and profitability. Scalper Inside
Dynamic Forex28 Navigator
Bernhard Schweigert
4.43 (7)
Dynamic Forex28 Navigator - A ferramenta de negociação Forex de última geração. ATUALMENTE 49% DE DESCONTO. Dynamic Forex28 Navigator é a evolução dos nossos indicadores populares de longa data, combinando o poder de três em um: Indicador Advanced Currency Strength28 (695 avaliações) + Advanced Currency IMPULSE com ALERTA (520 avaliações) + Sinais CS28 Combo (Bônus). Detalhes sobre o indicador https://www.mql5.com/en/blogs/post/758844 O que o Next-Generation Strength Indicator oferece?  Tudo
Atomic Analyst
Issam Kassas
5 (3)
Primeiramente, vale ressaltar que este Indicador de Negociação não repinta, não redesenha e não apresenta atrasos, tornando-o ideal tanto para negociação manual quanto automatizada. Manual do utilizador: configurações, entradas e estratégia. O Analista Atômico é um Indicador de Ação de Preço PA que utiliza a força e o momentum do preço para encontrar uma vantagem melhor no mercado. Equipado com filtros avançados que ajudam a remover ruídos e sinais falsos, e aumentam o potencial de negociação.
GOLD Impulse with Alert
Bernhard Schweigert
4.64 (11)
Este indicador é uma super combinação dos nossos 2 produtos Advanced Currency IMPULSE with ALERT  +   Currency Strength Exotics . Funciona para todos os períodos de tempo e mostra graficamente impulso de força ou fraqueza para as 8 principais moedas mais um Símbolo! Este Indicador é especializado para mostrar a aceleração da força da moeda para quaisquer símbolos como Ouro, Pares Exóticos, Commodities, Índices ou Futuros. É o primeiro do seu género, qualquer símbolo pode ser adicionado à 9ª
Scalper Vault
Oleg Rodin
5 (36)
Scalper Vault é um sistema profissional de escalpelamento que fornece tudo o que você precisa para um escalpelamento bem-sucedido. Este indicador é um sistema de negociação completo que pode ser usado por comerciantes de forex e opções binárias. O período de tempo recomendado é M5. O sistema fornece sinais de seta precisos na direção da tendência. Ele também fornece sinais superiores e inferiores e níveis de mercado Gann. Os indicadores fornecem todos os tipos de alertas, incluindo notificações
Supply and Demand Dashboard PRO
Bernhard Schweigert
4.8 (20)
Actualmente 40% OFF ! Este painel é uma peça de software muito poderosa que trabalha em múltiplos símbolos e até 9 prazos. Baseia-se no nosso principal indicador (Melhores críticas: Advanced Supply Demand ).   O tablier dá uma óptima visão geral. Mostra:   Valores filtrados da Oferta e da Procura, incluindo a classificação da força da zona, Distâncias de/para as zonas e dentro das zonas, Destaca as zonas aninhadas, Dá 4 tipos de alertas para os símbolos escolhidos em todos os (9) períodos de
Trend Screener
STE S.S.COMPANY
4.79 (95)
Indicador de tendência, solução única inovadora para negociação e filtragem de tendências com todos os recursos de tendências importantes construídos dentro de uma ferramenta! É um indicador multi-timeframe e multi-moedas 100% sem repintura que pode ser usado em todos os símbolos/instrumentos: forex, commodities, criptomoedas, índices e ações. OFERTA POR TEMPO LIMITADO: O indicador Support and Resistance Screener está disponível por apenas US$ 50e vitalício. (Preço original US$ 250) (oferta este
Actualmente 40% OFF ! A melhor solução para qualquer novato ou comerciante especializado! Este software de painel de instrumentos está a funcionar em 28 pares de moedas. É baseado em 2 dos nossos principais indicadores (Advanced Currency Strength 28 e Advanced Currency Impulse). Dá uma grande visão geral de todo o mercado Forex. Mostra valores avançados de força da moeda, velocidade de movimento da moeda e sinais para 28 pares de divisas em todos os (9) períodos de tempo. Imagine como a sua n
Se você comprar este indicador, receberá meu Gerenciador de Operações Profissional   + EA  GRATUITAMENTE. Primeiramente, vale ressaltar que este Sistema de Trading é um Indicador Não Repintado, Não Redesenho e Não Atrasado, o que o torna ideal tanto para o trading manual quanto para o automatizado. Curso online, manual e download de predefinições. O "Sistema de Trading Inteligente MT5" é uma solução completa de trading projetada para traders novos e experientes. Ele combina mais de 10 indicador
FX Power MT4 NG
Daniel Stein
4.95 (21)
FX Power: Analise a Força das Moedas para Decisões de Negociação Mais Inteligentes Visão Geral FX Power é a sua ferramenta essencial para compreender a força real das principais moedas e do ouro em quaisquer condições de mercado. Identificando moedas fortes para comprar e fracas para vender, FX Power simplifica as decisões de negociação e revela oportunidades de alta probabilidade. Quer você prefira seguir tendências ou antecipar reversões usando valores extremos de Delta, esta ferramenta adap
Volatility Trend System - um sistema de negociação que dá sinais para entradas. O sistema de volatilidade fornece sinais lineares e pontuais na direção da tendência, bem como sinais para sair dela, sem redesenho e atrasos. O indicador de tendência monitora a direção da tendência de médio prazo, mostra a direção e sua mudança. O indicador de sinal é baseado em mudanças na volatilidade e mostra entradas no mercado. O indicador está equipado com vários tipos de alertas. Pode ser aplicado a vários i
El indicador "MR BEAST ALERTAS DE LIQUIDEZ" es una herramienta avanzada diseñada para proporcionar señales y alertas sobre la liquidez del mercado basándose en una serie de indicadores técnicos y análisis de tendencias. Ideal para traders que buscan oportunidades de trading en función de la dinámica de precios y los niveles de volatilidad, este indicador ofrece una visualización clara y detallada en la ventana del gráfico de MetaTrader. Características Principales: Canal ATR Adaptativo: Calcula
RFI levels PRO
Roman Podpora
5 (1)
O indicador mostra com precisão os pontos de reversão e as zonas de retorno de preço onde o   Principais players . Você identifica onde novas tendências estão se formando e toma decisões com máxima precisão, mantendo o controle sobre cada negociação. VERSION MT5     -     Revela seu potencial máximo quando combinado com o indicador   TREND LINES PRO. O que o indicador mostra: Estruturas de reversão e níveis de reversão com ativação no início de uma nova tendência. Exibição dos níveis de   TAKE
PZ Harmonacci Patterns
PZ TRADING SLU
3.17 (6)
Este é sem dúvida o indicador de reconhecimento automático de formação de preço harmônico mais completo que você pode encontrar para a MetaTrader Platform. Ele detecta 19 padrões diferentes, leva as projeções de Fibonacci tão a sério quanto você, exibe a Zona de Reversão Potencial (PRZ) e encontra níveis adequados de stop loss e take-profit. [ Guia de instalação | Guia de atualização | Solução de problemas | FAQ | Todos os produtos ] Detecta 19 formações harmônicas de preços diferentes Traça
Weis Wave with Alert
Trade The Volume Waves Single Member P.C.
4.82 (22)
Rental/Lifetime Package Options and Privileges' Rent Monthly Six Months   Yearly/Lifetime Weis Wave with Speed with Alert+Speed Index x x x Manual  x x x Quick Set up Video x x x Blog x x x Lifetime Updates x x x Setup and Training Material x x Rectangle Break Alert Tool      x Discord Access Channel "The SI traders" x   How to trade info visit:    http://www.tradethevolumewaves.com   ** If you purchase please contact me to setup your  : training Room and  complete manual access.  This is
Apollo Secret Trend é um indicador de tendência profissional que pode ser usado para encontrar tendências em qualquer par e período de tempo. O indicador pode facilmente se tornar seu principal indicador de negociação, que você pode usar para detectar tendências de mercado, não importa qual par ou período de tempo você prefira negociar. Ao usar um parâmetro especial no indicador, você pode adaptar os sinais ao seu estilo de negociação pessoal. O indicador fornece todos os tipos de alertas, inclu
Um indicador técnico que estrutura gráficos e identifica movimentos cíclicos de preços. Pode funcionar em qualquer gráfico. Vários tipos de notificações. Existem setas adicionais no próprio gráfico. Sem redesenhar a história, trabalha no fecho da vela. TF recomendado a partir de M5 e superior. Parâmetros fáceis de utilizar e configurar. Ao utilizar 2 indicadores com parâmetros diferentes, pode utilizá-los sem outros indicadores. Tem 2 parâmetros de entrada Ciclicidade e duração do sinal Estes
Currency Strength Wizard é um indicador muito poderoso que fornece uma solução completa para uma negociação bem-sucedida. O indicador calcula o poder deste ou daquele par forex usando os dados de todas as moedas em vários intervalos de tempo. Esses dados são representados em uma forma de índice de moeda fácil de usar e linhas de energia de moeda que você pode usar para ver o poder desta ou daquela moeda. Tudo o que você precisa é anexar o indicador ao gráfico que deseja negociar e o indicador mo
Advanced Supply Demand
Bernhard Schweigert
4.91 (299)
Atualmente com 40% de desconto! A melhor solução para qualquer Trader Novato ou especialista! Este indicador é uma ferramenta de negociação exclusiva, de alta qualidade e acessível porque incorporamos uma série de recursos proprietários e uma nova fórmula. Com esta atualização, você poderá mostrar fusos horários duplos. Você não só será capaz de mostrar um TF mais alto, mas também mostrar ambos, o TF do gráfico, MAIS o TF mais alto: MOSTRANDO ZONAS ANINHADAS. Todos os traders de Oferta e Demanda
Slayer Binary
Abdulkarim Karazon
5 (1)
Slayer Binary é um indicador de seta de uma vela com opções binárias. Esse indicador não é para quem busca o santo graal, pois é uma abordagem irrealista para o trading em geral. O indicador apresenta uma taxa de acerto constante e, se usado com gestão de dinheiro e uma meta diária, será ainda mais confiável. O indicador vem com muitos recursos listados abaixo: RECURSOS SEM REPINTURA: O indicador não repinta suas setas em tempo real;Uma vez que uma seta é dada, ela permanece lá mesmo que o pre
Trend Lines PRO
Roman Podpora
5 (1)
LINHAS DE TENDÊNCIA PRO       Ajuda a entender onde o mercado está realmente mudando de direção. O indicador mostra inversões de tendência reais e pontos onde os principais participantes retornam ao mercado. Você vê     Linhas BOS     Análise de tendências e níveis-chave em prazos maiores — sem configurações complexas ou ruídos desnecessários. Os sinais não são repintados e permanecem no gráfico após o fechamento da barra. VERSÃO MT 5      -      Revela seu potencial máximo quando emparelhada co
O sistema PRO Renko é um sistema de negociação altamente preciso especialmente concebido para a negociação de gráficos RENKO. Trata-se de um sistema universal que pode ser aplicado a vários instrumentos de negociação. O sistema neutraliza eficazmente o chamado ruído de mercado, dando-lhe acesso a sinais de inversão precisos. O indicador é muito fácil de usar e tem apenas um parâmetro responsável pela geração de sinal. Você pode facilmente adaptar a ferramenta a qualquer instrumento de negocia
O Top Bottom Tracker é um indicador baseado em algoritmos sofisticados que analisa a tendência do mercado e pode detetar os altos e baixos da tendência / Versão MT5 . O preço aumentará progressivamente até atingir 500$. Próximo preço --> $99 Características Sem repintura Este indicador não altera os seus valores quando chegam novos dados Pares de negociação Todos os pares de forex Timeframe   Todos os timeframes Parâmetros ==== Configuração do indicador ==== Parâmetro de configuração
Currency Strength Exotics
Bernhard Schweigert
4.88 (33)
ACTUALMENTE 20% DE DESCONTO ! A melhor solução para qualquer novato ou comerciante especializado! Este Indicador é especializado para mostrar a força da moeda para quaisquer símbolos como Pares Exóticos de Commodities, Índices ou Futuros. É o primeiro do seu género, qualquer símbolo pode ser adicionado à 9ª linha para mostrar a verdadeira força da moeda de Ouro, Prata, Petróleo, DAX, US30, MXN, TRY, CNH etc. Esta é uma ferramenta de negociação única, de alta qualidade e acessível, porque inco
No Repaint Bext
Andrey Kozak
1 (1)
No Repaint Bext is a ready-made trading system. Shows when to open and when to close trades, as well as in which direction. Every time a green arrow appears, you need to open a buy trade. Close all buy trades when a red arrow appears. The same goes for the opposite direction, every time a red arrow appears, open sell trades and close them all when a green arrow appears. We use the M5 timeframe for trading. You can trade on any cozy pair. This indicator does not repaint and practically does not
Are you looking for a simple and reliable indicator that can help you spot market swing points easily? Do you want clear buy and sell signals that work on any timeframe and any trading instrument? Buy Sell Signal Pro is designed to do exactly that. It helps traders identify important market turning points and understand the current market structure in a clear and easy way. This indicator detects Higher Highs (HH), Higher Lows (HL), Lower Highs (LH), and Lower Lows (LL) so you can quickly see wh
TrendLine PRO MT4
Evgenii Aksenov
4.83 (167)
The Trend Line PRO indicator is an independent trading strategy. It shows the trend change, the entry point to the transaction, as well as automatically calculates three levels of Take Profit and Stop Loss protection. Trend Line PRO is perfect for all Meta Trader symbols: currencies, metals, cryptocurrencies, stocks and indices. The indicator is used in trading on real accounts, which confirms the reliability of the strategy. Robots using   Trend Line PRO   and real Signals can be found here:   
Mais do autor
KT Momentum Arrows MT5
KEENBASE SOFTWARE SOLUTIONS
5 (2)
O indicador KT Momentum Arrows é baseado em uma quebra momentânea que é calculada usando a variação das bandas e a volatilidade emergente em determinada direção. Um sinal de compra é gerado quando o preço fecha acima da banda superior, e um sinal de venda é gerado quando o preço fecha abaixo da banda inferior. Um coeficiente de magnitude é utilizado como parâmetro de entrada, influenciando tanto a variação das bandas quanto a medição da volatilidade. O valor desse coeficiente deve ser escolhido
KT Asian Breakout
KEENBASE SOFTWARE SOLUTIONS
4 (1)
KT Asian Breakout carefully analyzes the range-bound market during the Asian session and then fires a long or short trade after doing some preassessment based on its inbuilt technical analysis module. The executed orders are closed within a day before the completion of the next day session. The inbuilt technical analysis module checks for the session range and compares it with the last 20 days price movement. If it finds any erratic price movement within the session, the orders are not executed
Use of support and resistance in systematic trading is very subjective. Every trader has their own idea and way to plotting the support and resistance levels on the chart. KT Support and Resistance indicator take out this ambiguity out of the situation and automatically draws support and resistance levels following an algorithmic approach using a unique multi-timeframe analysis. When launched on the chart, It immediately scan the most significant extreme points across all the available timefra
ACB Breakout Arrows
KEENBASE SOFTWARE SOLUTIONS
4.15 (34)
O indicador ACB Breakout Arrows fornece um sinal de entrada essencial no mercado ao detectar um padrão especial de rompimento. Ele monitora constantemente o gráfico em busca de um momento de estabilização direcional e oferece um sinal preciso pouco antes de um grande movimento.  Obtenha o scanner multissímbolo e multitemporal aqui - Scanner para ACB Breakout Arrows MT4 Principais recursos O indicador fornece níveis de Stop Loss e Take Profit. Acompanha um painel de Scanner MTF que monitora sina
ACB Breakout Arrows MT5
KEENBASE SOFTWARE SOLUTIONS
5 (1)
O indicador ACB Breakout Arrows fornece um sinal de entrada crucial no mercado ao detectar um padrão especial de rompimento. O indicador escaneia constantemente o gráfico em busca de um momento de consolidação em uma direção e fornece o sinal preciso logo antes do movimento principal. Obtenha o scanner de múltiplos ativos e múltiplos períodos aqui - Scanner para ACB Breakout Arrows MT5 Principais recursos Níveis de Stop Loss e Take Profit são fornecidos pelo indicador. Acompanha um painel Scan
KT RSI Divergence Robot MT4
KEENBASE SOFTWARE SOLUTIONS
O KT RSI Divergence robot é um Expert Advisor 100 % automatizado que negocia divergências regulares e ocultas formadas entre o preço e o oscilador Relative Strength Index (RSI). Os sinais de divergência são obtidos do nosso indicador gratuito RSI Divergence. Nem toda divergência resulta numa reversão de preço bem-sucedida; por isso este EA combina os sinais brutos de divergência com o seu módulo interno de análise técnica para explorar a ineficiência de preço que surge após algumas divergência
KT CCI Divergence MT5
KEENBASE SOFTWARE SOLUTIONS
KT CCI Divergence shows the regular and hidden divergence created between the price and CCI oscillator. Divergence is one of the vital signals that depicts the upcoming price reversal in the market. Manually spotting the divergence between price and CCI can be a hectic and ambiguous task. Limitations of KT CCI Divergence   Using the CCI divergence as a standalone entry signal can be risky. Every divergence can't be interpreted as a strong reversal signal. For better results, try to combine it w
ACB Trade Filter MT4
KEENBASE SOFTWARE SOLUTIONS
5 (1)
The ACB Trade Filter indicator provides a solution for filtering out the low probability trading setups in a trading strategy. The indicator uses a sophisticated filtration algorithm based on the market sentiment and trend. Applications Works great with our indicator " ACB Breakout Arrows ". Filter out low probability signals from any indicator. Avoid overtrading and minimize the losses. Trade in the direction of market sentiment and trend. Avoid the choppiness in the market. How to use Only L
KT Momentum Arrows
KEENBASE SOFTWARE SOLUTIONS
O indicador KT Momentum Arrows é baseado em uma quebra momentânea que é calculada usando a variação das bandas e a volatilidade emergente em determinada direção. Um sinal de compra é gerado quando o preço fecha acima da banda superior, e um sinal de venda é gerado quando o preço fecha abaixo da banda inferior. Um coeficiente de magnitude é utilizado como parâmetro de entrada, influenciando tanto a variação das bandas quanto a medição da volatilidade. O valor desse coeficiente deve ser escolhido
KT COG Advanced MT4
KEENBASE SOFTWARE SOLUTIONS
1 (1)
KT COG is an advanced implementation of the center of gravity indicator presented by John F. Ehlers in the May 2002 edition of Technical Analysis of Stocks & Commodities magazine. It's a leading indicator which can be used to identify the potential reversal points with the minimum lag. The COG oscillator catches the price swings quite effectively. MT5 version of the same indicator is available here KT COG Advanced MT5 Calculation of COG The COG indicator is consist of the two lines. The main l
KT Pin Bar
KEENBASE SOFTWARE SOLUTIONS
KT Pin Bar identifies the pin bar formation which is a type of price action pattern which depicts a sign of reversal or rejection of the trend. When combined with support and resistance, BRN and other significant levels, Pin Bar pattern proved to be a very strong sign of reversal. Basically, a pin bar is characterized by a small body relative to the bar length which is closed either in upper or lower 50% part of its length. They have very large wicks and small candle body. A pin bar candlestic
KT Trend Magic
KEENBASE SOFTWARE SOLUTIONS
KT Trend Magic shows the trend depiction on chart using the combination of market momentum and volatility. A smoothing coefficient is used to smooth out the noise from the signal.It can be used to find out the new entries or confirm the trades produced by other EA/Indicators. Usage Drag n drop MTF scanner which scans for the new signals across multiple time-frames. Find new entries in the trend direction. Improve the accuracy of other indicators when used in conjunction. Can be used as a dynami
KT Auto Fibo
KEENBASE SOFTWARE SOLUTIONS
O KT Auto Fibo desenha automaticamente os níveis de retração de Fibonacci com base na direção atual da tendência. Os pontos máximos e mínimos são selecionados automaticamente usando os valores máximos e mínimos disponíveis no gráfico. Você pode dar zoom e rolar o gráfico para ajustar os níveis de Fibonacci conforme necessário. Modos Automático:  Desenha automaticamente os níveis de Fibonacci com base na área do gráfico. Manual: Desenha os níveis de Fibonacci apenas uma vez. Depois disso, você p
KT Psar Arrows
KEENBASE SOFTWARE SOLUTIONS
O KT Psar Arrows plota setas no gráfico utilizando o indicador padrão Parabolic SAR. Uma seta de alta é desenhada quando a máxima da vela toca o SAR. Uma seta de baixa é desenhada quando a mínima da vela toca o SAR. Os sinais são gerados em tempo real, sem a necessidade de esperar o fechamento da vela.  Recursos Uma ferramenta útil para traders que desejam experimentar estratégias de negociação que envolvem o indicador Parabolic SAR.  Pode ser usado para identificar pontos de reversão no mercad
KT Ichimoku Trader
KEENBASE SOFTWARE SOLUTIONS
1 (1)
KT Ichimoku Trader is a fully automated expert advisor that offers five popular trading strategies based on the Ichimoku indicator. Each strategy has it's own entry and exit method without any interference to other strategies. The Ichimoku system can be applied to all major currency pairs and metals. However, we found that it performs reasonably well mainly on two pairs.   MT5 Version is available here  https://www.mql5.com/en/market/product/35043 Features Trade up to 5 famous trading strategi
KT Volatility Oscillator
KEENBASE SOFTWARE SOLUTIONS
O Oscilador de Volatilidade KT analisa os dados de mercado passados e atuais utilizando uma fórmula matemática para exibir o resultado na forma de um oscilador. As ondas crescentes e decrescentes equivalem a alta e baixa volatilidade do ativo.  Em resumo, a volatilidade é simplesmente uma medida das flutuações de preço de um ativo ao longo de um determinado período de tempo. Sem volatilidade, haveria pouco movimento no mercado e os traders não poderiam lucrar com as variações de preço. Uso da V
KT COG Robot
KEENBASE SOFTWARE SOLUTIONS
KT COG Robot is a fully automated Expert Advisor based on the KT COG Indicator . The COG indicator was originally presented by John F. Ehlers in the May 2002 edition of Technical Analysis of Stocks & Commodities magazine. The EA fires a long trade when COG line cross above the signal line and a short trade is fired when the COG line cross below the signal line.  Adaptive Filtration Our adaptive filtration algorithm combines the original COG formula with the major trend direction and market acce
ACB Breakout Arrows EA
KEENBASE SOFTWARE SOLUTIONS
Este é um Expert Advisor 100% automatizado baseado no nosso indicador personalizado chamado "ACB Breakout Arrows" . As entradas são baseadas em um padrão de rompimento que ocorre constantemente em ambas as direções. A intensidade dos sinais pode ser ajustada com o parâmetro externo "Signal Sensitivity". Confirmação de operações O ACB Breakout Arrows EA oferece a capacidade de filtrar entradas usando outro de nossos indicadores personalizados chamado ACB Trade Filter . Compra forte: Seta para c
KT London Breakout
KEENBASE SOFTWARE SOLUTIONS
First thirty minutes are essential for a trading session. The early reaction of traders and market players sets a path for the rest of the day. KT London Breakout EA takes advantage of this phenomenon, and after analyzing the first thirty minutes of London session, it places two bidirectional pending orders. One of pending order is eventually canceled after realizing the market direction with certainty. It has been strictly tested and developed for EUR/JPY using 30-Min Time Frame. You can expe
Use of support and resistance in systematic trading is very subjective. Every trader has their own idea and way to plotting the support and resistance levels on the chart. KT Support and Resistance indicator take out this ambiguity out of the situation and automatically draws support and resistance levels following an algorithmic approach using a unique multi-timeframe analysis. When launched on the chart, It immediately scan the most significant extreme points across all the available timefra
Se você negocia Forex, ter informações detalhadas sobre a força das moedas e a correlação entre os pares pode levar suas operações a um novo patamar. A correlação ajudará a reduzir o risco pela metade, enquanto a análise de força ajudará a maximizar os lucros. Este indicador oferece uma abordagem híbrida para selecionar os pares de moedas mais adequados, combinando análise de força e correlação entre pares de moedas. Como usar a Análise de Força das Moedas Suponha que sua estratégia de negociaç
MACD Divergence Seeker
KEENBASE SOFTWARE SOLUTIONS
KT MACD Divergence Seeker trades the regular and hidden divergence signals generated by our free indicator named KT MACD Divergence indicator. Trading the standalone divergences can be a risky affair that's why the KT MACD Divergence Seeker combines the standard divergence signals with an advanced analysis module to exploit the price inefficiencies on some FX pairs. What is the Divergence exactly? As a general conception if the price is making higher highs, then macd should also be making hig
KT Asian Breakout Indicator
KEENBASE SOFTWARE SOLUTIONS
O indicador KT Asian Breakout analisa uma parte crítica da sessão asiática para gerar sinais de compra e venda em ambas as direções, com base na quebra de preço. Um sinal de compra ocorre quando o preço rompe acima da máxima da sessão, enquanto um sinal de venda ocorre quando o preço rompe abaixo da mínima da sessão. Coisas para lembrar Se a caixa da sessão for muito ampla verticalmente, deve-se evitar uma nova negociação, pois a maior parte da ação do preço já ocorreu dentro da sessão. Se a ve
MACD Divergence MT4
KEENBASE SOFTWARE SOLUTIONS
O KT MACD Divergence mostra as divergências regulares e ocultas formadas entre o preço e o oscilador. Se sua estratégia de trading antecipa uma reversão de tendência, você pode usar a divergência regular do MACD para identificar possíveis pontos de virada. Já se sua estratégia é baseada na continuação da tendência, a divergência oculta do MACD será uma boa escolha. Limitações do KT MACD Divergence Usar a divergência do MACD como único sinal de entrada pode ser arriscado. Nem toda divergência d
KT Bollinger Bands Trader MT4
KEENBASE SOFTWARE SOLUTIONS
O KT Bollinger Bands Trader é um consultor especializado 100% automatizado que utiliza uma estratégia de reversão à média com base nas Bandas de Bollinger durante períodos de baixa volatilidade. O preço frequentemente reage nas linhas superior ou inferior das bandas, mas a reversão nem sempre ocorre. No entanto, as chances de reversão aumentam em momentos de baixa volatilidade. Entradas Uma compra é ativada quando o preço se alinha corretamente abaixo da linha inferior das Bandas de Bollinger.
KT CCI Divergence MT4
KEENBASE SOFTWARE SOLUTIONS
KT CCI Divergence shows the regular and hidden divergence created between the price and CCI oscillator. Divergence is one of the vital signals that depicts the upcoming price reversal in the market. Manually spotting the divergence between price and CCI can be a hectic and ambiguous task. Limitations of KT CCI Divergence   Using the CCI divergence as a standalone entry signal can be risky. Every divergence can't be interpreted as a strong reversal signal. For better results, try to combine it w
KT Heiken Ashi Smoothed MT4
KEENBASE SOFTWARE SOLUTIONS
KT Heiken Ashi Smoothed é uma versão suavizada do Heiken Ashi padrão e ainda exibe setas de compra/venda quando ocorre mudança de tendência. Seta de compra quando o estado muda de baixista para altista. Seta de venda quando o estado muda de altista para baixista. Alertas por push móvel, email, som e pop-up incluídos. O que é exatamente o Heiken Ashi Smoothed? Ele filtra sinais falsos e ruídos presentes no Heiken Ashi padrão aplicando duas médias móveis para suavizar o preço. Ignorando um leve
KT MA Crossover MT4
KEENBASE SOFTWARE SOLUTIONS
O KT MA Crossover desenha setas de compra e venda com base no cruzamento das médias móveis selecionadas. Além disso, ele também gera os alertas apropriados e exibe o valor de MFE (Excursão Mais Favorável) para cada sinal consecutivo. O cruzamento de médias móveis é uma das estratégias mais utilizadas por traders em todo o mundo. Normalmente envolve uma média móvel rápida e uma lenta para identificar sinais de compra e venda com base na direção do cruzamento. Sinal de compra – quando a média móv
KT Round Numbers MT4
KEENBASE SOFTWARE SOLUTIONS
KT Round Numbers plots the round number levels which are also commonly known as psychological levels in the Forex world. In the context of Forex trading, round number levels are those levels in which there are two or more zeroes at the end. They are named as 00 levels on the chart. Some traders also consider the halfway points as a valid round number level. They are named as 50 levels on the chart. Use of round number levels in trading Round number levels work as strong support and resistance
KT Inside Bar Advanced MT4
KEENBASE SOFTWARE SOLUTIONS
Despite the popularity of inside bar pattern among the traders, using it as a standalone signal doesn't provide any edge in the market. KT Inside Bar Advanced indicator solves this problem by combining the classic inside bar pattern with the "ECE" cycle and Fibonacci extensions. Using this indicator in place of our classic inside bar indicator will provide a tremendous advantage and edge in the market. What is the ECE cycle? In financial markets, the price never moves in a straight line but u
Filtro:
Mirco76 Rossini
32
Mirco76 Rossini 2022.08.15 13:40 
 

O usuário não deixou nenhum comentário para sua avaliação

MiloyFry_0434
49
MiloyFry_0434 2022.04.12 19:50 
 

O usuário não deixou nenhum comentário para sua avaliação

KEENBASE SOFTWARE SOLUTIONS
55218
Resposta do desenvolvedor Nitin Raj 2022.04.12 20:25
Hello, apologies for the late response. It’s not our active office hours. The kt volume profile indicator is well optimized and it should not freeze your mt4 in any case. Have you checked the Experts and Journal tab to see if there are any errors or warning when you load the indicator on chart?
Responder ao comentário