KT Volume Profile MT4
- 지표
-
KEENBASE SOFTWARE SOLUTIONS
 Keenbase Trading은 트레이더가 더욱 정확하고 신뢰할 수 있는 거래 결정을 내릴 수 있도록 MetaTrader 4 및 MetaTrader 5용 전문 지표와 Expert Advisor(EA)를 개발합니다.
당사의 제품은 실전에서 활용할 수 있는 거래 로직과 직관적인 사용자 경험을 결합하여 안정성, 사용 편의성, 그리고 체계적인 리스크 관리에 중점을 두고 설계되었습니다. 모든 도구는 철저한 테스트를 거쳐 실제 시장 환경에서도 일관되고 안정적인 성능을 제공할 수 있도록 개발됩니다. - 버전: 2.0
- 업데이트됨: 30 5월 2022
- 활성화: 5
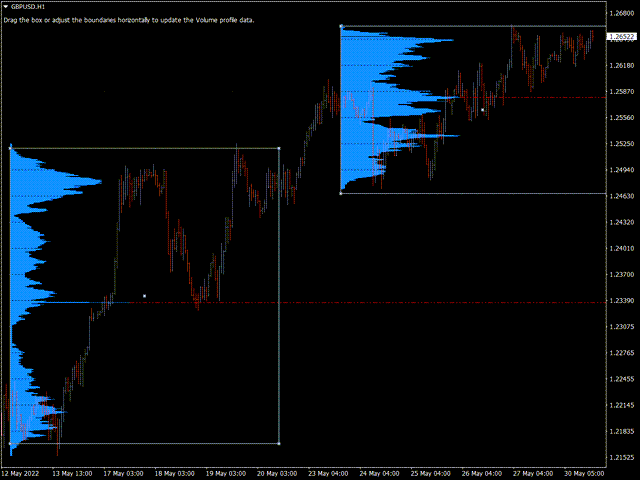
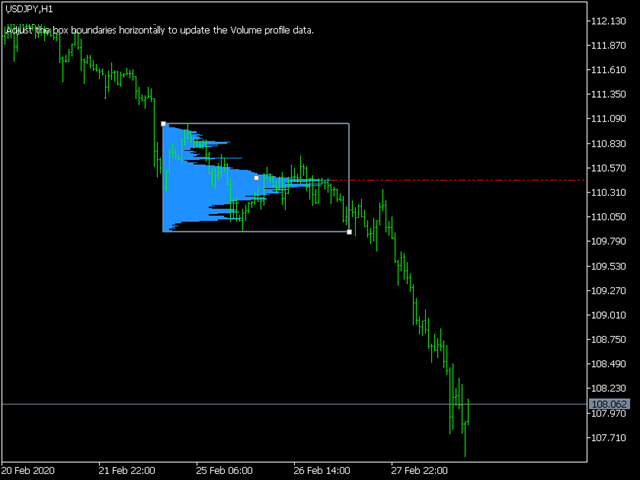
KT Volume Profile은 Y축에 히스토그램 형태로 거래량 누적 데이터를 시각화하여, 특정 시간대 및 가격 수준에서의 거래 활동을 확인할 수 있게 해주는 도구입니다. 이 기능은 트레이더가 거래가 집중된 가격 구간을 식별하는 데 매우 유용합니다.
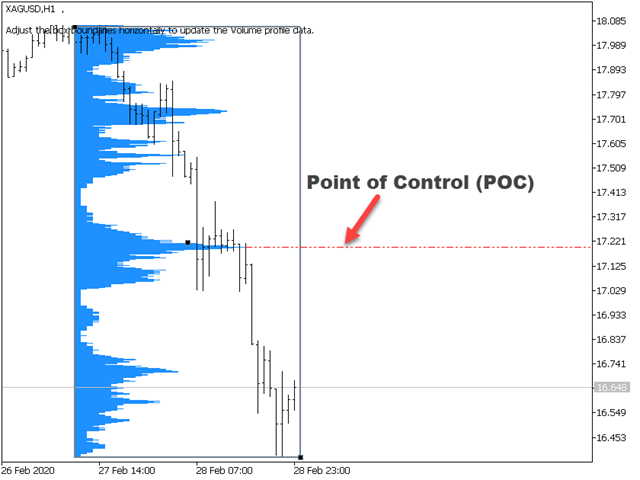
볼륨 프로파일에서의 POC (Point of Control)
POC는 전체 프로파일 중 가장 많은 거래량이 발생한 가격 수준을 나타냅니다. 일반적으로 주요 지지 또는 저항 영역으로 활용되며, 시장이 본격적인 방향 전환 전에 되돌림을 보이는 핵심 레벨로 작용할 수 있습니다.
주요 기능
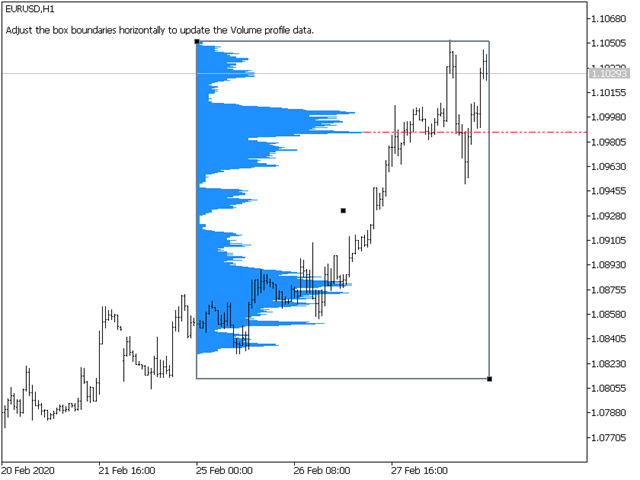
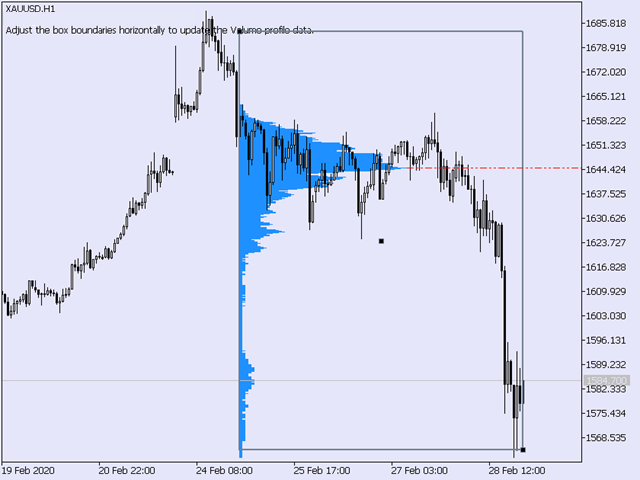
- 사용법이 매우 간단합니다. 사각형을 차트에서 드래그 앤 드롭하면 실시간으로 볼륨 프로파일이 업데이트됩니다.
- 가격이 POC를 돌파할 경우 알림을 설정할 수 있습니다.
- 처음부터 경량화된 코드로 설계되어 CPU 및 메모리 자원 사용이 최소화됩니다.
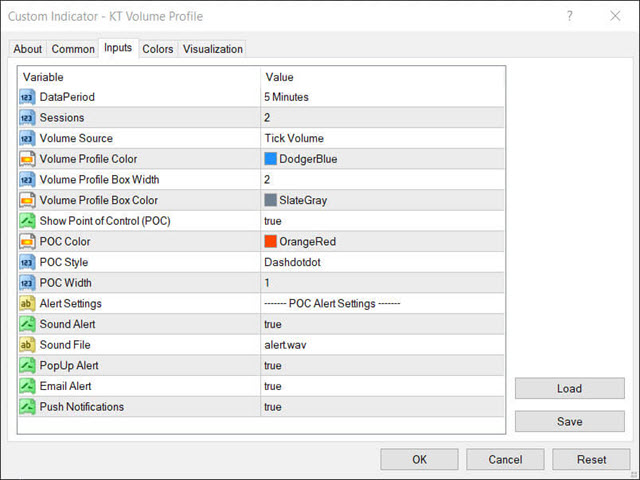
입력 설정
- 볼륨 소스: 틱 볼륨 / 실제 거래량
- 프로파일 색상: 히스토그램 막대의 색상
- 박스 너비: 사각형의 너비
- 박스 색상: 사각형의 색상
- POC 표시 여부: true/false
- POC 색상: POC 라인의 색상
- POC 스타일: 라인 스타일
- POC 두께: POC 라인의 두께
- 알림 설정: 직관적인 구성
실거래량 vs 틱 거래량
외환 시장은 분산형 구조이기 때문에, 개인 트레이더가 실제 거래량 데이터를 받는 것은 매우 어렵습니다. 만약 브로커가 실제 거래량 데이터를 제공한다면, KT Volume Profile은 이를 활용할 수 있습니다. 그렇지 않은 경우 대부분의 브로커가 제공하는 틱 볼륨이 사용됩니다.
2011년, FX 베테랑 트레이더 Caspar Marney는 틱 볼륨과 실제 거래량 사이에 높은 상관관계가 있음을 보여주는 연구 보고서를 발표했습니다.
사용자가 평가에 대한 코멘트를 남기지 않았습니다