KT Volume Profile MT4
- Indicateurs
-
KEENBASE SOFTWARE SOLUTIONS
 Keenbase Trading développe des indicateurs professionnels et des Expert Advisors pour MetaTrader 4 et MetaTrader 5 afin d'aider les traders à prendre des décisions de trading plus éclairées.
 - Version: 2.0
- Mise à jour: 30 mai 2022
- Activations: 5
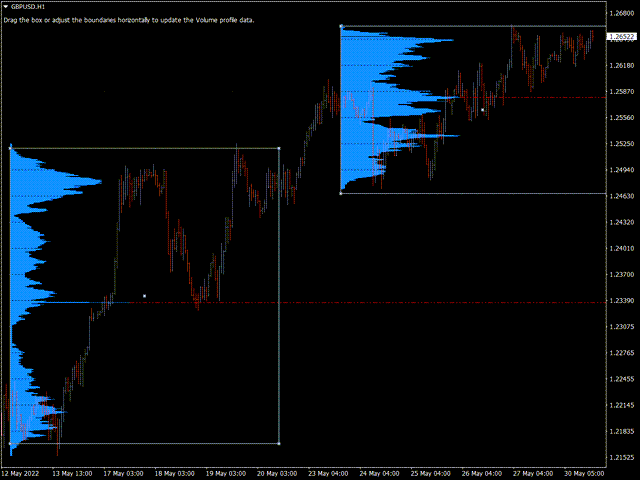
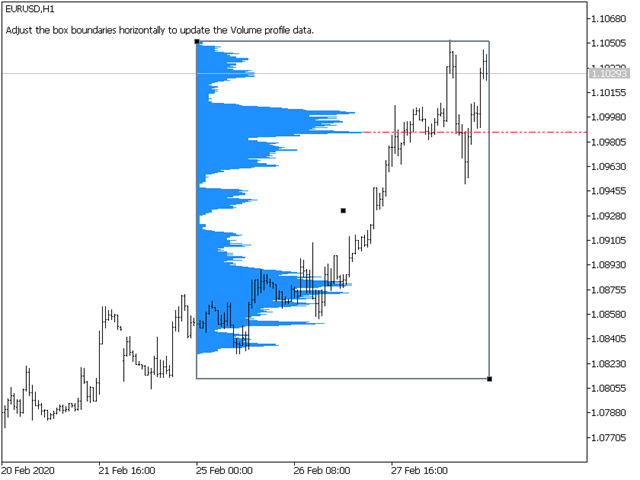
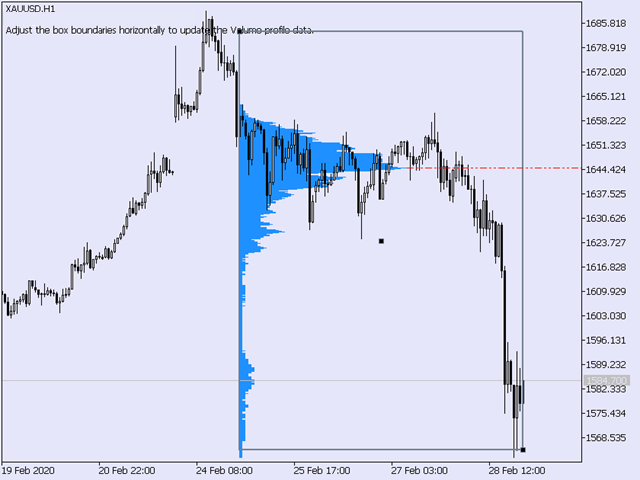
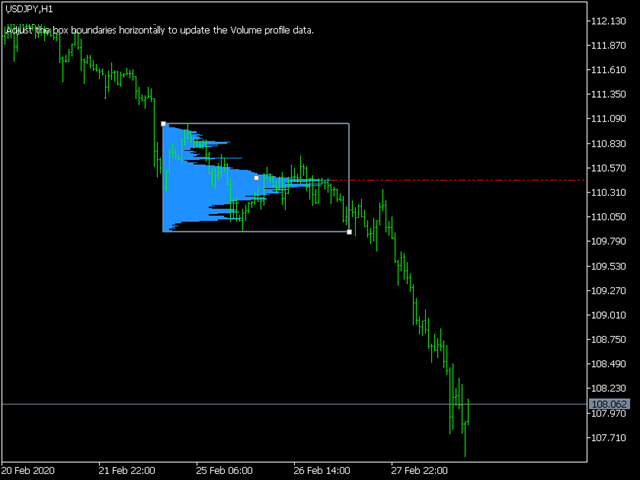
KT Volume Profile affiche les données d'accumulation de volume sous forme d'histogramme sur l'axe Y, ce qui permet d'analyser l'activité de trading selon les périodes et les niveaux de prix.
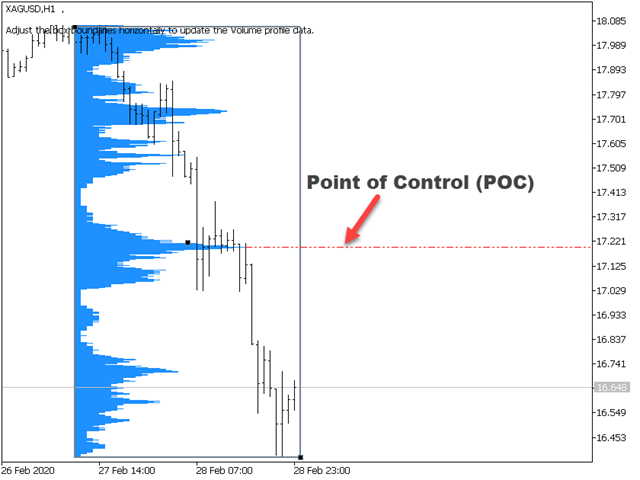
Point de Contrôle (POC) dans un Profil de Volume
Le POC représente le niveau de prix avec le volume échangé le plus élevé dans l'ensemble du profil. Il est souvent utilisé comme niveau de support/résistance ou comme point de test avant un mouvement directionnel.
Fonctionnalités
- Très facile à utiliser. Glissez-déposez simplement le rectangle sur le graphique pour actualiser les données en temps réel.
- Peut envoyer des alertes lorsque le prix franchit le POC.
- Codé entièrement depuis zéro avec une utilisation minimale des ressources système.
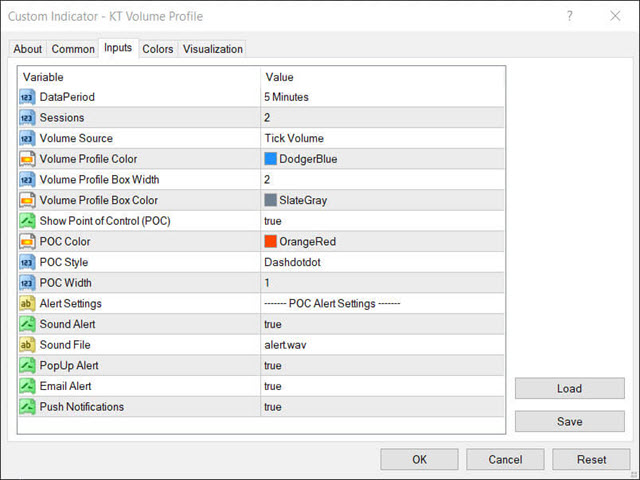
Paramètres d’entrée
- Source du volume : Volume par tick / Volume réel.
- Couleur du profil : Couleur de l’histogramme.
- Largeur de la boîte : Largeur du rectangle.
- Couleur de la boîte : Couleur du rectangle.
- Afficher le POC : true/false
- Couleur du POC : Couleur de la ligne POC.
- Style du POC : Style de ligne du POC.
- Épaisseur du POC : Épaisseur de la ligne.
- Paramètres d’alerte : Auto-explicatif.
Volume Réel vs Volume par Tick
Obtenir le volume réel est difficile pour les traders particuliers à cause de la nature décentralisée du marché Forex. Si votre courtier fournit ce volume, KT Volume Profile peut l’utiliser. Sinon, il utilisera le volume par tick, communément fourni.
Caspar Marney, un trader expérimenté, a publié une étude en 2011 démontrant une forte corrélation entre le volume par tick et le volume réel échangé.
L'utilisateur n'a laissé aucun commentaire sur la note