KT Volume Profile MT4
- Göstergeler
- Sürüm: 2.0
- Güncellendi: 30 Mayıs 2022
- Etkinleştirmeler: 5

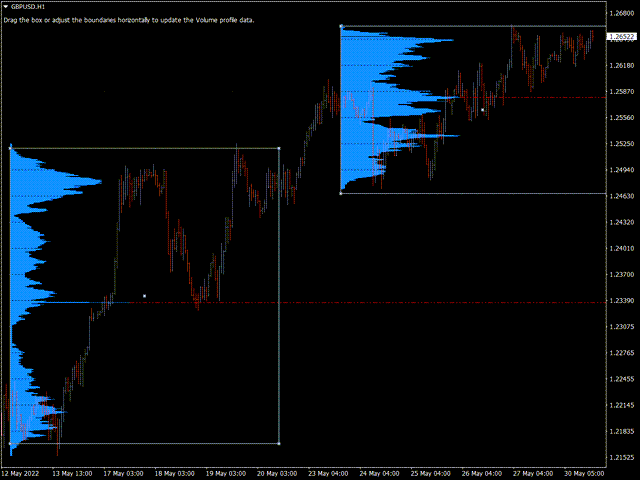
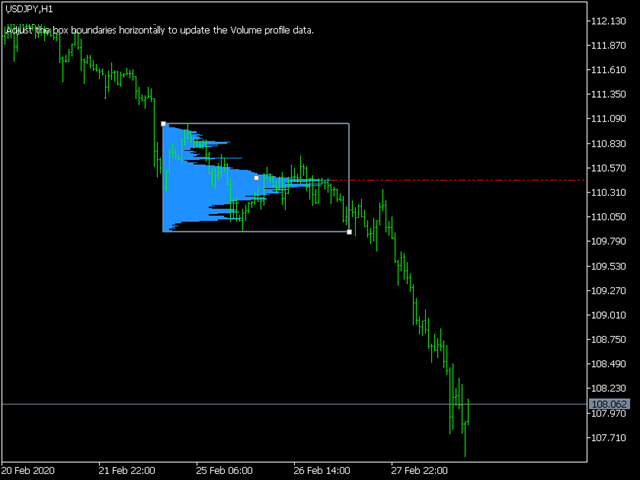
KT Volume Profile, hacim birikim verilerini Y ekseninde bir histogram olarak göstererek, belirli zaman dilimleri ve fiyat seviyelerinde işlem yoğunluğunu analiz etmeyi sağlar.
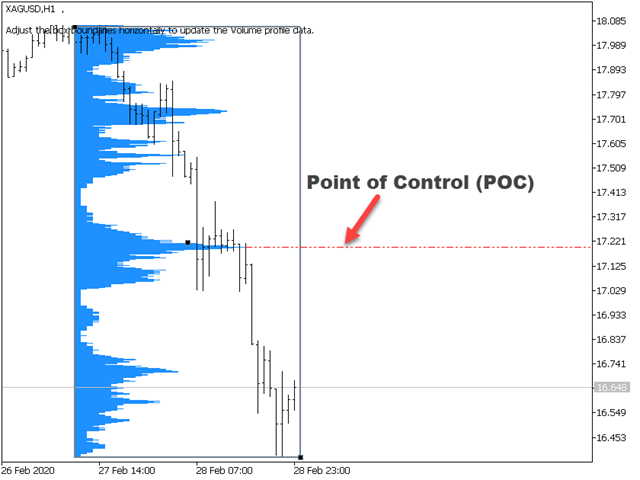
Volume Profile'da Kontrol Noktası (POC)
POC, tüm profil boyunca en yüksek işlem hacminin gerçekleştiği fiyat seviyesini temsil eder. Genellikle destek/direnç seviyesi veya piyasanın yön değiştirmeden önce yeniden test ettiği önemli bir fiyat noktası olarak kullanılır.
Özellikler
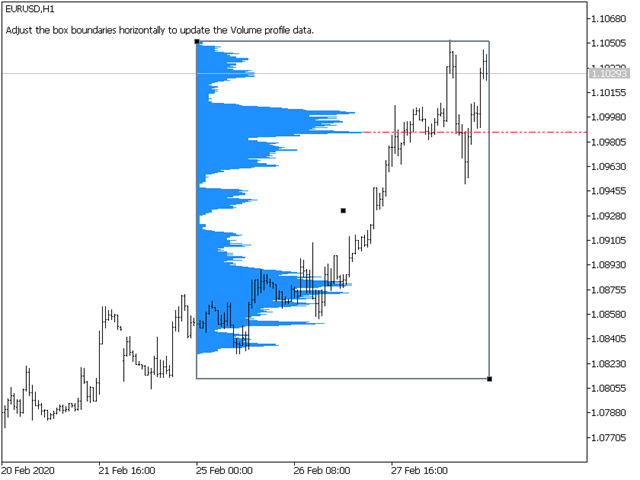
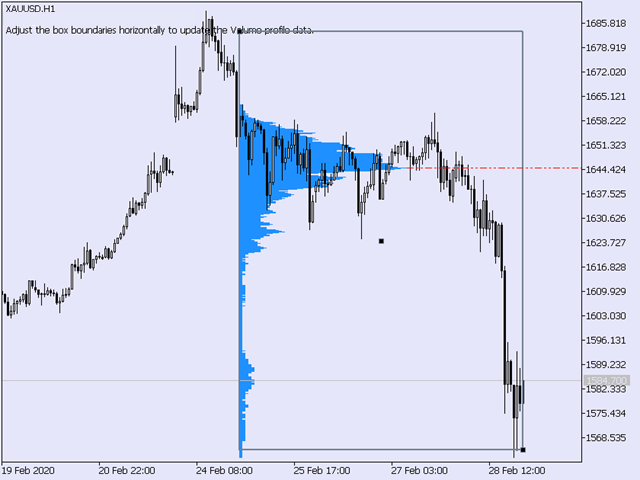
- Kullanımı çok kolaydır. Grafik üzerinde dikdörtgeni sürükleyip bırakarak hacim profilini anlık olarak güncelleyebilirsiniz.
- Fiyat POC seviyesini geçtiğinde uyarı verebilir.
- Az CPU ve bellek kullanımıyla sıfırdan kodlanmıştır.
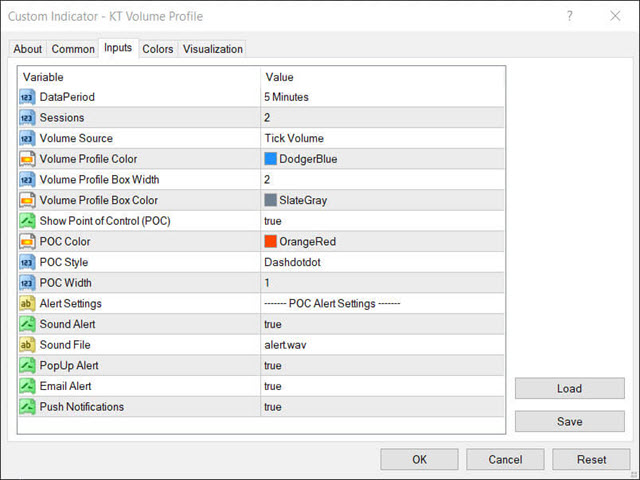
Girdi Parametreleri
- Hacim Kaynağı: Tick Hacmi / Gerçek Hacim.
- Hacim Profil Rengi: Histogramın rengi.
- Kutu Genişliği: Dikdörtgen kutunun genişliği.
- Kutu Rengi: Dikdörtgenin rengi.
- POC Göster: true/false
- POC Rengi: POC çizgisinin rengi.
- POC Stili: POC çizgi tipi.
- POC Genişliği: Çizgi kalınlığı.
- Uyarı Ayarları: Açıklayıcıdır.
Gerçek Hacim vs Tick Hacmi
Forex piyasasının merkezi olmayan yapısı nedeniyle bireysel yatırımcıların gerçek hacim verilerine ulaşması zordur. Broker'ınız gerçek hacim verisi sunuyorsa, KT Volume Profile bu verileri kullanabilir. Aksi halde çoğu broker'ın sağladığı tick hacmi kullanılır.
2011 yılında deneyimli yatırımcı Caspar Marney, tick hacmi ile gerçek işlem hacmi arasında yüksek korelasyon olduğunu gösteren bir araştırma yayınladı.
Kullanıcı değerlendirmeye herhangi bir yorum bırakmadı