OmniTrade
- Experts
- Versão: 1.5
- Atualizado: 2 maio 2026
- Ativações: 5
One interface. Every market. Absolute control.
MT4 Trading Assistant EA. A lightweight Expert Advisor that enhances your chart with visual context and a built-in order management panel — without automating any trades. Everything is click-driven, so you stay in full control.
Features
Key Price Levels
Automatically draws horizontal ray lines for the current Daily, Weekly, and Monthly high and low prices. Each level is labelled on the chart and updates with each new bar.
These give you an instant reference for significant support and resistance without manually drawing lines.
Trading Session Boxes
Shaded background rectangles mark the Asian, London, and New York sessions directly on the price chart. Overlapping sessions (such as London/NY) are visible simultaneously. Session boxes only appear on timeframes of M15 and below — they are automatically hidden on M30, H1, H4, and above, where they would be too compressed to be useful.
Asian Inner Range
A darker, nested box inside the Asian session highlights the quieter early-session window (UTC 00:00–05:00 by default). This helps identify the tightest consolidation zone before London opens.
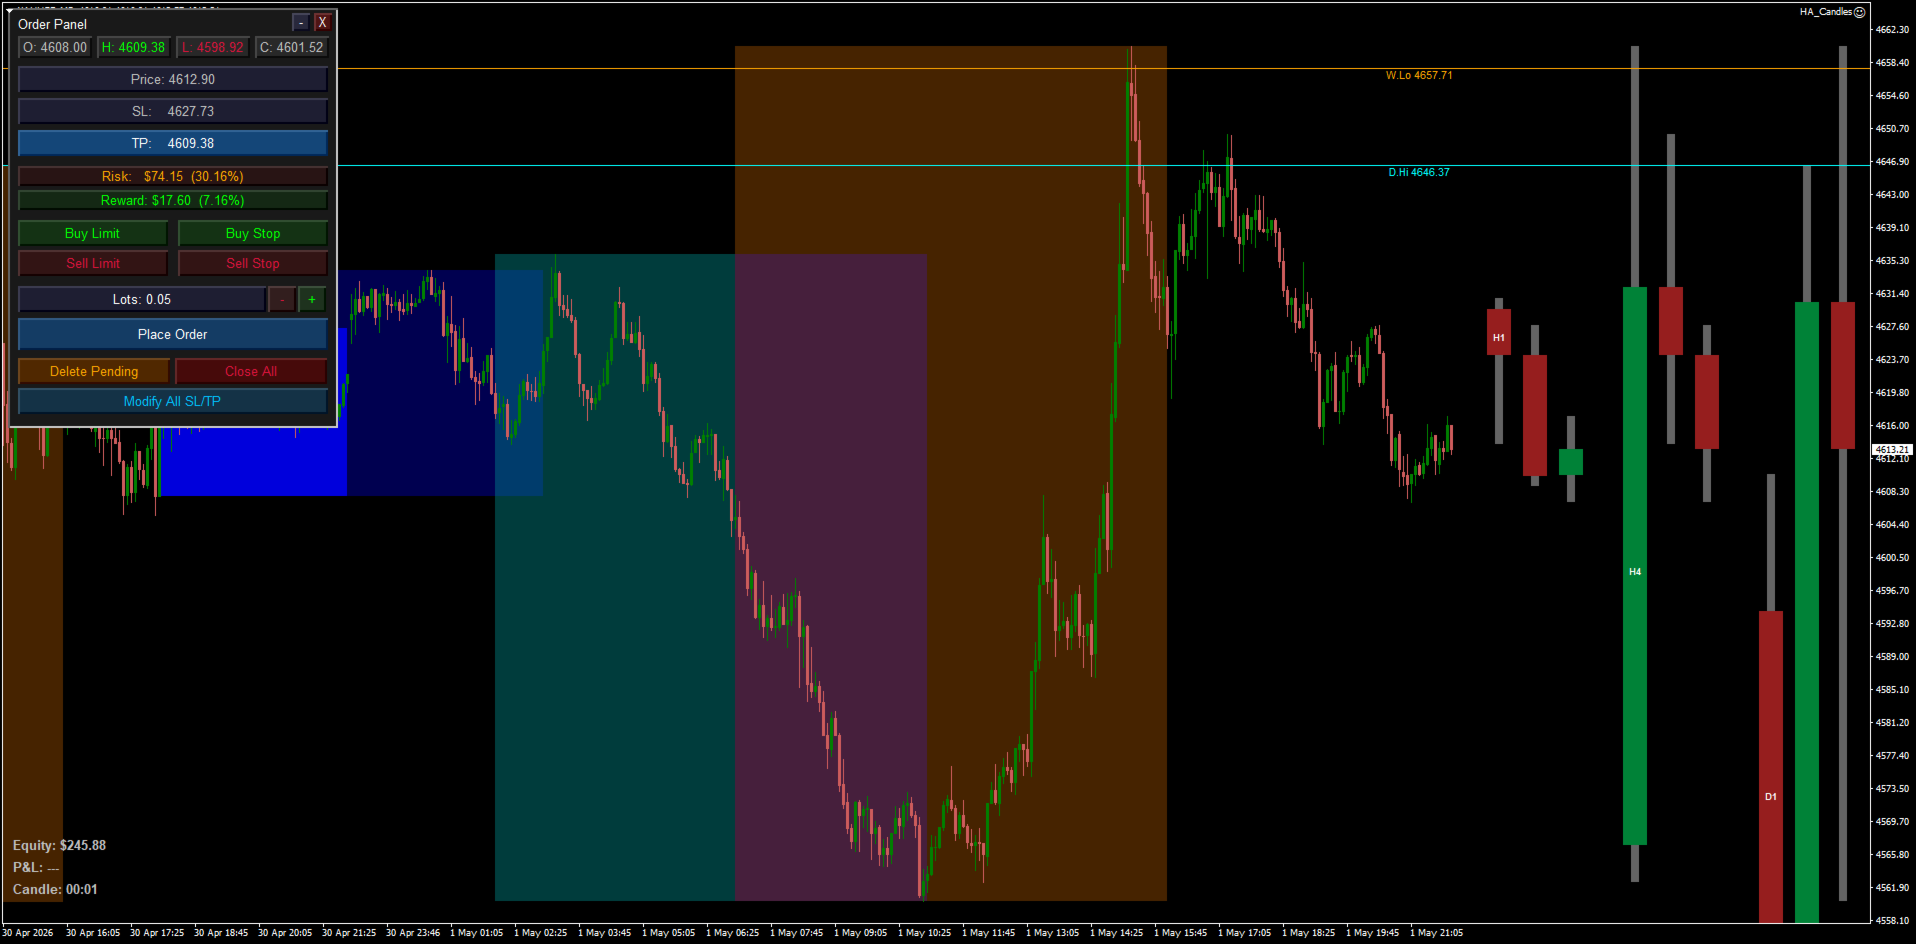
Order Panel
A collapsible panel in the top-left corner of the chart provides:
- One-click market orders — Buy Market and Sell Market with a single button press
- Pending orders — Buy Limit, Buy Stop, Sell Limit, Sell Stop — price is set by clicking on the chart
- SL / TP fields — type a stop loss and take profit price directly in the panel before placing
- Lot size control — + / − buttons to adjust position size, starting from the default lot size
- Close All — closes every open market position on the current symbol in one click
- Delete Pending — removes all pending orders on the current symbol
- Modify All SL/TP — applies the panel's current SL and TP values to every open position on the symbol; if a field is left blank, the existing stop on each position is preserved
Live P&L Display
A label in the bottom-left corner shows the combined running profit or loss across all open positions, in both dollar amount and percentage of account balance. Updates every second. Green when positive, red when negative.
Account Equity
A second label shows current account equity in real time, giving you a quick read of your net balance including open positions.
Candle Close Timer
A third bottom-left label counts down the time remaining until the current candle closes. Displays as MM:SS on timeframes under one hour, and HH:MM:SS on higher timeframes. Updates every second independently of incoming ticks.
HTF Candle Overlay
Three groups of higher-timeframe candles are drawn in the future area to the right of the last chart bar — H1, H4, and D1. Each group shows the three most recent completed candles plus the live (current) candle for that timeframe. Groups are automatically suppressed when the chart timeframe is equal to or higher than the group's timeframe (e.g. on an H4 chart, only the D1 group is drawn).
Candle bodies use separate bull and bear colors per timeframe. Wicks are drawn as a narrow centered column in a neutral gray. Each group is labelled (H1 / H4 / D1) directly inside its first candle body so the groups are always identifiable at a glance. The right-margin width adjusts automatically so the overlay fits snugly without leaving excess empty space.