Kadenspikekiller
- Indicadores
- Versão: 1.0
- Ativações: 10

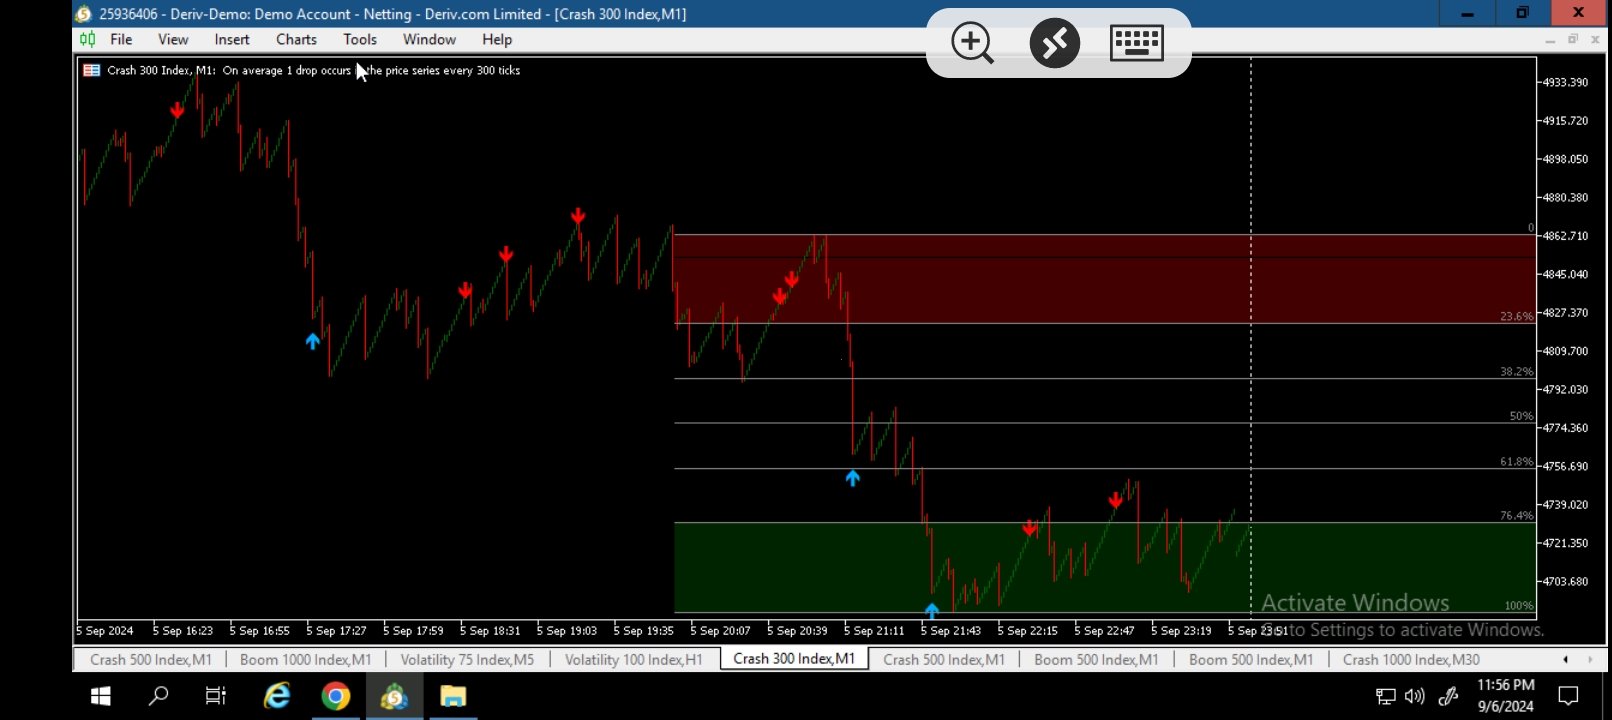
🚀 Boom & Crash AI Spike Detector MT5 – Advanced Edition + Weltrade Support
Unlock the Next Generation of Boom & Crash Trading
Experience a smarter way to trade with our Advanced AI Boom & Crash Spike Detector for MT5. Powered by enhanced AI technology and intelligent market filtering, this indicator delivers high-probability Buy and Sell signals with improved accuracy and reduced false entries.
Designed for scalpers, day traders, and swing traders, the latest version combines precision, speed, and reliability to help traders make informed decisions.
🔥 Advanced Features
- 🤖 AI-powered market analysis
- 📈 High-accuracy Boom & Crash spike detection
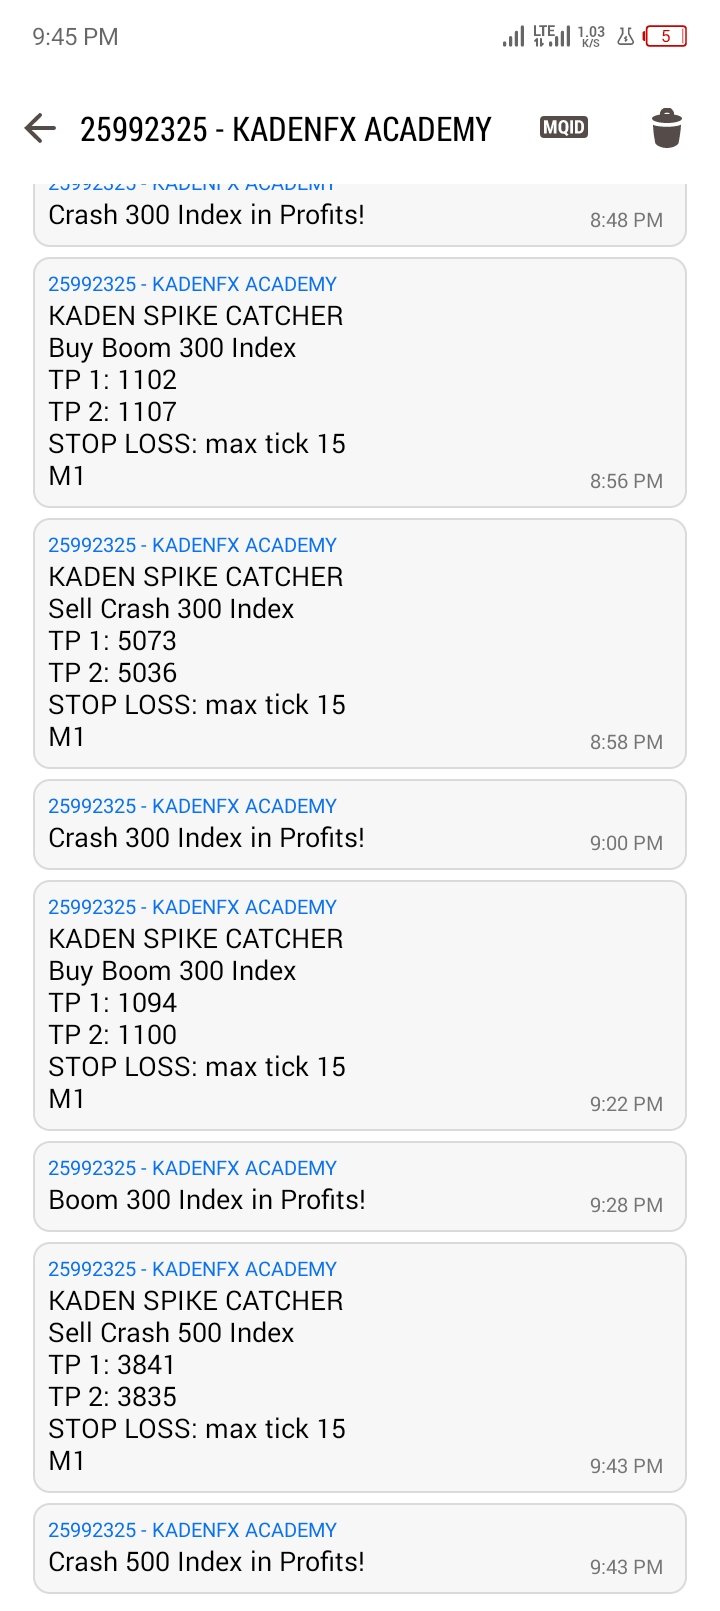
- 🎯 Precision Buy & Sell signals
- 🚫 Non-Repainting & Non-Redrawing technology
- 🔔 Instant mobile and desktop trade alerts
- ⚡ Smart trend confirmation system
- 📊 Advanced market filtering
- 💹 Support & Resistance integration
- 🔄 Optimized for multiple Boom & Crash indices
- 🧠 Updated algorithm with enhanced signal quality
✅ Recommended Timeframes
- M1 (1 Minute): Fast scalping opportunities
- M5 (5 Minutes): Recommended for the best balance of accuracy and consistency
- M15 (15 Minutes): Higher-quality confirmations and swing trading
✅ Supported Markets
- Boom 300
- Boom 500
- Boom 1000
- Crash 300
- Crash 500
- Crash 1000
💡 Trading Recommendations
- Use a VPS for uninterrupted 24/7 operation and instant mobile alerts.
- Wait patiently for high-probability AI-confirmed signals.
- Set Stop Loss and Take Profit near key Support & Resistance zones.
- Always apply proper risk management.
- Confirm entries with overall market structure for better results.
🆕 Latest System Upgrades
- Advanced AI Engine
- Enhanced Spike Detection
- Improved Signal Accuracy
- Better Trend Filtering
- Reduced False Signals
- Faster Alert System
- Optimized Multi-Timeframe Analysis
- Updated Algo Trading Support
🌍 Now Supporting Weltrade
The latest version now includes Weltrade support, providing a smoother experience for traders using Weltrade accounts alongside Boom & Crash strategies.
Weltrade + Volax users are welcome. For setup assistance, updates, or additional features, feel free to get in touch with the developer.
📞 Contact the Developer
📧 Email: praisemanjokota@gmail.com
📱 Phone / SMS / WhatsApp / Call:
+263788861381
Important Notice
If you previously purchased an older version, please contact the developer to receive information about the latest AI updates, algorithm improvements, and newly added features.
Trade smarter with AI. Trade with confidence. Trade with Weltrade support.