Asia London New York Session Kill Zone Mt5
- Indicadores
- Versão: 1.0
- Ativações: 5

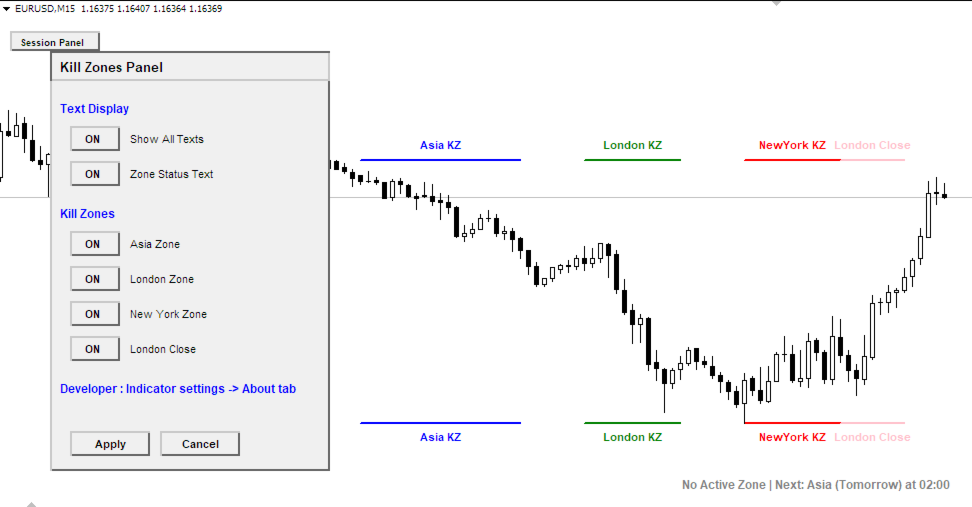
Session Kill zones with panel for quick changes.
- Asia Killzone
- London Killzone
- New York Killzone
- London Close Killzone
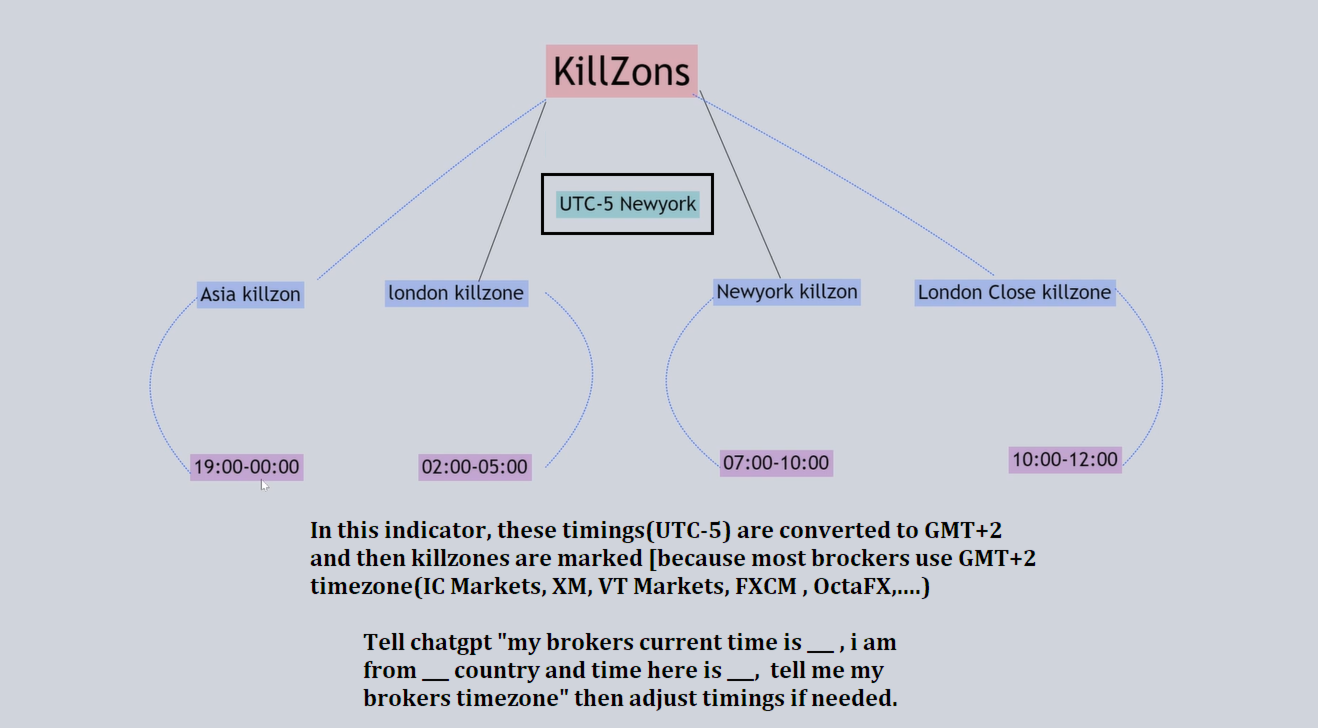
- In this indicator GMT+2 timings are used that are most common among many brokers. read the image attached in the screenshots to know more about sessions adjustments
- Session timings can be changed according to your broker timings and day light savings.
Thank you :) Always open to feedback and criticism if it helps me provide you more value.
- Rahul
My other indicators you may like
[I have been trading forex for last 6 years and i publish every indicator that i build for my personal use so everyone can benefit]