AIS Discrete Hartley Transform

Este indicador é baseado na transformada discreta de Hartley. O uso dessa transformação permite aplicar diferentes abordagens ao processar séries temporais financeiras. Uma característica distintiva deste indicador é que suas leituras não se referem a um ponto no gráfico, mas a todos os pontos do período do indicador.
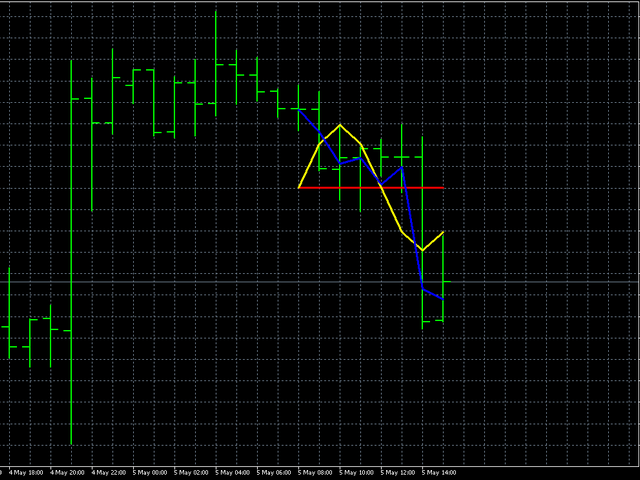
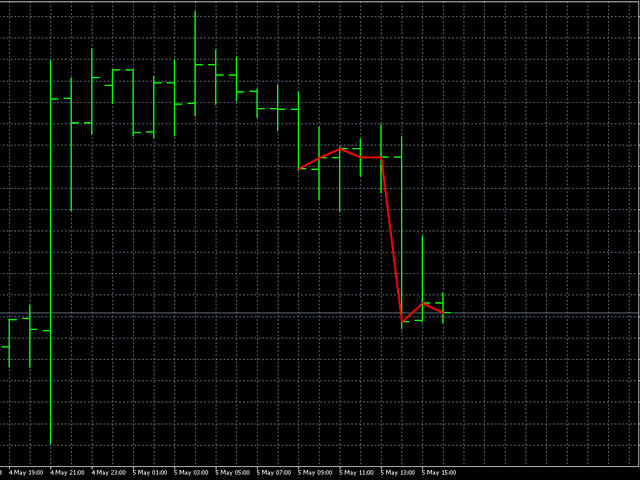
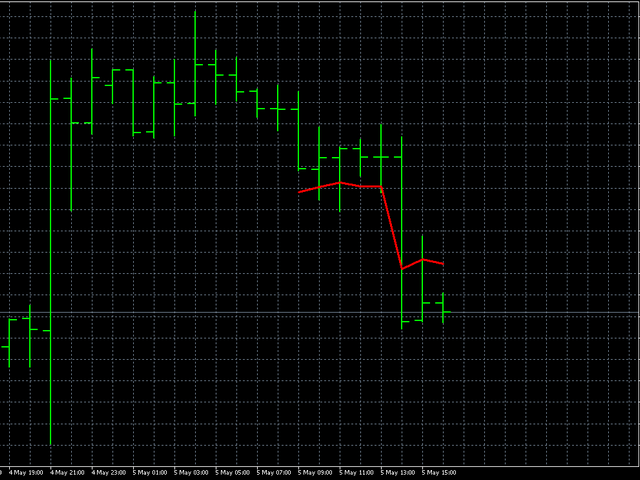
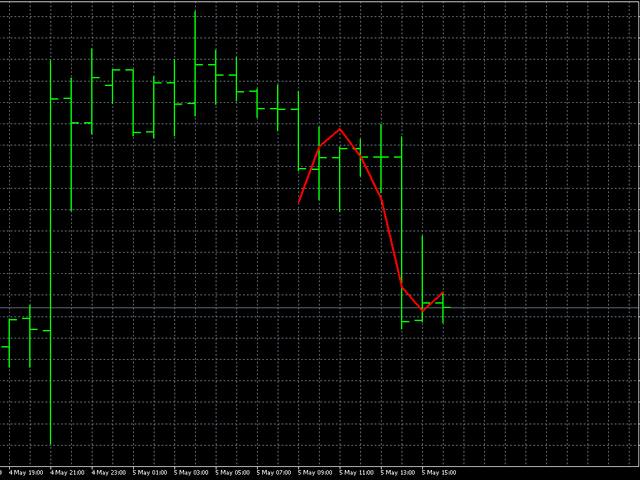
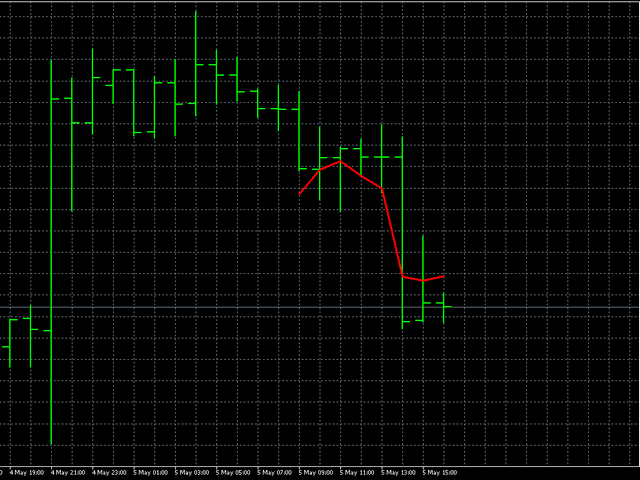
Ao processar uma série temporal, o indicador permite selecionar vários elementos da série temporal. A primeira possibilidade de filtragem baseia-se nesta abordagem - todos os componentes de alta frequência desnecessários são simplesmente descartados. A primeira figura mostra as possibilidades deste método, selecionando o parâmetro CutOff, você pode selecionar o detalhe da série temporal original (linha vermelha - resta apenas a informação principal CutOff = 0, amarelo - o período de frequência principal e menor CutOff = 1 , azul - todos os ruídos de alta frequência são descartados CutOff = 4 ). No entanto, esta não é a única possibilidade - os componentes de ruído podem ser suprimidos com filtragem adicional.
Ambas as opções são implementadas neste indicador. Seus parâmetros são:
  • iPeriod - período do indicador
  • Shift - deslocamento do indicador em relação à barra atual. Ao alterar este parâmetro, você pode avaliar o desempenho do indicador no passado.
  • NoiseReduction é uma forma de reduzir o ruído. Valores possíveis: nenhum - o ruído não é suprimido (apenas o parâmetro CutOff funciona neste caso), constante - o ruído é atenuado por uma constante, linear - supressão de ruído linear, logarítmico - atenuação logarítmica, quadrado - a redução do ruído ocorre de acordo com a raiz quadrada lei, quadrática - ruído de redução quadrática, exponencial - atenuação de ruído exponencial.
  • CutOff - corte de ruído. Quanto maior o valor deste parâmetro, mais detalhes são levados em consideração. O valor válido deste parâmetro é 0 - iPeriod -1
  • Constante - uma constante adicional que afeta a quantidade de supressão de ruído. Essa configuração não é usada quando NoiseReduction = none. Seu valor válido é 0 - 255.
Produtos recomendados
O indicador cria cotações atuais, que podem ser comparadas com as históricas e, com base nisso, fazer uma previsão do movimento dos preços. O indicador possui um campo de texto para navegação rápida até a data desejada. Opções: Símbolo - seleção do símbolo que o indicador exibirá; SymbolPeriod - seleção do período do qual o indicador coletará dados; IndicatorColor - cor do indicador; HorisontalShift - deslocamento das cotações desenhadas pelo indicador pelo número especificado de barras; I
Blahtech Supply Demand
Blahtech Limited
4.58 (36)
Was: $299  Now: $99   Supply Demand uses previous price action to identify potential imbalances between buyers and sellers. The key is to identify the better odds zones, not just the untouched ones. Blahtech Supply Demand indicator delivers functionality previously unavailable on any trading platform. This 4-in-1 indicator not only highlights the higher probability zones using a multi-criteria strength engine, but also combines it with multi-timeframe trend analysis, previously confirmed swings
BoxChart MT4
Evgeny Shevtsov
4.4 (5)
The market is unfair if only because 10% of participants manage 90% of funds. An ordinary trader has slim changes to stand against these "vultures". This problem can be solved. You just need to be among these 10%, learn to predict their intentions and move with them. Volume is the only preemptive factor that faultlessly works on any timeframe and symbol. First, the volume appears and is accumulated, and only then the price moves. The price moves from one volume to another. Areas of volume accumu
Market Profile with Dashboard Indicator - Complete User Guide indicator Overview The Market Profile with Dashboard is a comprehensive trading analysis tool for MetaTrader 4 that displays market profile data, volume analysis, and key market structure information directly on your chart. This indicator helps traders identify significant price levels, market balance areas, and potential trading opportunities based on market profile theory. Core Components and Features Market Profile Display - Sh
Blahtech Market Profile
Blahtech Limited
4.53 (15)
Was: $249  Now: $99   Market Profile defines a number of day types that can help the trader to determine market behaviour. A key feature is the Value Area, representing the range of price action where 70% of trading took place. Understanding the Value Area can give traders valuable insight into market direction and establish the higher odds trade. It is an excellent addition to any system you may be using. Blahtech Limited presents their Market Profile indicator for the MetaTrader community. Ins
If you are using volume spread analysis, whether your are a beginner or an expert, this system will give you a lot of features and help in your analysis. Please watch the video to see all the features. Features With one click you will find all the VSA patterns on your chart . Bars without opening price. Easy to read volume indicator. Bar reader (Bar type - Close type - Volume type - Spread type). Daily and weekly levels (Pivot - Camarilla - Fibo). Very light on the trading platform and moving b
The indicator allows you to trade binary options. The recommended time frame is М1 and the expiration time is 1,2,3 minutes. The indicator suitable for auto and manual trading. A possible signal is specified as a arrows above/under a candle. You should wait until the candle closes! Arrows are not re-painted Trade sessions: TOKYO section (Half-end) Currency pairs: USD/JPY Working time frame: M1 Expiration time: 1,2,3 minutes. The indicator also shows good results when using the martingale strateg
FREE
The   Visual Volatility Clustering   indicator clusters the market based on volatility. The indicator does not redraw and gives accurate data, does not use closing prices. Uses the opening prices or the highs or lows of the previous completed bar. Therefore, all information will be clear and unambiguous. The essence of the indicator is to divide the price market into certain areas according to a similar type of volatility. This can be done in any way. In this example, the indicator is configure
MarketProfile EForex
Veridiana Adorno Kendrick
O Perfil de Mercado Mostra onde o preço passou mais tempo, destacando níveis importantes que podem ser usados na negociação. É uma ferramenta poderosa que se destina a reunir os componentes fundamentais que compõem cada mercado; preço / volume / tempo, e exibir visualmente sua relação em tempo real à medida que o mercado se desenvolve por um período de tempo pré-determinado. Ferramenta muito poderosa!
Ugenesys AI MT4
Odaine Ramon Mcmillan
5 (1)
uGenesys AI - 90% Accurate Daytrading Indicator Introducing the ultimate forex trading indicator system, uGenesys AI, powered by cutting-edge AI technology and advanced analytical techniques, including Time-Series Analysis and Genetic Algorithms. Our AI-powered trading system leverages the power of time-series analysis to identify trends and patterns in historical price data, allowing traders to make informed predictions about future market movements. By analyzing vast amounts of data, our syst
AW Candle Patterns MT4
AW Trading Software Limited
O indicador AW Candle Patterns é uma combinação de um indicador de tendência avançado combinado com um poderoso scanner de padrão de vela. É uma ferramenta útil para reconhecer e destacar os trinta padrões de velas mais confiáveis. Além disso, é um analisador de tendências atual baseado em barras coloridas com       plug-in painel de tendência multi-timeframe que pode ser redimensionado e posicionado. Uma capacidade única de ajustar a exibição de padrões dependendo da filtragem de tendências. Va
The "MR Volume Profile Rectangles 4" indicator is a charting tool that displays trading volume at different price levels rather than time intervals. A key concept in volume profile is the point of control (POC) —the price level with the highest volume traded during the session or time range. While tools like VWAP or OBV provide volume trends, the "MR Volume Profile Rectangles 4" indicator offers granular detail about where the most market activity occurs at specific price levels. This makes it a
Market Profile Heat indicator  — is a classic Market Profile implementation that can show the price density over time, outlining the most important price levels, value area, and control value of a given trading session. This indicator can be attached to timeframes between M1 and D1 and will show the Market Profile for daily, weekly, monthly, or even intraday sessions. Lower timeframes offer higher precision. Higher timeframes are recommended for better visibility. It is also possible to use a fr
VPPD - Volume Profile POC Delta *Ferramenta profissional de análise de volume para MetaTrader 4* ---   CARACTERÍSTICAS DO INDICADOR   Capacidades exclusivas: **Volume Profile Avançado** - Histogramas horizontais de volume por períodos selecionados - Identificação precisa do Point of Control (POC) — nível de máximo volume **Análise de Delta (Recurso exclusivo!)** - Cálculo do delta de volume — relação entre compras e vendas - Simulação do movimento de ticks dentro da barra - Codific
Simple QM Pattern
Suvashish Halder
4.5 (2)
Simple QM Pattern is a powerful and intuitive trading indicator designed to simplify the identification of the Quasimodo (QM) trading pattern. The QM pattern is widely recognized among traders for effectively signaling potential reversals by highlighting key market structures and price action formations. This indicator helps traders easily visualize the QM pattern directly on their charts, making it straightforward even for those who are new to pattern trading. Simple QM Pattern includes dynamic
FREE
SX Supply Demand Zones accurately identifies and draws high-probability Supply and Demand zones using a sophisticated algorithm. Unlike traditional indicators that clutter your chart, this indicator is designed with a focus on performance and a clean user experience. New Unique Feature: Interactive Legend System What truly sets this indicator apart from everything else is the Interactive Control Legend. You have a professional dashboard directly on your chart that allows you to: Show/Hide: Ins
FREE
BoxProfile MT4
Evgeny Shevtsov
4.92 (12)
The indicator displays volume profiles based on the nesting principle. Profiles periods are pre-set so that each subsequent profile has a length twice as long as the length of the previous profile. In addition to profiles, the indicator displays volume clusters sorted by color, depending on the volume they contain. Indicator operation features The indicator works on typical timeframes from M5 to MN, but for calculations uses historical data from smaller timeframes: M1 - for timeframes from M5
FREE
Antabod Gamechanger
Rev Anthony Olusegun Aboderin
*Antabod GameChanger Indicator – Transform Your Trading!*   Are you tired of chasing trends too late or second-guessing your trades? The *Antabod GameChanger Indicator* is here to *revolutionize your trading strategy* and give you the edge you need in the markets!   Why Choose GameChanger? *Accurate Trend Detection* – GameChanger identifies trend reversals with *pinpoint accuracy*, ensuring you enter and exit trades at the optimal time.   *Clear Buy & Sell Signals* – No more guesswork! T
Gold Titan King Scalper
Dodong Christian Arnon
Indicator Description GOLD TITAN KING SIGNAL INDICATOR High-Precision Gold Scalping Buy/Sell Signals – Manual Trading Assistant Overview The Gold Titan King Signal Indicator is a manual trading assistant tool designed for high-frequency scalping on Gold (XAUUSD) and other major pairs. It generates clear BUY/SELL signals with precise entry levels, along with adjustable Stop Loss and Take Profit levels displayed directly on the chart. ️ This tool is NOT an EA. It does not execute trades
Meravith
Ivan Stefanov
5 (3)
Ferramenta dos market makers. O Meravith irá: Analisar todos os timeframes e exibir a tendência atual em vigor. Destacar zonas de liquidez (equilíbrio de volume) onde o volume comprador e vendedor é igual. Mostrar todos os níveis de liquidez de diferentes timeframes diretamente no seu gráfico. Gerar e apresentar análise de mercado em formato de texto para sua referência. Calcular alvos, níveis de suporte e pontos de stop-loss com base na tendência atual. Calcular a relação risco/retorno das sua
DracoAI
Hua Manh Hung
DracoAI is a revolutionary automated forex trading robot based on neural network.  Loss coverage is our premium exclusive feature. DracoAI IS: THE BEST MONEY MAKING SERVICE & STABLE PASSIVE INCOME PROFIT, EVEN IF YOU DO NOT PARTICIPATE IN BIDDING FINANCIAL INDEPENDENCE AND STABILITY DracoAI IS SAFE, BECAUSE: WE GUARANTEE THE SAFETY OF YOUR FUNDS NEGATIVE RESULTS OF TRADING ARE COVERED BY OUR RESERVE FUND 100% CONFIDENTIALITY Monitoring  - most popular signal at MQL5 :  https://www.mql5.com/en/s
VR Grid
Vladimir Pastushak
5 (3)
O indicador VR Grid foi projetado para criar uma grade gráfica com configurações definidas pelo usuário. Ao contrário da grade padrão , a VR Grid é usada para construir níveis circulares . Dependendo da escolha do usuário, o passo entre os níveis de rodada pode ser arbitrário. Além disso, ao contrário de outros indicadores e utilitários, o VR Grid mantém a posição da rede mesmo quando o período de tempo muda ou o terminal é reiniciado. Configurações, arquivos de configuração, versões demo, instr
FREE
Volume Profile Master Pro — Visible Range Volume Profile for MT4 Volume Profile Master Pro brings institutional-grade volume analysis to your MT4 charts. Unlike standard volume indicators that show when volume occurred, this tool shows where — at each price level — giving you a precise map of market activity to identify high-probability trade setups. OVERVIEW The indicator calculates and displays a Visible Range Volume Profile (VRVP) that automatically updates as you scroll the chart. Every time
Volume indicator Effect Volume , in the Forex market volumes are unique (tick). This volume indicator demonstrates the level of financial and emotional involvement. When the indicator forms a new top, it indicates that buyers are stronger than sellers over a certain period of time. If the indicator decreases, this indicates that the bears are stronger. Why is it impossible to track normal volumes in Forex? The fact is that this is an over-the-counter market. Consequently, it is practically imp
[V 1.00] MTF NRPA 5 RSI RTD foi lançado! Painel em tempo real de seta sem repintura. Se você está cansado de usar vários indicadores RSI, mas acha que eles são imprecisos, tente esta ferramenta. Normalmente, as pessoas instalam apenas 1 RSI para determinar o nível de OBOS em um período de tempo. A má notícia é que você não pode ver os níveis e tendências do OBOS em vários períodos de tempo ao mesmo tempo. É por isso que desenvolvi esta ferramenta de negociação. Veja como é explicado: Nesta
Adjustable Consecutive Fractals  looks for 2 or more fractals in one direction and sends out a on screen alert, sound alert and push notification, for strong reversal points . Adjustable Consecutive Fractals, shows the fractals on chart along with a color changing text for buy and sell signals when one or more fractals appear on one side of price. Adjustable Consecutive Fractals is based Bill Williams Fractals . The standard Bill Williams fractals are set at a non adjustable 5 bars, BUT withe th
VolumeProfile
Robert Hess
3.8 (5)
Descption: The Volume Profile displays detailed informations of historical trading activities at certain price levels (Market Profile). So you can locate the areas with the best prices in the market and get an advantage about other market participants. Features: Customizable Volume Profile / Market Profile Shows the "fair" Value Area with 70% of all Volume Shows critical low volume zones Shows VPOC, VAL and VAH Points Works on all timeframes Also available for MT5 ( https://www.mql5.com/en/mark
The Magneto Volume Trigger indicator is designed for determining the volume confirmed by the candlestick pattern and predicting the trend tendency. Indicator setup and use The calculation of values is affected by two parameters - Period and Gate . The lower the value of Gate , the higher the sensitivity of the indicator. Period allows making a sample of data for the specified number of candles. The lower the value of Period , the more the indicator is adapted to the current market conditions. I
Market Profile 3
Hussien Abdeltwab Hussien Ryad
3 (2)
Market Profile 3 MetaTrader 4 indicator  — is a classic Market Profile implementation that can show the price density over time, outlining the most important price levels, value area, and control value of a given trading session. This indicator can be attached to timeframes between M1 and D1 and will show the Market Profile for daily, weekly, monthly, or even intraday sessions. Lower timeframes offer higher precision. Higher timeframes are recommended for better visibility. It is also possible t
FREE
PZ Trend Trading
PZ TRADING SLU
4.8 (5)
O Trend Trading é um indicador projetado para lucrar o máximo possível com as tendências que ocorrem no mercado, cronometrando retrocessos e rupturas. Ele encontra oportunidades de negociação analisando o que o preço está fazendo durante as tendências estabelecidas. [ Guia de instalação | Guia de atualização | Solução de problemas | FAQ | Todos os produtos ] Negocie mercados financeiros com confiança e eficiência Lucre com as tendências estabelecidas sem ser chicoteado Reconhecer retrocessos
Os compradores deste produto também adquirem
Scalper Inside PRO
Alexey Minkov
4.74 (69)
An exclusive indicator that utilizes an innovative algorithm to swiftly and accurately determine the market trend. The indicator automatically calculates opening, closing, and profit levels, providing detailed trading statistics. With these features, you can choose the most appropriate trading instrument for the current market conditions. Additionally, you can easily integrate your own arrow indicators into Scalper Inside Pro to quickly evaluate their statistics and profitability. Scalper Inside
Dynamic Forex28 Navigator
Bernhard Schweigert
4.43 (7)
Dynamic Forex28 Navigator - A ferramenta de negociação Forex de última geração. ATUALMENTE 49% DE DESCONTO. Dynamic Forex28 Navigator é a evolução dos nossos indicadores populares de longa data, combinando o poder de três em um: Indicador Advanced Currency Strength28 (695 avaliações) + Advanced Currency IMPULSE com ALERTA (520 avaliações) + Sinais CS28 Combo (Bônus). Detalhes sobre o indicador https://www.mql5.com/en/blogs/post/758844 O que o Next-Generation Strength Indicator oferece?  Tudo
Precautions for subscribing to indicator This indicator only supports the computer version of MT4 Does not support MT5, mobile phones, tablets The indicator only shows the day's entry arrow The previous history arrow will not be displayed (Live broadcast is for demonstration) The indicator is a trading aid Is not a EA automatic trading No copy trading function The indicator only indicates the entry position No exit (target profit)  The entry stop loss point is set at 30-50 PIPS Or the front hi
Volatility Trend System - um sistema de negociação que dá sinais para entradas. O sistema de volatilidade fornece sinais lineares e pontuais na direção da tendência, bem como sinais para sair dela, sem redesenho e atrasos. O indicador de tendência monitora a direção da tendência de médio prazo, mostra a direção e sua mudança. O indicador de sinal é baseado em mudanças na volatilidade e mostra entradas no mercado. O indicador está equipado com vários tipos de alertas. Pode ser aplicado a vários i
No Repaint Bext
Andrey Kozak
1 (1)
No Repaint Bext is a ready-made trading system. Shows when to open and when to close trades, as well as in which direction. Every time a green arrow appears, you need to open a buy trade. Close all buy trades when a red arrow appears. The same goes for the opposite direction, every time a red arrow appears, open sell trades and close them all when a green arrow appears. We use the M5 timeframe for trading. You can trade on any cozy pair. This indicator does not repaint and practically does not
Supply and Demand Dashboard PRO
Bernhard Schweigert
4.8 (20)
Actualmente 40% OFF ! Este painel é uma peça de software muito poderosa que trabalha em múltiplos símbolos e até 9 prazos. Baseia-se no nosso principal indicador (Melhores críticas: Advanced Supply Demand ).   O tablier dá uma óptima visão geral. Mostra:   Valores filtrados da Oferta e da Procura, incluindo a classificação da força da zona, Distâncias de/para as zonas e dentro das zonas, Destaca as zonas aninhadas, Dá 4 tipos de alertas para os símbolos escolhidos em todos os (9) períodos de
Looking for a powerful yet lightweight swing detector that accurately identifies market structure turning points? Want clear, reliable buy and sell signals that work across any timeframe and any instrument? Buy Sell Arrow MT Swing is built exactly for that — precision swing detection made simple and effective. This indicator identifies Higher Highs (HH) , Higher Lows (HL) , Lower Highs (LH) , and Lower Lows (LL) with remarkable clarity. It is designed to help traders easily visualize market stru
Actualmente 40% OFF ! A melhor solução para qualquer novato ou comerciante especializado! Este software de painel de instrumentos está a funcionar em 28 pares de moedas. É baseado em 2 dos nossos principais indicadores (Advanced Currency Strength 28 e Advanced Currency Impulse). Dá uma grande visão geral de todo o mercado Forex. Mostra valores avançados de força da moeda, velocidade de movimento da moeda e sinais para 28 pares de divisas em todos os (9) períodos de tempo. Imagine como a sua n
El indicador "MR BEAST ALERTAS DE LIQUIDEZ" es una herramienta avanzada diseñada para proporcionar señales y alertas sobre la liquidez del mercado basándose en una serie de indicadores técnicos y análisis de tendencias. Ideal para traders que buscan oportunidades de trading en función de la dinámica de precios y los niveles de volatilidad, este indicador ofrece una visualización clara y detallada en la ventana del gráfico de MetaTrader. Características Principales: Canal ATR Adaptativo: Calcula
GOLD Impulse with Alert
Bernhard Schweigert
4.64 (11)
Este indicador é uma super combinação dos nossos 2 produtos Advanced Currency IMPULSE with ALERT  +   Currency Strength Exotics . Funciona para todos os períodos de tempo e mostra graficamente impulso de força ou fraqueza para as 8 principais moedas mais um Símbolo! Este Indicador é especializado para mostrar a aceleração da força da moeda para quaisquer símbolos como Ouro, Pares Exóticos, Commodities, Índices ou Futuros. É o primeiro do seu género, qualquer símbolo pode ser adicionado à 9ª
RFI levels PRO
Roman Podpora
5 (1)
O indicador mostra com precisão os pontos de reversão e as zonas de retorno de preço onde o   Principais players . Você identifica onde novas tendências estão se formando e toma decisões com máxima precisão, mantendo o controle sobre cada negociação. VERSION MT5     -     Revela seu potencial máximo quando combinado com o indicador   TREND LINES PRO. O que o indicador mostra: Estruturas de reversão e níveis de reversão com ativação no início de uma nova tendência. Exibição dos níveis de   TAKE
PZ Harmonacci Patterns
PZ TRADING SLU
3.17 (6)
Este é sem dúvida o indicador de reconhecimento automático de formação de preço harmônico mais completo que você pode encontrar para a MetaTrader Platform. Ele detecta 19 padrões diferentes, leva as projeções de Fibonacci tão a sério quanto você, exibe a Zona de Reversão Potencial (PRZ) e encontra níveis adequados de stop loss e take-profit. [ Guia de instalação | Guia de atualização | Solução de problemas | FAQ | Todos os produtos ] Detecta 19 formações harmônicas de preços diferentes Traça
Step into the world of Forex trading with confidence, clarity, and precision using   Gold Indicator   a next-generation tool engineered to take your trading performance to the next level. Whether you’re a seasoned professional or just beginning your journey in the currency markets, Gold Indicator equips you with powerful insights and help you trade smarter, not harder. Built on the proven synergy of three advanced indicators, Gold Indicator focuses exclusively on medium and long-term trends eli
Weis Wave with Alert
Trade The Volume Waves Single Member P.C.
4.82 (22)
Rental/Lifetime Package Options and Privileges' Rent Monthly Six Months   Yearly/Lifetime Weis Wave with Speed with Alert+Speed Index x x x Manual  x x x Quick Set up Video x x x Blog x x x Lifetime Updates x x x Setup and Training Material x x Rectangle Break Alert Tool      x Discord Access Channel "The SI traders" x   How to trade info visit:    http://www.tradethevolumewaves.com   ** If you purchase please contact me to setup your  : training Room and  complete manual access.  This is
Um indicador técnico que estrutura gráficos e identifica movimentos cíclicos de preços. Pode funcionar em qualquer gráfico. Vários tipos de notificações. Existem setas adicionais no próprio gráfico. Sem redesenhar a história, trabalha no fecho da vela. TF recomendado a partir de M5 e superior. Parâmetros fáceis de utilizar e configurar. Ao utilizar 2 indicadores com parâmetros diferentes, pode utilizá-los sem outros indicadores. Tem 2 parâmetros de entrada Ciclicidade e duração do sinal Estes
System Trend Pro
Aleksandr Makarov
5 (2)
System Trend Pro - This is the best trend trading indicator!!! The indicator no repaint!!!  The indicator has   MTF   mode, which adds confidence to trading on the trend (   no repaint   ). How to trade? Everything is very simple, we wait for the first signal (big arrow), then wait for the second signal (small arrow) and enter the market in the direction of the arrow. (See screens 1 and 2.) Exit on the opposite signal or take 20-30 pips, close half of it, and keep the rest until the opposite
Trend Lines PRO
Roman Podpora
5 (1)
LINHAS DE TENDÊNCIA PRO       Ajuda a entender onde o mercado está realmente mudando de direção. O indicador mostra inversões de tendência reais e pontos onde os principais participantes retornam ao mercado. Você vê     Linhas BOS     Análise de tendências e níveis-chave em prazos maiores — sem configurações complexas ou ruídos desnecessários. Os sinais não são repintados e permanecem no gráfico após o fechamento da barra. VERSÃO MT 5      -      Revela seu potencial máximo quando emparelhada co
Currency Strength Exotics
Bernhard Schweigert
4.88 (33)
ACTUALMENTE 20% DE DESCONTO ! A melhor solução para qualquer novato ou comerciante especializado! Este Indicador é especializado para mostrar a força da moeda para quaisquer símbolos como Pares Exóticos de Commodities, Índices ou Futuros. É o primeiro do seu género, qualquer símbolo pode ser adicionado à 9ª linha para mostrar a verdadeira força da moeda de Ouro, Prata, Petróleo, DAX, US30, MXN, TRY, CNH etc. Esta é uma ferramenta de negociação única, de alta qualidade e acessível, porque inco
Are you looking for a simple and reliable indicator that can help you spot market swing points easily? Do you want clear buy and sell signals that work on any timeframe and any trading instrument? Buy Sell Signal Pro is designed to do exactly that. It helps traders identify important market turning points and understand the current market structure in a clear and easy way. This indicator detects Higher Highs (HH), Higher Lows (HL), Lower Highs (LH), and Lower Lows (LL) so you can quickly see wh
TPSproTREND PrO
Roman Podpora
4.67 (27)
TPSproTrend PRO       - Este é um indicador de tendência que analisa automaticamente o mercado e fornece informações sobre a tendência e suas mudanças, além de exibir pontos de entrada para negociações.       Sem redesenhar! ИНСТРУКЦИЯ RUS   -   INSTRUÇÕES   ENG   -   VERSÃO MT5 Funções principais: Sinais de entrada precisos       SEM PRECISAR REPINTAR! Uma vez que um sinal aparece, ele permanece válido! Esta é uma diferença significativa em relação aos indicadores de repintura, que podem forne
Super Signal – Skyblade Edition Sistema profissional de sinais de tendência sem repintar / sem atraso com taxa de acerto excepcional | Para MT4 / MT5 Funciona melhor em timeframes mais curtos, como 1 minuto, 5 minutos e 15 minutos. Principais características: Super Signal – Skyblade Edition é um sistema inteligente de sinais desenvolvido especificamente para operações com tendência. Utiliza uma lógica de filtragem em múltiplas camadas para detectar apenas movimentos direcionais fortes sustenta
Smc Blast Signal
Mohit Dhariwal
3.4 (5)
OFFER OFFER! The price of the indicator is kept at 75 dollars only from 20th Feb to 28th Feb. Full Fledged EA and Alert plus for alerts will also be provided in this offer along with the purchase of Indicator. Limited copies only at this price and Ea too. Grab your copy soon Alert plus for indicator with set file is kept in comment section with the image  SMC Blast Signal with FVG, BOS and trend Breakout The SMC Blast Signal is a Precise trading system for Meta Trader 4 that uses Smart Money Con
GM Arrows Pro
Guillaume Pierre Philippe Mesplont
Product Name: GM Arrows Pro – Signals & Alerts Short Description: GM Arrows Pro is a clean, reliable MT4 indicator showing BUY/SELL arrows on the chart with unique alerts at the moment the signal appears. Full Description: GM Arrows Pro is a professional MT4 indicator designed for traders who want clear, actionable signals: BUY and SELL arrows visible on the entire chart history Unique alerts when a new signal appears (no repeated alerts) Option to disable repetitive signals ( disable_repeatin
Indicador Miraculous – Ferramenta 100% Não Repintável para Forex e Opções Binárias Baseada no Quadrado de Nove de Gann Este vídeo apresenta o Indicador Miraculous , uma ferramenta de negociação altamente precisa e poderosa, desenvolvida especificamente para traders de Forex e Opções Binárias . O que torna este indicador único é a sua base no lendário Quadrado de Nove de Gann e na Lei da Vibração de Gann , tornando-o uma das ferramentas de previsão mais precisas disponíveis na negociação moderna.
PairMaster Buy Sell Arrow Indicator for MT4 Trade Reversals Like a Pro — Catch Every Swing Point with Precision The PairMaster Buy Sell Arrow Indicator is a powerful MetaTrader 4 tool built to identify high-probability swing trading opportunities . Designed for traders who value accuracy, clarity, and simplicity, PairMaster detects key market turning points and plots intuitive buy and sell arrows directly on your chart. Key Features Accurate Swing Point Detection – Automatically identifies ma
"Dragon's Tail" is an integrated trading system, not just an indicator. This system analyzes each candle on a minute-by-minute basis, which is particularly effective in high market volatility conditions. The "Dragon's Tail" system identifies key market moments referred to as "bull and bear battles". Based on these "battles", the system gives trade direction recommendations. In the case of an arrow appearing on the chart, this signals the possibility of opening two trades in the indicated directi
O indicador " Dynamic Scalper System " foi desenvolvido para o método de scalping, operando dentro de ondas de tendência. Testado nos principais pares de moedas e ouro, é possível a compatibilidade com outros instrumentos de negociação. Fornece sinais para a abertura de posições de curto prazo ao longo da tendência, com suporte adicional para o movimento dos preços. O princípio do indicador: As setas grandes determinam a direção da tendência. Um algoritmo para gerar sinais de scalping sob a fo
Trend Arrow Super
Aleksandr Makarov
5 (2)
Trend Arrow Super The indicator not repaint or change its data. A professional, yet very easy to use Forex system. The indicator gives accurate BUY\SELL signals. Trend Arrow Super is very easy to use, you just need to attach it to the chart and follow simple trading recommendations. Buy signal: Arrow + Histogram in green color, enter immediately on the market to buy. Sell signal: Arrow + Histogram of red color, enter immediately on the market to sell.
CyberZingFx Volume Plus
Afsal Meerankutty
4.94 (17)
Advanced version of CyberZingFx Volume Plus, the ultimate MT4 indicator for traders seeking highly accurate buy and sell signals. With an additional strategy and price action dot signals that enhances its effectiveness, this indicator offers a superior trading experience for professionals and beginners alike. The CyberZingFx Volume Plus Advanced version combines the power of volume analysis and historical price data with an additional strategy, resulting in even more precise and reliable signals
Presenting one-of-a-kind Gann Indicator for XAUUSD IQ Gold Gann Levels is a non-repainting, precision tool designed exclusively for XAUUSD/Gold intraday trading. It uses W.D. Gann’s square root method to plot real-time support and resistance levels, helping traders spot high-probability entries with confidence and clarity. William Delbert Gann (W.D. Gann) was an exceptional market analyst whose trading technique was based on a complex blend of mathematics, geometry, astrology, and ancient calcul
Mais do autor
O script é baseado na simulação de transações comerciais usando um gerador de números aleatórios. Isso permite obter resultados completamente diferentes, mesmo com os mesmos parâmetros de entrada. Quando você executa o script, é aberta uma caixa de diálogo na qual você pode definir os valores desejados para variáveis ​​externas. No bloco,  TradingOptions  define os parâmetros básicos necessários para simular a negociação. StartBalance  - define o tamanho inicial da balança comercial. NumberTrad
FREE
This script allows selecting the TakeProfit and StopLoss levels. It analyzes the history data, and then calculates the probability of reaching a given price level. How the script works Suppose you have a trading strategy and you want to select the TakeProfit and StopLoss levels. Run the script and set the parameter: Number of Bars - the average position holding time in bars. Once the script operation is complete, the AIS-PPL.csv file will be created in the Files folder in the terminal data cata
FREE
Este script é projetado para que o trader possa determinar a duração média das transações comerciais, na qual a proporção de possíveis lucros e perdas será ótima. Primeiro, vamos examinar a abordagem geral para determinar a duração ótima das transações comerciais. Nós introduzimos as seguintes variáveis: R  - o resultado da transação; T  - o tempo durante o qual a transação foi aberta; W  - o tempo entre o fechamento da transação anterior e a abertura da próxima. Cada comerciante se esforça para
FREE
O script é baseado na simulação de transações comerciais usando um gerador de números aleatórios. Isso permite obter resultados completamente diferentes, mesmo com os mesmos parâmetros de entrada. Quando você executa o script, é aberta uma caixa de diálogo na qual você pode definir os valores desejados para variáveis ​​externas. No bloco, TradingOptions define os parâmetros básicos necessários para simular a negociação. StartBalance - define o tamanho inicial da balança comercial. NumberTrade -
FREE
Escolher os níveis de StopLoss e TakeProfit pode ter um impacto muito forte no desempenho geral da negociação. Além dos parâmetros óbvios de uma transação comercial - o tamanho de uma possível vitória ou perda provável - os níveis de StopLoss e TakeProfit também afetam a duração esperada da transação e a rentabilidade da negociação em geral. Se você já determinou a duração ideal da transação usando o script “ AIS-ODT ”, poderá começar a determinar os parâmetros associados aos níveis StopLoss e T
FREE
MinDeposit MT5
Aleksej Poljakov
3 (1)
The script analyzes the history of quotes and gives recommendations on the minimum deposit. The calculations take into account the variability of prices and the standard deviation. Margin requirements for the instrument are also taken into account. The result of the script is the minimum recommended deposit for trading the given currency pair.
FREE
The script allows selecting the required 'Filter level' value of the AIS-MTF MT5 indicator. Run the script on the required chart and selected timeframe. Once its operation is complete, the HPS.csv file will be created in the Files folder. Open the file. You will see three columns. The 'Filter lvl' column represents the value of the 'Filter level' for the AIS-MTF indicator. Am. dev. - degree and direction of the indicator's deviation from the price level (sorted in ascending order). Negative valu
FREE
This script allows selecting the TakeProfit and StopLoss levels. It analyzes the history data, and then calculates the probability of reaching a given price level. How the script works Suppose you have a trading strategy and you want to select the TakeProfit and StopLoss levels. Run the script and set the parameter: Number of Bars - the average position holding time in bars. Once the script operation is complete, the AIS-PPL.csv file will be created in the Files folder in the terminal data cata
FREE
MinDeposit
Aleksej Poljakov
5 (1)
The script analyzes the history of quotes and gives recommendations on the minimum deposit. The calculations take into account the variability of prices and the standard deviation. Margin requirements for the instrument are also taken into account. The result of the script is the minimum recommended deposit for trading the given currency pair.
FREE
Este script é projetado para que o trader possa determinar a duração média das transações comerciais, na qual a proporção de possíveis lucros e perdas será ótima. Primeiro, vamos examinar a abordagem geral para determinar a duração ótima das transações comerciais. Nós introduzimos as seguintes variáveis: R - o resultado da transação; T - o tempo durante o qual a transação foi aberta; W - o tempo entre o fechamento da transação anterior e a abertura da próxima. Cada comerciante se esforça para ob
FREE
The script allows selecting the required 'Filter level' value of the AIS-MTF indicator. Run the script on the required chart and selected timeframe. Once its operation is complete, the HPS.csv file will be created in the Files folder. Open the file. You will see three columns. The 'Filter lvl' column represents the value of the 'Filter level' for the AIS-MTF indicator. Am. dev. - degree and direction of the indicator's deviation from the price level (sorted in ascending order). Negative values i
FREE
O indicador AIS Correct Averages permite definir o início de um movimento de tendência no mercado. Outra qualidade importante do indicador é um sinal claro do fim da tendência. O indicador não é redesenhado ou recalculado. Valores exibidos h_AE - limite superior do canal AE l_AE - limite inferior do canal AE h_EC - Valor previsto alto para a barra atual l_EC - Valor previsto baixo para a barra atual Sinais ao trabalhar com o indicador O sinal principal é a interseção dos canais AE e EC. U
O indicador de média móvel ponderada AIS calcula uma média móvel ponderada e permite determinar o início de um movimento de mercado de tendência. Os coeficientes de peso são calculados levando em consideração as características específicas de cada barra. Isso permite que você filtre os movimentos aleatórios do mercado. O principal sinal que confirma o início de uma tendência é uma mudança na direção das linhas do indicador e o preço cruzando as linhas do indicador. WH (linha azul) é a média
O indicador AIS Advanced Grade Feasibility foi projetado para prever os níveis que o preço pode atingir no futuro. Seu trabalho é analisar as últimas três barras e construir uma previsão com base nisso. O indicador pode ser usado em qualquer período de tempo e em qualquer par de moedas. Com a ajuda de configurações, você pode obter a qualidade desejada da previsão. Profundidade da previsão - define a profundidade de previsão desejada em barras. Este parâmetro é recomendado para ser selecionado
The indicator is designed to measure the price volatility. This allows determining the moments for opening or closing trade positions more accurately. High intensity of the market indicates the instability of its movement, but allows for better results. And, conversely, low intensity of the market indicates the stability of its movement. Parameters Bars to process - the number of bars to measure the price movements. A low value of this parameter allows determining the moments of rapid price mov
This indicator uses the Fibonacci p-numbers to smooth a price series. This allows combining the advantages of the simple and exponential moving averages. The smoothing coefficients depend on the level of the p-number, which is set in the indicator parameters. The higher the level, the greater the influence of the simple moving average and the less significant the exponential moving average. Parameters Fibonacci Numbers Order - order of the Fibonacci p-number, specified by trader. Valid values a
The indicator is based on the analysis of interaction of two filters. The first filter is the popular Moving Average. It helps to identify linear price movements and to smooth minor price fluctuations. The second filter is the Sliding Median. It is a non-linear filter. It allows to filter out noise and single spikes in the price movement. A predictive filter implemented in this indicator is based on the difference between these filters. The indicator is trained during operation and is therefore
This indicator studies the price action as a combination of micro-trends. All micro-trends are analyzed and averaged. Price movement is filtered based on this averaging. IP_High and IP_Low (blue and red dashed lines) show the instantaneous price movement. They display the forecast only for the current price values, taking into account only the number of bars defined by the 'Filter level' parameter. SP_High and SP_Low (blue and red solid lines) smooth the price movements with respect to history.
Este indicador implementa um processo de suavização linear simples. Uma das desvantagens da suavização exponencial é o rápido decaimento do sinal. Isso torna impossível rastrear totalmente as tendências de longo prazo na faixa de preço. A suavização linear permite ajustar com mais precisão e precisão a filtragem de sinal. O indicador é configurado selecionando os parâmetros: LP - este parâmetro permite selecionar o período de suavização. Quanto maior o seu valor, mais tendências de longo pra
Este indicador é um filtro híbrido sequencial baseado em uma combinação de propriedades médias e médias móveis. Usar a mediana permite filtrar outliers anormais e impulsos aleatórios nos valores da série de preços. Ao mesmo tempo, o filtro mediano não atua na tendência do movimento dos preços, deixando-o inalterado. Como o filtro mediano não é linear, a média usando uma média móvel simples é usada para suavizar seus valores. Essa abordagem nos permite identificar com mais precisão não apenas a
Este indicador é uma combinação de dois filtros Lanczos modificados. O primeiro filtro serve para extrapolar o preço. Com base em valores anteriores, ele prevê um possível movimento de preços dentro da barra atual. Isto é, mostra qual seria o preço se as tendências passadas permanecessem inalteradas. O segundo filtro para suavizar e calcular a média de preços dentro da janela, determinado pelo nível do filtro. Graças à seleção de pesos, este filtro responde mais ativamente ao componente periódic
Vejamos a natureza das mudanças de preço no mercado Forex, não prestando atenção às razões pelas quais essas mudanças ocorrem. Essa abordagem nos permitirá identificar os principais fatores que afetam o movimento dos preços. Por exemplo, vamos considerar os preços de abertura das barras no par de moedas EUR-USD e no período de tempo H1. Por esses preços, construímos o diagrama de Lameray (Figura 1). Neste diagrama, pode-se ver que o movimento dos preços ocorre basicamente de acordo com uma equaç
Este indicador é mais informativo. Seu trabalho é baseado na suposição de que o movimento de preços no mercado pode ser escrito como o barulho de uma cor que depende dos valores dos preços dos parâmetros de distribuição. Isso torna possível analisar a variação dos preços dos diferentes partidos, e considerando o movimento de preços como o som de uma determinada cor, você pode obter informações sobre a situação atual no mercado e fazer uma previsão sobre o comportamento dos preços. Na análise do
Apesar de algumas desvantagens do indicador “ AIS Color Noise Filter ”, a ideia de usá-lo para suavizar a série de preços e os preços previstos parece bastante atraente. Isso se deve a vários motivos: em primeiro lugar, tendo em conta vários componentes de ruído permite construir uma previsão sobre fatores independentes uns dos outros, o que pode melhorar a qualidade da previsão; em segundo lugar, as características de ruído da série de preços se comportam de maneira bastante estável ao longo d
Muitas vezes, no estudo das séries financeiras, aplica-se a suavização. Usando suavização, você pode remover componentes de alta freqüência - acredita-se que eles são causados ​​por fatores aleatórios e, portanto, irrelevantes. A suavização sempre inclui alguma forma de calcular a média dos dados, na qual alterações aleatórias na série temporal se absorvem mutuamente. Na maioria das vezes, para esse propósito, métodos de média móvel simples ou ponderados são usados, assim como a suavização expo
Para isolar componentes de longo prazo e não aleatórios, é necessário saber não apenas quanto o preço mudou, mas também como essas mudanças ocorreram. Em outras palavras, estamos interessados ​​não apenas nos valores dos níveis de preços, mas também na ordem em que esses níveis se substituem uns aos outros. Por meio dessa abordagem, é possível encontrar fatores estáveis ​​e de longo prazo que influenciam (ou podem influenciar) a mudança de preço em um determinado ponto no tempo. E o conheciment
Um dos métodos poderosos de análise é a modelagem de séries financeiras usando processos Levy. A principal vantagem desses processos é que eles podem ser usados ​​para modelar um grande número de fenômenos - do mais simples ao mais complexo. É suficiente dizer que a idéia do movimento dos preços fractais no mercado é apenas um caso especial dos processos de Levy. Por outro lado, com a seleção adequada de parâmetros, qualquer processo Levy pode ser representado como uma média móvel simples. A Fi
Muitas vezes, o comerciante é confrontado com a tarefa de determinar a medida em que o preço pode mudar no futuro próximo. Para este propósito, você pode usar o tipo de distribuição Johnson SB. A principal vantagem dessa distribuição é que ela pode ser usada mesmo com uma pequena quantidade de dados acumulados. A abordagem empírica usada na determinação dos parâmetros dessa distribuição permite determinar com precisão os níveis máximo e mínimo do canal de preço. Esses valores podem ser usados ​
Este indicador permite determinar a probabilidade de o preço atingir um ou outro nível. Seu algoritmo é bastante simples e baseia-se no uso de dados estatísticos nos níveis de preços de um par de moedas específico. Graças aos dados históricos coletados, é possível determinar até que ponto o preço será alterado durante a barra atual. Apesar de sua simplicidade, este indicador pode fornecer assistência inestimável na negociação. Assim, com sua ajuda, é possível determinar os níveis TakeProfit e S
Filtro:
Sem comentários
Responder ao comentário