NAM Divergences
- Indicadores
-
NAM TECH GROUP, CORP.
 A NAM Tech nasce do esforço de unificar as necessidades dos traders profissionais e a tecnologia de desenvolvimento premium. Com muitos anos de experiência, conseguimos trazer a melhor experiência do usuário em todos os nossos produtos.
 - Versão: 1.5
- Atualizado: 16 maio 2021
- Ativações: 10
Indicador de detecção MT4 Multi-timeframe Divergence e Overbougt / Oversold.
Características
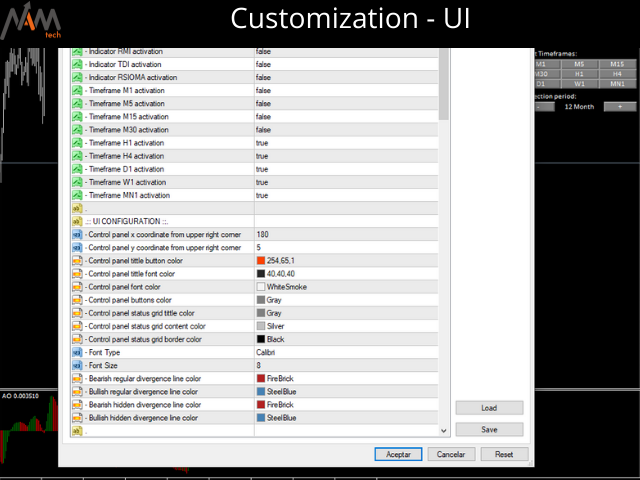
- Totalmente personalizável no painel de controle do gráfico, fornece interação completa.
- Oculte e mostre o painel de controle onde quiser.
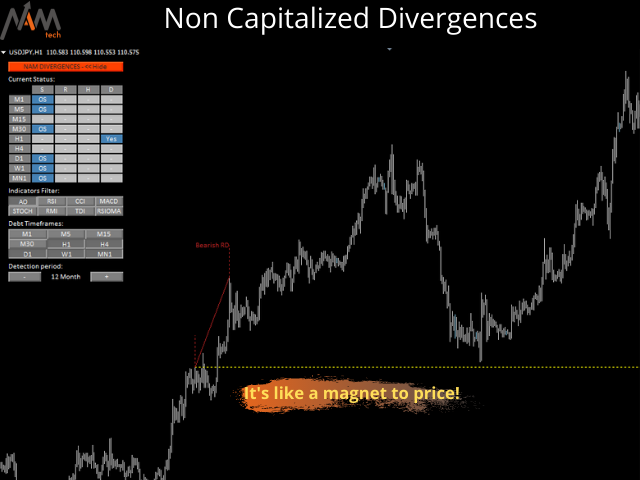
- Informação em tempo real sobre divergências não capitalizadas.
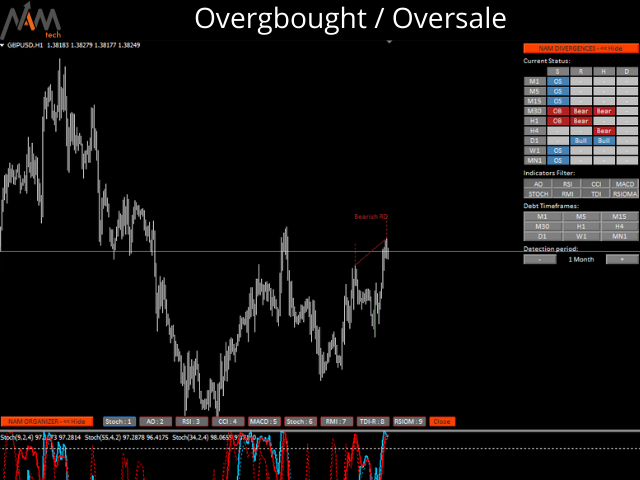
- Informações em tempo real sobre situações de sobrecompra / sobrevenda.
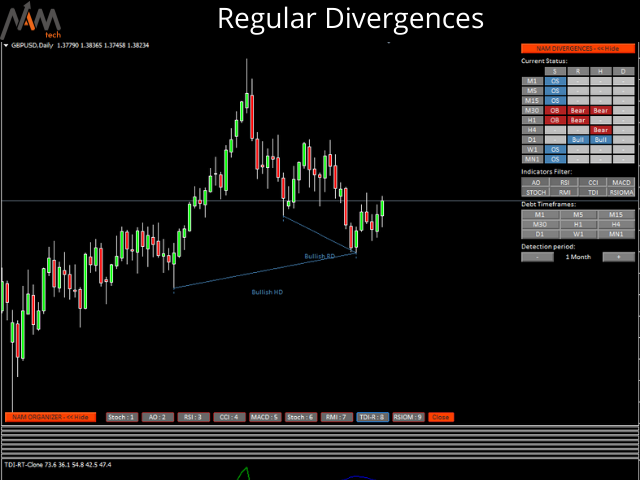
- Informações em tempo real sobre divergências regulares.
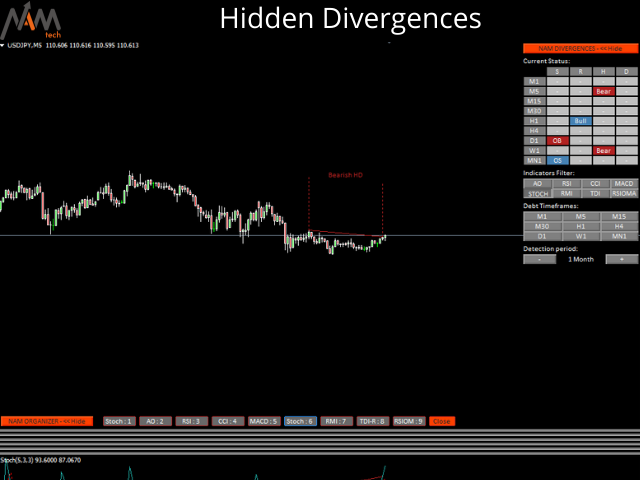
- Informações em tempo real sobre divergências ocultas.
- Osciladores disponíveis para detecção de divergências: AO, RSI, CCI, MACD, STOCH, RMI, TDI, RSIOMA.
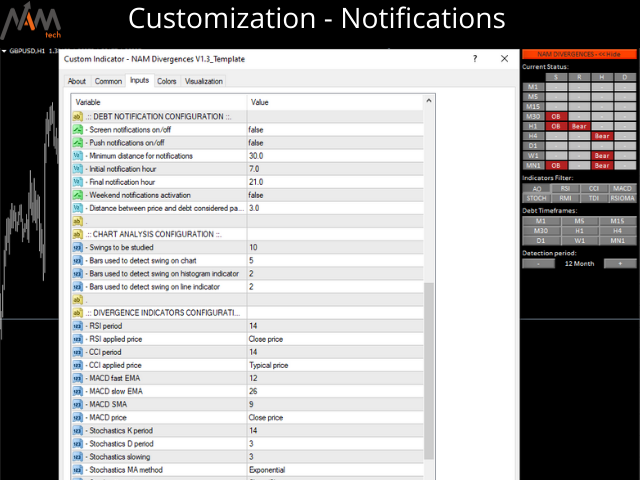
- Serviço de notificação (alertas de tela | notificações push).
Resumo
Usar a negociação por divergência pode ser útil para detectar uma tendência de enfraquecimento ou reversão no momento. Às vezes, você pode até mesmo usá-lo como um sinal para que uma tendência continue. Nossa ferramenta oferece detecção de divergências em todos os períodos de tempo simultaneamente, em um painel de controle incrivelmente confortável e intuitivo com a possibilidade de mostrar e ocultar, para manter seu gráfico o mais limpo possível.
Você verá em tempo real situações de sobrecompra e sobrevenda, divergências regulares, divergências ocultas e divergências não capitalizadas no período histórico de escolha.
Para divergências não capitalizadas, temos notificações na tela no MT4 e notificações push para o seu celular!

Muy completo y preciso... una pieza de relojería