KT Alpha Hunter Arrows MT4

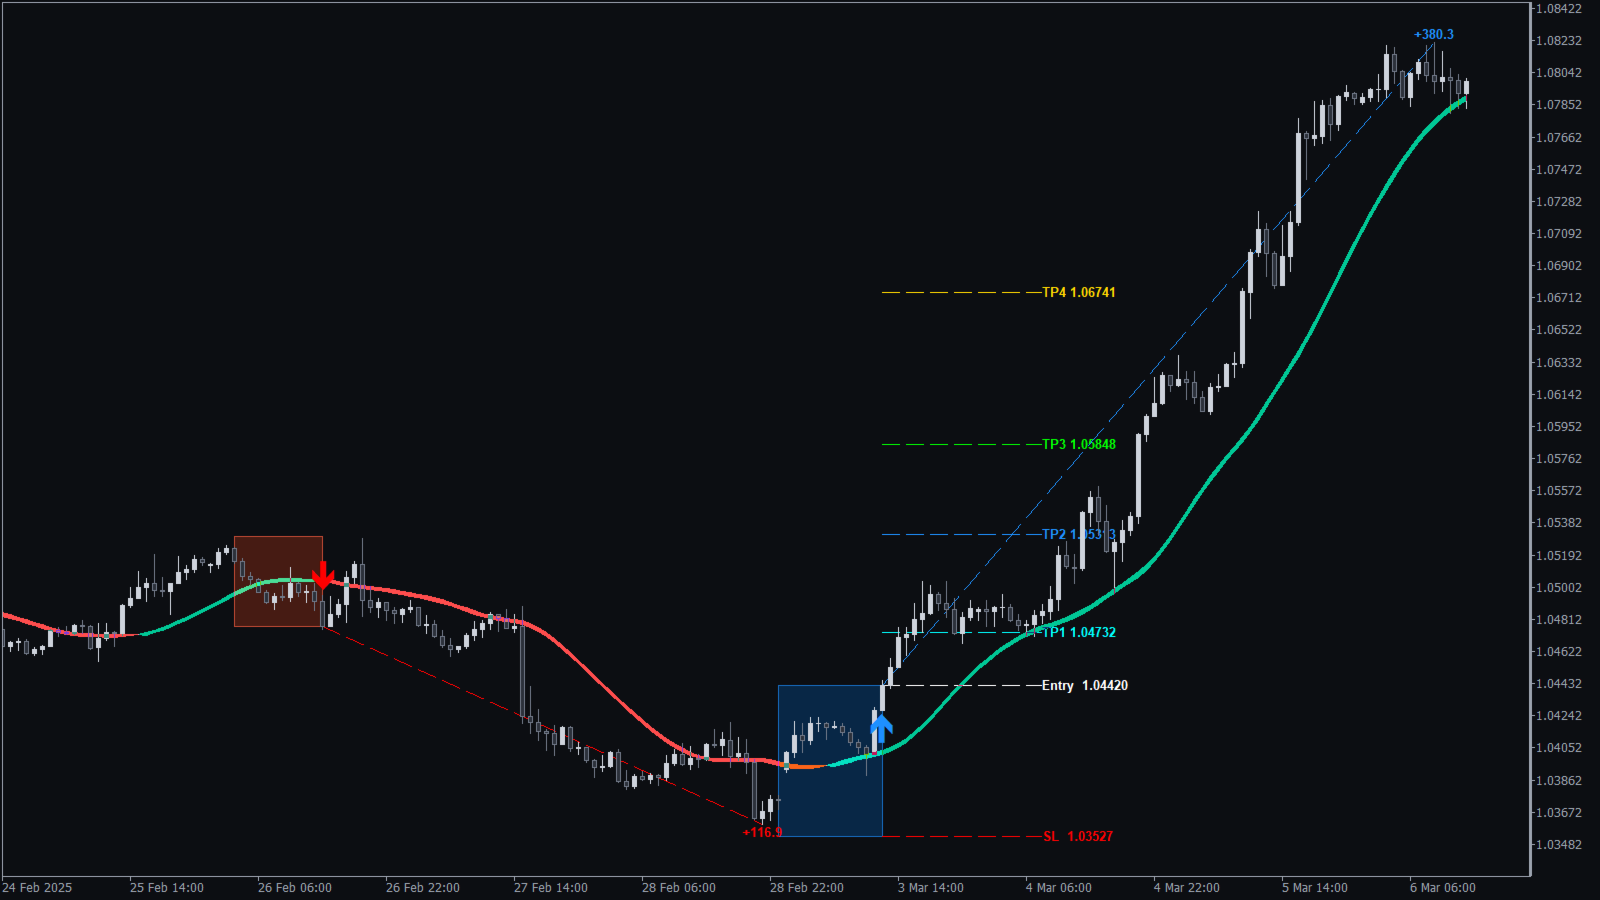
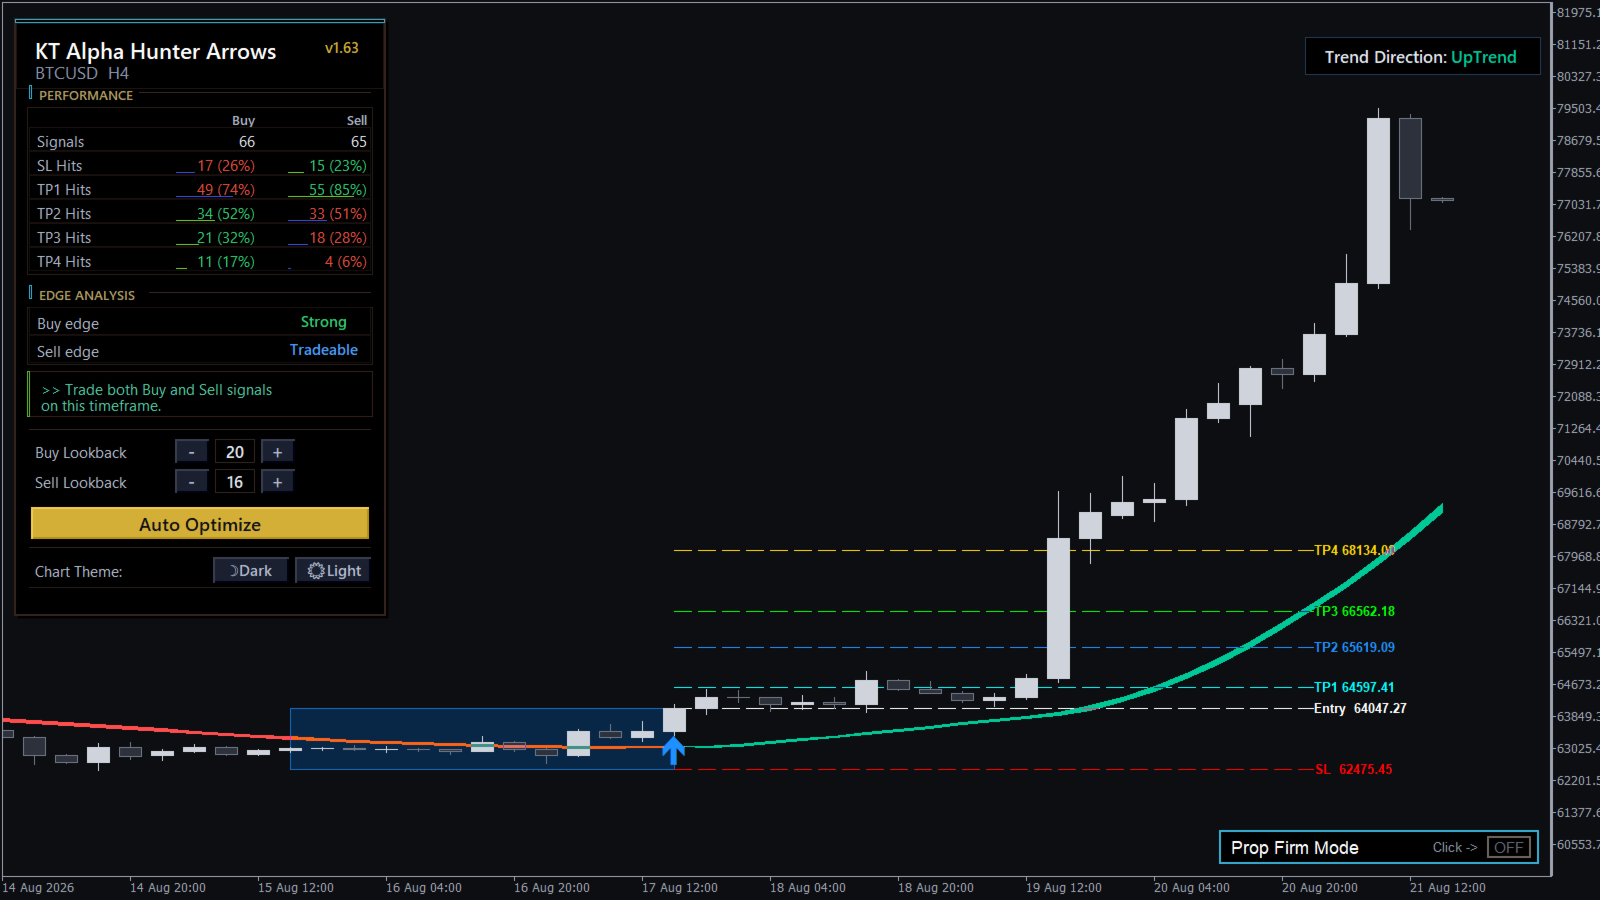
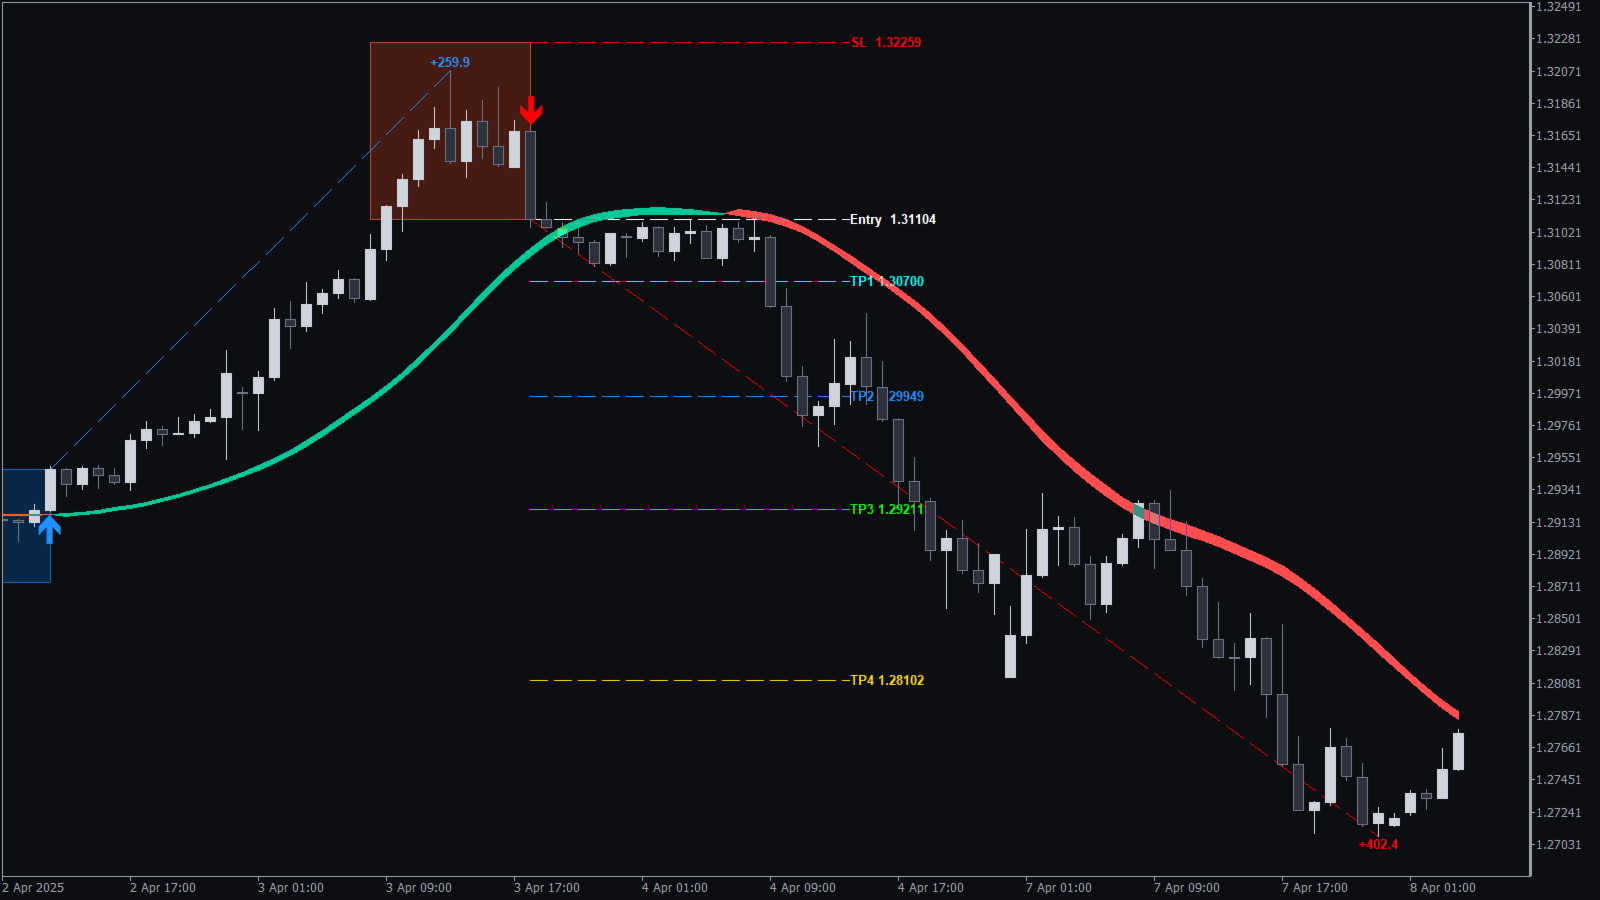
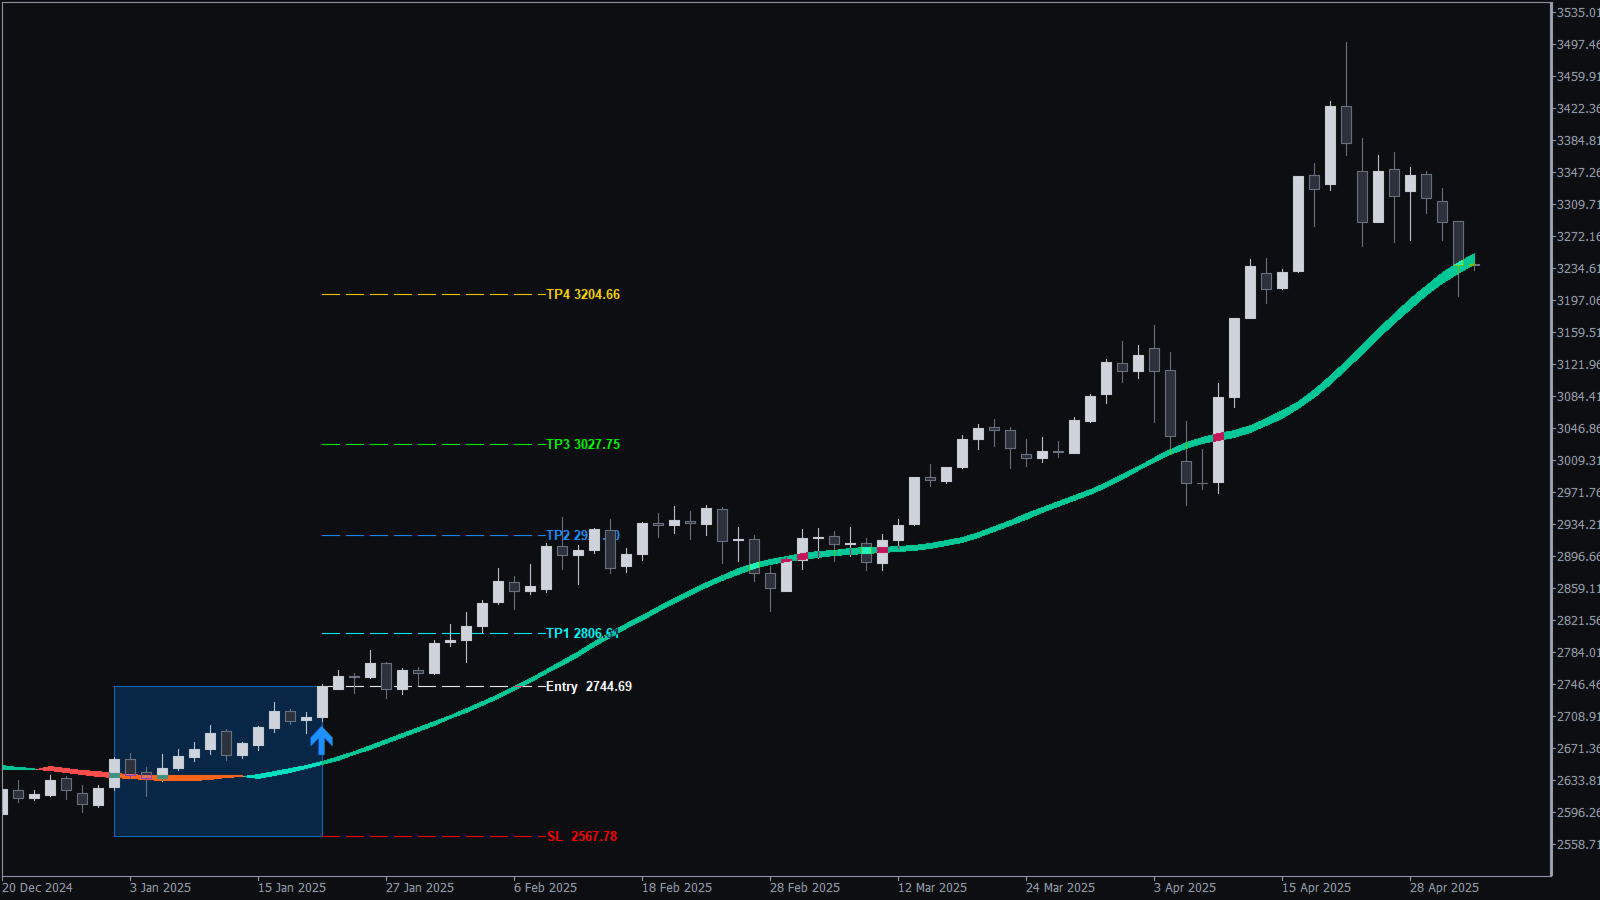
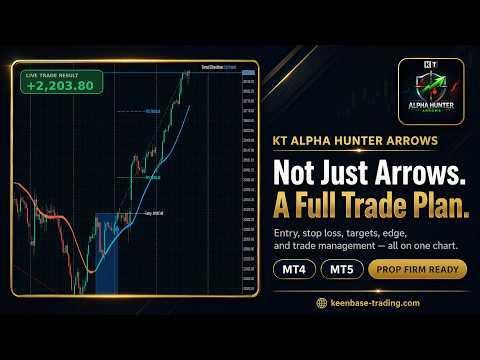
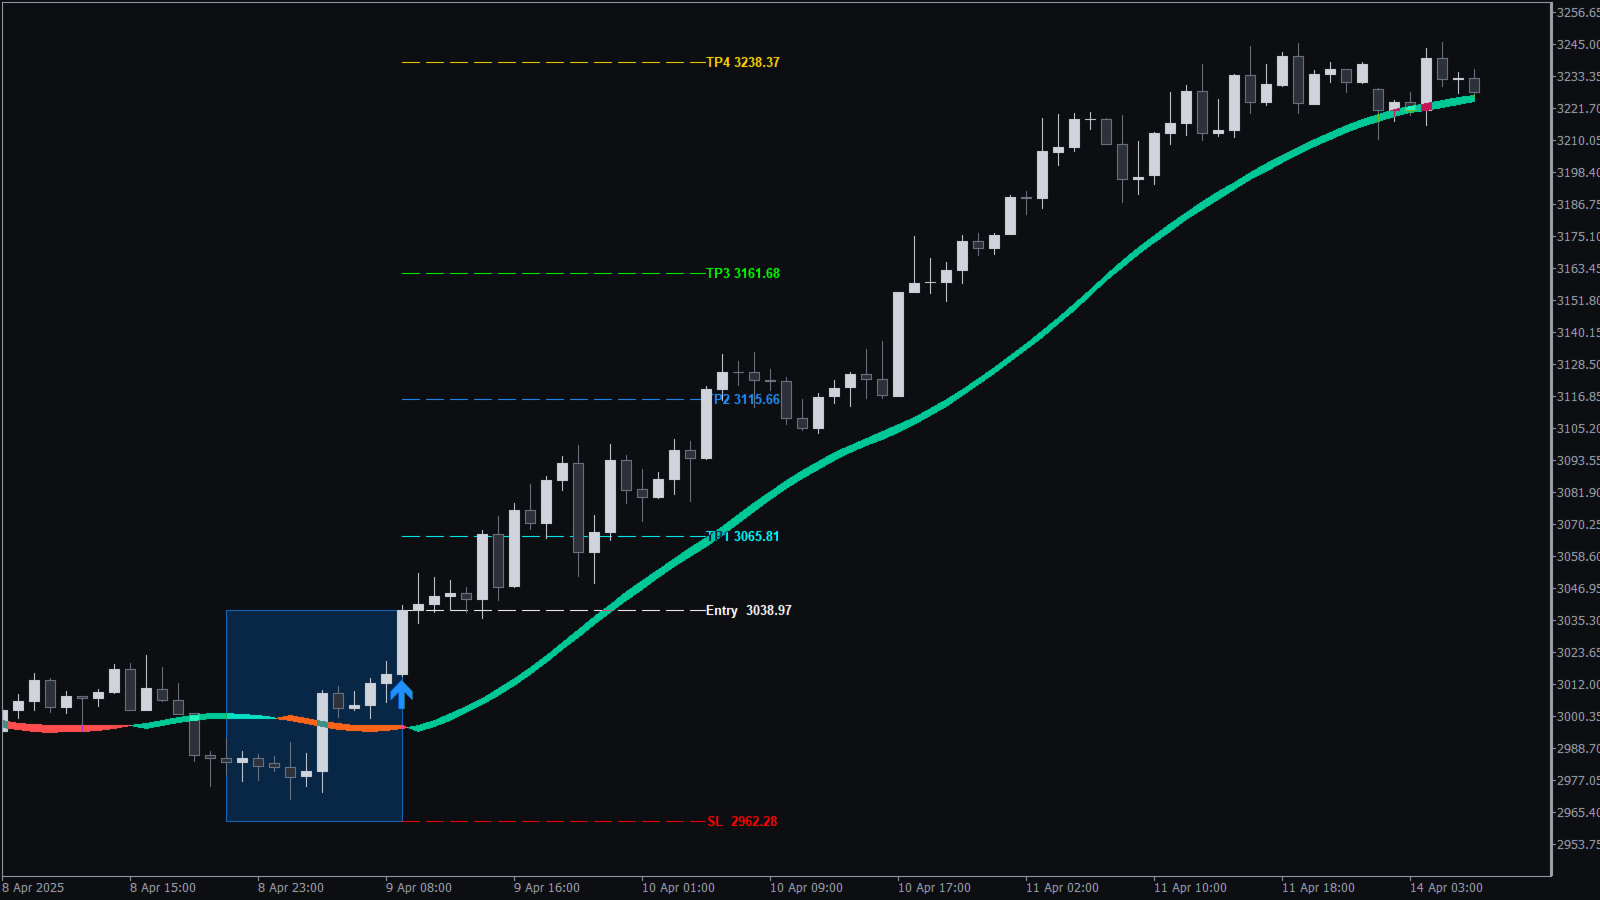
KT Alpha Hunter Arrows is a non-repaint buy and sell arrow indicator that puts the whole trade on your chart: the entry, the stop loss and four take profit levels. Its Edge Dashboard tells you whether the buy signals, the sell signals or both are worth trading on the symbol and timeframe you are looking at.

Every arrow prints when the candle closes and stays exactly where it printed. It never moves and never disappears later.

What you get on every chart

  • Non-repaint arrows. Buy and sell arrows on closed candles only.
  • A complete trade plan. The entry line, a stop loss placed beyond the recent swing, and four targets from TP1 to TP4 appear together with the arrow.
  • Edge Dashboard. Rates the buy signals and the sell signals separately, from No Edge to Strong, and gives one clear verdict: trade both sides, trade buys only, trade sells only, or skip this chart.
  • One click Auto Optimize. Tunes the settings to the chart you are on and updates the verdict.
  • Prop Firm Panel. Daily drawdown, total drawdown, open risk, the next high-impact news event and the market sessions, live on the chart.
  • Trend band and trend badge. The direction of the trend at a glance.
  • Alerts. Popup, push notification and email when a new arrow prints.


How to trade it

Attach the indicator and click Auto Optimize. Trade only the side the dashboard rates Tradeable, Good or Strong, and skip the chart when it shows No Edge. When an arrow prints, the entry, the stop loss and the targets are already on the chart. Skip an arrow if price has already reached TP1 before you enter.

After you enter, the Trade Manager EA can manage the trade with one of five plans: Protected Run to TP4, Bank Half and Run to TP4, Take Profit at TP2, Bank Quarter and Run to TP4, or Quick Profit at TP1. The EA never opens a trade on its own.

Recommendations

KT Alpha Hunter Arrows works on any symbol and timeframe your broker offers: forex pairs, gold, indices and crypto. Run Auto Optimize on each chart you watch and focus on the charts the dashboard rates well. The Edge Cheat Sheet lists the symbols and timeframes where the dashboard most often reads Good or Strong.

Input parameters

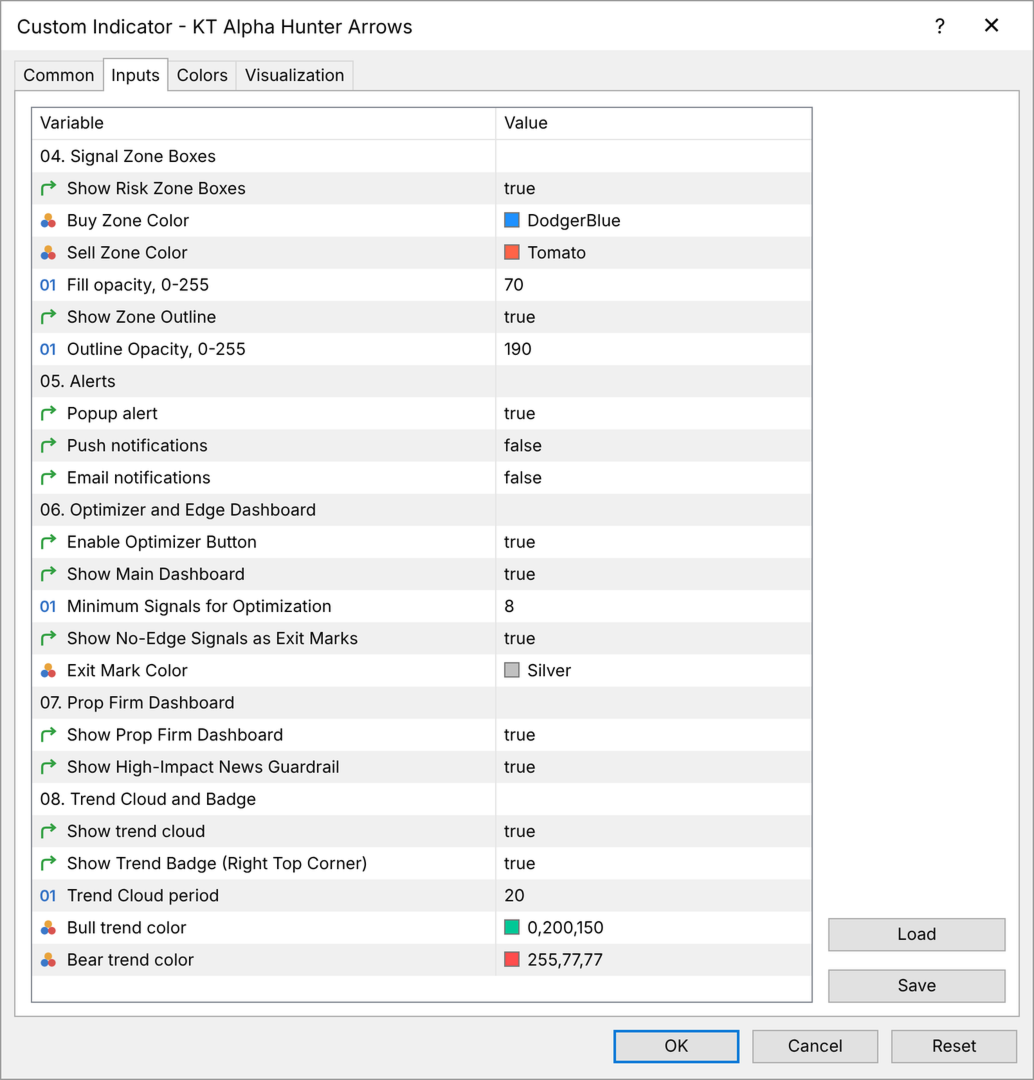
  • Signal Engine: adaptive lookbacks, the adaptive period, and the lookbacks for buy signals, sell signals and their stop losses.
  • Buy and Sell Arrows: arrow colors and arrow size.
  • Entry, Stop Loss and Take Profit: show or hide the levels, their colors, the TP1 risk fraction, the minimum TP3 gap, the length of the level lines and the maximum run lines.
  • Signal Zone Boxes: show or hide the risk zone boxes, their colors and opacity.
  • Alerts: popup, push notification and email.
  • Optimizer and Edge Dashboard: the Auto Optimize button, the dashboard, the minimum number of signals for optimization, and the option to show signals without an edge as exit marks.
  • Prop Firm Dashboard: the panel and the high-impact news guardrail.
  • Trend Cloud and Badge: the trend band, the trend badge, the trend band period and colors.


What you receive

MQL5 delivers the indicator with all future updates. The Trade Manager EA, the User Manual PDF and the Edge Cheat Sheet PDF come directly from us: after your purchase, send us a private message on MQL5 and you receive them within one business day.

One indicator gives you the signal, the stop loss, four targets, an honest rating of the edge, and a panel that keeps your account rules in view. Choose KT Alpha Hunter Arrows and trade every arrow with a plan.
Produtos recomendados
Trend Flasher Trend is your friend is the age old saying quote in trading arena, there are though many ways to gauge the trend and its direction, more scientific measure and logically meaningful will be an ATR break outs to identify and spot the trend and its acceleration, so we created this easy to use trend identification panel and optimized super trend based multi time frame panel entry system to aid and help the traders to make their trading decision. Unique Features of Trend Flasher 1. H
"Dynamic Scalping Oscillator" - um indicador avançado e personalizado para Crypto_Forex - uma ferramenta de negociação eficiente para MT4! - Nova geração de osciladores - veja as imagens para saber como usá-lo. - O Dynamic Scalping Oscillator possui zonas adaptáveis de sobrevenda/sobrecompra. - O oscilador é uma ferramenta auxiliar para encontrar pontos de entrada exatos em áreas dinâmicas de sobrevenda/sobrecompra. - Valores de sobrevenda: abaixo da linha verde, valores de sobrecompra: acima d
Dear Traders this is my another tool called " Swing Master Indicator ". As the name above the indicator is designed to help you in swing trading by capturing the low and highs of the price. You may us this tool with any trading strategy and style from scalping to position trading. It is made for level of traders including newbies and advanced traders even prop-firms, hedge funds and banks to help them make sold market analysis. I create tools for serious traders who want to make a difference in
Binary Options Support Resistance Indicator This indicator is designed for binary options trading and effectively shows retracements from support and resistance levels. Signals appear on the current candle. A red arrow pointing downwards indicates a potential selling opportunity, while a blue arrow pointing upwards suggests buying opportunities. All that needs adjustment is the color of the signal arrows. It is recommended to use it on the M1-M5 timeframes as signals are frequent on these timef
No mundo das negociações de opções binárias, onde a análise de mercado precisa e a tomada de decisões estratégicas são primordiais, a busca por um indicador excepcional de negociação que possa desbloquear oportunidades lucrativas é interminável. Apresentamos o Indicador Secreto - uma notável ferramenta de negociação de opções binárias para o MT4 que conquistou sua reputação como o melhor e mais forte de sua classe. O Indicador Secreto é resultado de anos de pesquisa meticulosa, desenvolvimento
Indicator for binary options arrow is easy to use and does not require configuration works on all currency pairs, cryptocurrencies buy signal blue up arrow sell signal red down arrow tips do not trade during news and 15-30 minutes before their release, as the market is too volatile and there is a lot of noise it is worth entering trades one or two candles from the current period (recommended for 1 candle) timeframe up to m 15 recommended money management fixed lot or fixed percentage of the depo
Shark Deal Book
Philip Pankaj Suthagar
4 (3)
Term  "shark"  in the business world denotes a high volume investor who just made a good investment in a highly Potential business deal.So, sharks are the ones who make the market move. In our case, if an American shark bought a Japanese company, he/she has to convert American dollars into Japanese yen to make the deal. So, the demand for the Japanese yen will increase sharply. Thus USD/JPY will go short rapidly if the deal was from the shark. Another example, In the case of forex, if fed increa
Reversal Edge System is a professional top-bottom reversal indicator built for MetaTrader 5. It identifies potential trend reversal zones and generates clear trade signals, filtered by multi-timeframe trend analysis to reduce false setups. The indicator displays market sentiment in real time: Strong Bullish Strong Bearish Bullish Bias Bearish Bias Bull-Bear Divergence Each signal comes with predefined Take Profit and Stop Loss levels for proper risk management. It includes signal backtest functi
EARLY REMINDER: The Starting price is 65 price will rise soon up to 365$ and then 750$ after first 10 copies of sales. Grab this offer now! Introduction Hello, traders! Welcome to the demonstration of the Forex Beast Indicator , a comprehensive tool designed to assist aspiring traders in navigating the complexities of the forex market. This indicator incorporates seven essential components to provide a well-rounded trading experience: Moving Averages Colored Zones Support and Resistance Levels
This Indicator is use the ZigZag to calculate the Upper and  Lower Bound and the uptrend and the downtrned. Red for downtrend, Green for uptrend and Yellow is for the horizontal trend this horizontal trend also bookmarked the upper limited and the lower limited the the price swings.  Or in simple the Support and the Resistance level. However, You may use the Heikin Ashi to confirm the trend of the buy sell signal above. I cannot guarantee the win rate, Nevertheless, you must study well the timef
Night ghost
Dmitriy Kashevich
Night Ghost - Indicador de seta para opções binárias. Este é um assistente confiável para você no futuro! - Sem redesenho no gráfico -Funciona muito bem em todos os pares de moedas! -Precisão do indicador de até 90% (especialmente à noite) -Não há necessidade de configurar por um longo tempo (Configurar perfeitamente para Opções Binárias) - Sem sinais de atraso - O aparecimento de um sinal na vela atual -Perfeito para o período M1 (não mais!) - Cor de vela amigável aos olhos (vermelho
Limitless MT4
Dmitriy Kashevich
O MT4 ilimitado é um indicador universal que se adequa a todos os comerciantes iniciantes e experientes. funciona em todos os pares de moedas, criptomoedas, ações em bruto MT4 ilimitado - já configurado e não requer configuração adicional E agora a principal coisa Por que o MT4 ilimitado? 1 falta completa de redesenho 2 dois anos de testes pelos melhores especialistas em negociação 3 a precisão dos sinais corretos excede 80% 4 teve bom desempenho nas negociações durante os comunicados d
FFB Isis Scalper
Andre Camara De Mattos -
Apresentando ISIS SCALPER para MetaTrader 4: Inovação além do tradicional! Descubra o futuro das estratégias de negociação com o nosso indicador inovador, cuidadosamente concebido para transcender as limitações dos produtos convencionais. Este não é apenas mais um indicador, mas uma ferramenta flexível e poderosa que permite aos traders explorar todo o potencial do mercado. Recursos excepcionais: Versatilidade ilimitada: Projetado para se adaptar a qualquer ativo e período de tempo, nosso indic
Next level of trend trading here. Possibility 75%, the indicator analyzes the current market to determine short (small dot), middle (circle with a dot inside) and long (cross with a circle and a dot inside) trends.  Wingdings characters of  Aqua color represents the beginning of the UP trend. Wingdings characters of  Orange color represents the beginning of the DOWN trend. Possibility 75% Indicator will improve your trading in the world of forex, commodities, cryptocurrencies and indices.
PowerTech Prop Trading System PRO Intraday mapping, multi-source macroeconomic filtering, high-timeframe structural liquidity, and account risk control architecture engineered natively for MetaTrader 4 (MT4). Built specifically for Prop Firm Traders, Funded Account Challengers, and Day Traders, PowerTech Prop Trading System PRO organizes your intraday workflow directly on the chart: Asian/Tokyo accumulation boxes, multi-tier breakout target expansions, live prop-firm exposure tracking, automa
ShvedSupDem Pro Zone
Andrey Shvedov
4.6 (5)
Part of the Shved Market Analytics System (SMAS). ShvedSupDem Pro Zone(Chart Pro) is one of the core modules of the SMAS ecosystem—a professional market analysis system built around supply and demand, market structure, and multi-timeframe confirmation. ShvedSupDem Pro Zone(Chart Pro) is a professional indicator for automated drawing of Supply and Demand zones directly on the chart of the MetaTrader 4 terminal. The indicator automatically identifies and plots key market imbalance areas where
Two Candles to Glory
Ellan Dirgantara Tholkhah
This is a Binary Options signal indicator. Extremely powerful for the 1 min chart. The signals are based on my personal tweak (based on real trial and error & backtested) of the RSI, ADX and Ichimoku and my observation on how price moves. It turns out, 2 candles expiry is the most consistent with this set up. How to use: 1. Wait for arrow signal to show. 2. Place a 2 candle expiry right after the close of the signal candle. So if you are trading a 1 min chart, place an expiry for 2 mins... if yo
Introducing the "Magic Trades" for MetaTrader 4 – your ultimate tool for precision trading in dynamic markets. This innovative indicator revolutionizes the way you perceive market trends by harnessing the power of advanced analysis to detect subtle changes in character, paving the way for optimal trading opportunities. The Magic Trades Indicator is designed to empower traders with insightful entry points and well-defined risk management levels. Through its sophisticated algorithm, this indicato
VR Cub
Vladimir Pastushak
VR Cub é um indicador para obter pontos de entrada de alta qualidade. O indicador foi desenvolvido para facilitar cálculos matemáticos e simplificar a busca por pontos de entrada em uma posição. A estratégia de negociação para a qual o indicador foi escrito tem provado a sua eficácia há muitos anos. A simplicidade da estratégia de negociação é a sua grande vantagem, o que permite que até mesmo os comerciantes novatos negociem com sucesso com ela. VR Cub calcula os pontos de abertura de posição e
GP Confluence Scanner MT4 Advanced Multi-Timeframe Market Structure & Confluence Analysis Don't get stopped out easily again! GP Confluence Scanner MT4 is an advanced technical analysis indicator developed for MetaTrader 4, designed to reveal important market levels, hidden support and resistance, and multiple technical confluences before entering a setup. Rather than relying on a single indicator, GP Confluence Scanner combines multiple analytical techniques to identify areas where significant
1.Indicator gives key trade levels with red and green arrows. 2. You need to manually mark these trade levels on higher time frame with horizontal line or area and take the trades based on price action on  lower timeframe at these trade levels. For example, see rejection or violation of these trade levels to go along or reverse the trade. (See attached screenshot) 3. You need to manually turn off signals for lower timeframes you comfortable working with. 4. Please note that you need to manually
This indicator draws the volume bars as a colour gradient instead of a single flat colour, so that strong and weak volume can be told apart at a glance. Every bar is compared with the average volume over a lookback period you set. The further a bar stands above that average, the deeper its colour; bars near or below the average are drawn in a pale shade. The hue follows the candle direction, one colour for volume on rising candles and another for volume on falling candles, so the balance betwe
Adx open calculed
Teresinha Moraes Correia
Indicador ADX Personalizado Baseado Apenas no Preço de Abertura O indicador ADX padrão normalmente é calculado com base nos preços de máxima (High), mínima (Low) e fechamento (Close) . Isso gera uma linha suave e visualmente agradável que representa a ação do preço. No entanto, ️ ele falta precisão — à medida que o candle se move, os valores do ADX, +DI e -DI também mudam repentinamente, podendo gerar sinais falsos com base na plotagem inicial do candle. Uma observação curiosa: mesmo qua
Quantum Falcon Signal Free is a smart visual trading indicator for MetaTrader 4 designed for Forex and Gold traders. The indicator combines: • Trend analysis • RSI momentum confirmation • MACD momentum filtering • ATR volatility filtering • Higher timeframe confirmation • Smart exit signal detection Main Features: • Smart Buy and Sell signals • Exit Buy / Exit Sell alerts • Real-time dashboard on chart • Professional candle arrows • Multi-timeframe trend confirmation • ATR market volatility filt
FREE
VWAP Volume Price Customized Cycle FX-AIEA — Multi-Timeframe Anchored VWAP Indicator (Technical Features & Parameter Discussion) Overview This indicator extends the traditional VWAP (Volume Weighted Average Price) with multi-timeframe anchoring and customizable session reset mechanisms, aiming to provide a dynamic "fair value" reference area. The indicator constructs symmetric volatility boundaries via triple standard deviation channels (±1σ/±2σ/±3σ), which can serve as reference dynamic support
Bollinger Trend Lines – MT4 & MT5 Bollinger Trend Lines   is a professional volatility-based trend indicator designed to clearly identify trend direction and dynamic stop levels using Bollinger Bands. Fuses on one core principle: follow the trend, ignore noise, and let volatility define the stop. How it works The indicator builds   trailing trend lines   using Bollinger Bands: In an   uptrend , the   lower band trails price and can only rise In a   downtrend , the   upper band trails pri
Solução Breakout Pro Scalper Este indicador faz parte dos sistemas RPTrade Pro Solutions. Breakout Pro Scalper Solution é um indicador de tendência diária usando Price Action, Dynamic Support e Resistances. Ele foi projetado para ser usado por qualquer pessoa, mesmo o iniciante absoluto na negociação pode usá-lo. NUNCA repinta. As indicações são dadas de perto para perto. Projetado para ser usado sozinho, nenhum outro indicador é necessário. Dá-lhe a tendência e potencial Take Profit no início
Os conceitos deste indicador, que lhe conferem uma vantagem única e precisa, baseiam-se na "TEORIA" DE GAPS DE VALOR JUSTO, concebida e aprimorada por Arjo, um dos melhores mentores, e eu contribuí com o desenvolvimento dos conceitos explicados. A série de vídeos incluirá links originais do YouTube para explicações completas e abrangentes, além de capturas de tela do sistema MT4/MT5 em execução. Todos os sistemas publicados estarão disponíveis separadamente para MT4 e MT5, para atender a todas a
Part of the Shved Market Analysis System (SMAS). Identifies areas of maximum Supply and Demand zone density and confluence, providing deeper market insight as part of the integrated SMAS ecosystem. Shved Supply and Demand Cluster Profile is a revolutionary, high-performance visualization tool designed to map market volume density and supply/demand zone clusters, created by a professional trader for traders. The Shved Supply and Demand Cluster Profile is a core component and the analytical h
Embark on the pinnacle of Binary Options evolution. Our indicator isn't just adaptive—it's relentless. Picture a ninja riding a serpent, shadowing its every move; that's how this tool trails the market trend, unwavering till the end. Built upon the foundational prowess of the Ichimoku indicator and honed with an array of fine-tuned oscillators, it epitomizes accuracy and precision. Dive deep without getting lost in the Ichimoku's intricacies—our indicator simplifies the process for you. Perhaps
Os compradores deste produto também adquirem
Super Signal – Skyblade Edition Sistema profissional de sinais de tendência sem repintar / sem atraso com taxa de acerto excepcional | Para MT4 / MT5 Funciona melhor em timeframes mais curtos, como 1 minuto, 5 minutos e 15 minutos. Principais características: Super Signal – Skyblade Edition é um sistema inteligente de sinais desenvolvido especificamente para operações com tendência. Utiliza uma lógica de filtragem em múltiplas camadas para detectar apenas movimentos direcionais fortes sustenta
Miraculous Indicator Binary & Forex v3 StrategySafe Miraculous Indicator Binary & Forex v3 StrategySafe é um indicador profissional criado para traders que desejam sinais claros, confirmações avançadas e uma forma estruturada de operar nos mercados Binary e Forex. A versão v3 traz MIR Dashboard, Miraculous Confirmation Dashboard, GANN Law, níveis Square of 9, ângulos GANN e um modo Forex mais completo para analisar o mercado com mais precisão. Principais recursos Modo Binary e modo Forex em um ú
All in One package includes the  Oscillator Predictor ,  MACD Predictor ,  Thrust Scanner  and  Advanced Fibonacci  indicators which are mandatory for applying  Dinapoli  trade plans.  Please visit below links for detailed explanations of indicators. Advanced Fibonacci Indicator =>  https://www.mql5.com/en/market/product/52834 Thrust Scanner Indicator => https://www.mql5.com/en/market/product/52830 Overbought /Oversold Predictor indicator => https://www.mql5.com/en/market/product/52621 Macd P
Sinal de tendência GoldRush Arrow O indicador Sinal de tendência GoldRush Arrow fornece uma análise precisa e em tempo real das tendências, adaptada para scalpers de alta velocidade e curto prazo em XAU/USD. Criada especificamente para o intervalo de tempo de 1 minuto, esta ferramenta exibe setas direcionais para pontos de entrada claros, permitindo que os scalpers naveguem em condições de mercado voláteis com confiança. O indicador consiste em setas de alerta PRIMÁRIAS e SECUNDÁRIAS. Os sin
OrderFlow Absorption – Indicador Profissional de Delta e Sinais de Absorção para MT4 Desbloqueie o poder da verdadeira análise de fluxo de ordens com o OrderFlow Absorption – o indicador definitivo de histograma de delta e sinais de absorção para MetaTrader 4. Desenvolvido para traders que desejam enxergar o que realmente acontece por trás de cada movimento de preço, esta ferramenta revela pressões ocultas de compra/venda e eventos de absorção que movimentam o mercado. Recursos Visualização do H
ORB Seeker
Marcela Goncalves De Oliveira
4 (1)
Preço especial para limitar a disponibilidade e manter a escassez do produto! Apenas $599! Após a compra, entre em contato comigo para receber o EA ORB Seeker bônus e os arquivos de configuração otimizados personalizados. Faça sessões de tratamento eficazes com confiança! O ORB Seeker é um indicador profissional de Ruptura da Faixa de Abertura (ORB, na sigla em inglês) desenvolvido para traders que buscam precisão, simplicidade, flexibilidade e uma estrutura de gráfico clara. Ele traça automat
IQ FX Gann Levels a precision trading indicator based on W.D. Gann’s square root methods . It plots real-time, non-repainting support and resistance levels to help traders confidently spot intraday and scalping opportunities with high accuracy. William Delbert Gann (W.D. Gann) was an exceptional market analyst, whose trading technique was based on a complex blend of mathematics, geometry, astrology, and ancient mathematics which proved to be extremely accurate. We don't offer free or bonus indic
Gold Channel   é um indicador baseado na volatilidade, desenvolvido com um algoritmo de tempo especifico para o par XAUUSD que consiste em encontrar possíveis correções no mercado. Este indicador mostra duas linhas exteriores, uma interior (linha de retração) e um sinal de seta, onde a teoria do canal consiste em ajudar a identificar condições de sobrecompra e sobrevenda no mercado. O preço do mercado cairá geralmente entre os limites do canal. Se os preços tocarem ou se moverem para fora do can
Meravith
Ivan Stefanov
5 (3)
Ferramenta dos market makers. O Meravith irá: Analisar todos os timeframes e exibir a tendência atual em vigor. Destacar zonas de liquidez (equilíbrio de volume) onde o volume comprador e vendedor é igual. Mostrar todos os níveis de liquidez de diferentes timeframes diretamente no seu gráfico. Gerar e apresentar análise de mercado em formato de texto para sua referência. Calcular alvos, níveis de suporte e pontos de stop-loss com base na tendência atual. Calcular a relação risco/retorno das sua
Linear Trend Predictor - Um indicador de tendência que combina pontos de entrada e linhas de apoio de direção. Funciona com base no princípio de quebrar o canal de preço alto/baixo. O algoritmo do indicador filtra o ruído do mercado, tem em conta a volatilidade e a dinâmica do mercado. Capacidades do indicador  Utilizando métodos de suavização, mostra a tendência do mercado e os pontos de entrada para abrir ordens de COMPRA ou VENDA.  Adequado para determinar os movimentos de mercado de curto
Binary Booster
Yaroslav Varankin
5 (1)
Binary Options Trading Indicator: A Reliable Tool for Your Trades This indicator is specifically designed for binary options trading and has proven its high quality, reliability, and adequate accuracy, depending on the dynamics of the chart. Key Points: Signal Interpretation: When a blue cross signal appears, it indicates a potential entry into a trade, though it is considered a weak signal on its own. However, if the blue cross is accompanied by an arrow, it is considered a more reliable buy s
MagicTrigger — Indicador de confirmação de divergência HD/RD multi-timeframe O MagicTrigger é um mecanismo de divergência multi-timeframe que procura uma divergência estrutural num timeframe superior (HD) e aguarda a sua confirmação por divergências equivalentes em timeframes inferiores (RD) dentro da mesma zona de preço. O indicador só assinala um sinal quando a estrutura do timeframe superior e as confirmações dos timeframes inferiores coincidem, juntamente com um ponto de entrada sugerido, st
Enigmera
Ivan Stefanov
5 (9)
ENIGMERA: O núcleo do mercado Importante: A demonstração do MQL5.com funciona no Strategy Tester e pode não refletir completamente a funcionalidade do Enigmera. Verifique a descrição, as capturas de tela e o vídeo para mais detalhes. Fique à vontade para me enviar uma mensagem com qualquer dúvida! O código do indicador foi completamente reescrito. A versão 3.0 adiciona novas funcionalidades e corrige erros acumulados desde o início do indicador. Introdução Este indicador e sistema de negociação
First time on MetaTrader, introducing IQ Star Lines - an original Vedic Astrology based indicator. "Millionaires don't use astrology, billionaires do" . - J.P. Morgan, Legendary American financier and banker. We don't offer free or bonus indicators in exchange of reviews from you. You won't need any free products with this indicator to make it work. ;) Enjoy! Welcome to  the new and updated  IQ Star Lines , the ultimate fusion of ancient planetary harmonic cycles and modern quantitative trading.
Algo Trading Indicaor  With this indicator , you’ll have zones and trends that hight probability the price will reverse from it. so will gives you all the help that you need  MT5 Version                    https://www.mql5.com/en/market/product/170028 MT4 Version                    https://www.mql5.com/en/market/product/88034 Why should you join us !?  1-This indicator is logical since it’s working in previous days movement , to predict the future movements. 2-Algo trading indicator will hel
CVD Divergência - Análise Avançada de Delta de Volume   O PROBLEMA QUE RESOLVEMOS A maioria dos traders depende apenas da ação do preço, perdendo informações cruciais do fluxo de volume que revelam o verdadeiro sentimento do mercado. Indicadores tradicionais ficam atrasados em relação aos movimentos de preço, causando entradas tardias e má gestão de riscos. CVD Divergência resolve isso analisando a relação entre preço e momentum de delta de volume, dando-lhe sinais de alerta precoce antes de
How to use Pair Trading Station Pair Trading Station is recommended for H1 time frame and you can use it for any currency pairs. To generate buy and sell signal, follow few steps below to apply Pair Trading Station to your MetaTrader terminal. When you load Pair Trading Station on your chart, Pair Trading station will assess available historical data in your MetaTrader platforms for each currency pair. On your chart, the amount of historical data available will be displayed for each currency pai
FFx Engulfing Setup Alerter gives trade suggestions with Entry, Target 1, Target 2 and StopLoss. Below are the different options available: Entry suggestion - pips to be added over the break for the entry 3 different options to calculate the SL - by pips, by ATR multiplier or at the pattern High/Low 3 different options to calculate the 2 TPs - by pips, by ATR multiplier or at Risk/Reward Offset the dashboard - any place on the chart Remove the suggestion once the price reached the SL line Lines
FFx InsideBar Setup Alerter gives trade suggestions with Entry, Target 1, Target 2 and StopLoss. Below are the different options available: Entry suggestion - pips to be added over the break for the entry Minimum candle size - to avoid too close buy/sell entry suggestions 3 different options to calculate the SL - by pips, by ATR multiplier or at the pattern High/Low 3 different options to calculate the 2 TPs - by pips, by ATR multiplier or at Risk/Reward Offset the dashboard - any place on the c
FFx OutsideBar Setup Alerter gives trade suggestions with Entry, Target 1, Target 2 and StopLoss. Below are the different options available: Entry suggestion - pips to be added over the break for the entry. 3 different options to calculate the SL - by pips, by ATR multiplier or at the pattern High/Low. 3 different options to calculate the 2 TPs - by pips, by ATR multiplier or at Risk/Reward. Offset the dashboard - any place on the chart. Remove the suggestion once the price reached the SL line.
FFx PinBar Setup Alerter gives trade suggestions with Entry, Target 1, Target 2 and StopLoss. Below are the different options available: Entry suggestion - pips to be added over the break for the entry Minimum candle size - to avoid too small candles 3 different options to calculate the SL - by pips, by ATR multiplier or at the pattern High/Low 3 different options to calculate the 2 TPs - by pips, by ATR multiplier or at Risk/Reward Offset the dashboard - any place on the chart Remove the sugges
Automatic, live & interactive picture of all trendlines. Assign push, email and sound alerts to the lines of your choice and be informed about price rollback, breakout, rollback after breakout, number of rollbacks, line expiration by double breakout. Correct, drag or delete the lines and interactively tune the line system. https://youtu.be/EJUo9pYiHFA . Chart examples https: //www.mql5.com/en/users/efficientforex Price Interaction Events All events are effective immediately and only after one
The purpose of this new version of the MT4 standard indicator provided in your platform is to display in a sub-window multiple timeframes of the same indicator with its divergences. See the example shown in the picture below. But the display isn't like a simple MTF indicator. This is the real display of the indicator on its timeframe. Here's the options available in the FFx divergences indicator: Select the timeframes to be displayed (M1 to Monthly) Define the width (number of bars) for each tim
The purpose of this new version of the MT4 standard indicator provided in your platform is to display in a sub-window multiple timeframes of the same indicator with its divergences. See the example shown in the picture below. But the display isn't like a simple MTF indicator. This is the real display of the indicator on its timeframe. Here's the options available in the FFx divergences indicator: Select the timeframes to be displayed (M1 to Monthly). Define the width (number of bars) for each ti
The FFx Dashboard MTF alerter will show you on a single chart all the timeframes (M1 to Monthly) with their own status for the indicator. 2 Alert Options: Single timeframe: each selected timeframe alert separately when a signal occurs Multi timeframes: all selected timeframes must agree for an alert to be triggered Both options have an input to select the timeframes to be used for the alert(s). How to Understand the Status: Green/Red square: histogram above/below 0 line Green square + Red bord
The FFx Dashboard MTF alerter will show you on a single chart all the timeframes (M1 to Monthly) with their own status for the indicator. 2 Alert Options: Single timeframe: each selected timeframe alert separately when a signal occurs Multi timeframes: all selected timeframes must agree for an alert to be triggered Both options have an input to select the timeframes to be used for the alert(s). How to understand the status: Green/Red square: RSI above/below 50 line Green square + Red border: R
The FFx Dashboard MTF alerter will show you on a single chart all the timeframes (M1 to Monthly) with their own status for the indicator. 2 Alert Options: Single timeframe: each selected timeframe alert separately when a signal occurs Multi timeframes: all selected timeframes must agree for an alert to be triggered Both options have an input to select the timeframes to be used for the alert(s). How to understand the status: Green/Red square: Stoch above/below 50 line Green square + Red border:
Mais do autor
KT Support and Resistance Levels MT5
KEENBASE SOFTWARE SOLUTIONS
5 (1)
KT Auto Support Resistance Levels: S&R multi-timeframe, Smart Zones e painel de níveis para MetaTrader 4/5 Topos de swing. Pivôs. Order blocks. Máximas e mínimas anteriores. Cada trader marca o mercado de um jeito um pouco diferente, e quem paga o preço é o gráfico. Coloque métodos demais em uma única tela e ele deixa de ser um mapa. Vira ruído. KT Auto Support Resistance Levels resolve isso. Ele escaneia ao mesmo tempo o timeframe mensal, semanal, diário e o seu timeframe atual, depois desenha
ACB Breakout Arrows MT5
KEENBASE SOFTWARE SOLUTIONS
3.5 (2)
Sinais de rompimento com contexto de mercado ACB Breakout Arrows detecta uma fase de estabilização do preço seguida por um rompimento direcional e marca a configuração com uma seta de compra ou venda. A seta identifica um padrão de rompimento. Ela não garante que todo sinal se transforme em um grande movimento. Uma seta de compra destaca uma configuração de rompimento de alta, enquanto uma seta de venda destaca uma configuração de baixa. Como o preço pode testar novamente a área rompida ou retor
ACB Trade Filter MT5
KEENBASE SOFTWARE SOLUTIONS
Antes de abrir uma operação, o ACB Trade Filter ajuda a responder uma pergunta prática: o mercado está apoiando esta entrada ou você está tentando forçar um sinal em condições contraditórias? O indicador analisa o sentimento do mercado e a tendência, e apresenta o resultado por meio de um histograma colorido e da direção da tendência. Use o filtro depois do seu sinal normal de entrada, não no lugar dele. Três estados do mercado de forma rápida Histograma verde com tendência de alta: as condições
KT Auto Support Resistance Levels: S&R multi-timeframe, Smart Zones e painel de níveis para MetaTrader 4/5 Topos de swing. Pivôs. Order blocks. Máximas e mínimas anteriores. Cada trader marca o mercado de um jeito um pouco diferente, e quem paga o preço é o gráfico. Coloque métodos demais em uma única tela e ele deixa de ser um mapa. Vira ruído. KT Auto Support Resistance Levels resolve isso. Ele escaneia ao mesmo tempo o timeframe mensal, semanal, diário e o seu timeframe atual, depois desenha
KT Stoch Divergence MT4
KEENBASE SOFTWARE SOLUTIONS
Se você já viu o preço fazer uma nova máxima enquanto o Estocástico não confirmou o movimento, então já entende por que os traders acompanham divergências. O KT Stoch Divergence marca essas diferenças diretamente no gráfico, ajudando a encontrar possíveis reversões e continuações de tendência sem precisar desenhar cada linha manualmente. O indicador identifica divergências regulares e ocultas entre o preço e o oscilador Estocástico. Ele oferece contexto, não uma ordem automática. A decisão final
ACB Breakout Arrows
KEENBASE SOFTWARE SOLUTIONS
4.15 (34)
Sinais de rompimento com contexto de mercado ACB Breakout Arrows detecta uma fase de estabilização do preço seguida por um rompimento direcional e marca a configuração com uma seta de compra ou venda. A seta identifica um padrão de rompimento. Ela não garante que todo sinal se transforme em um grande movimento. Uma seta de compra destaca uma configuração de rompimento de alta, enquanto uma seta de venda destaca uma configuração de baixa. Como o preço pode testar novamente a área rompida ou retor
ACB Trade Filter MT4
KEENBASE SOFTWARE SOLUTIONS
5 (1)
Antes de abrir uma operação, o ACB Trade Filter ajuda a responder uma pergunta prática: o mercado está apoiando esta entrada ou você está tentando forçar um sinal em condições contraditórias? O indicador analisa o sentimento do mercado e a tendência, e apresenta o resultado por meio de um histograma colorido e da direção da tendência. Use o filtro depois do seu sinal normal de entrada, não no lugar dele. Três estados do mercado de forma rápida Histograma verde com tendência de alta: as condições
KT Momentum Arrows
KEENBASE SOFTWARE SOLUTIONS
O KT Momentum Arrows marca rompimentos de momentum de alta e de baixa com setas quando um candle fecha além de suas bandas de preço adaptativas. As bandas respondem ao desvio do preço e às mudanças de volatilidade. Uma seta azul para cima confirma um fechamento acima da banda superior, enquanto uma seta vermelha para baixo confirma um fechamento abaixo da banda inferior. O sinal fica fixo depois que o candle fecha, portanto a seta não muda para outra barra quando você revisa o gráfico mais tarde
KT COG Advanced MT4
KEENBASE SOFTWARE SOLUTIONS
1 (1)
KT COG is an advanced implementation of the center of gravity indicator presented by John F. Ehlers in the May 2002 edition of Technical Analysis of Stocks & Commodities magazine. It's a leading indicator which can be used to identify the potential reversal points with the minimum lag. The COG oscillator catches the price swings quite effectively. MT5 version of the same indicator is available here KT COG Advanced MT5 Calculation of COG The COG indicator is consist of the two lines. The main l
KT Pin Bar
KEENBASE SOFTWARE SOLUTIONS
KT Pin Bar identifies the pin bar formation which is a type of price action pattern which depicts a sign of reversal or rejection of the trend. When combined with support and resistance, BRN and other significant levels, Pin Bar pattern proved to be a very strong sign of reversal. Basically, a pin bar is characterized by a small body relative to the bar length which is closed either in upper or lower 50% part of its length. They have very large wicks and small candle body. A pin bar candlestic
KT Trend Magic
KEENBASE SOFTWARE SOLUTIONS
Leia a direção da tendência diretamente no gráfico O KT Trend Magic combina momentum e volatilidade em uma linha colorida que acompanha o preço. A linha oferece uma visão contínua do estado atual da tendência e muda de cor quando a direção calculada se altera. Linha verde: mostra um estado de tendência altista. Linha vermelha: mostra um estado de tendência baixista. Mudança de cor: marca uma nova transição direcional no gráfico. Durante um movimento sustentado, a linha também pode servir como re
KT Auto Fibo
KEENBASE SOFTWARE SOLUTIONS
Auto Fibonacci indicator that draws the Fibonacci retracement on the swing you are looking at, and redraws it the moment you zoom or scroll the chart. Zoom in on a pullback and the levels measure that pullback. Zoom out and they measure the whole trend. There are no anchor points to drag and no levels to redraw after every new high. Key features Measures the highest high and the lowest low on your screen, the current candle included. Follows zoom, scroll and window size at once, even when the ma
KT Psar Arrows
KEENBASE SOFTWARE SOLUTIONS
O KT Psar Arrows plota setas no gráfico utilizando o indicador padrão Parabolic SAR. Uma seta de alta é desenhada quando a máxima da vela toca o SAR. Uma seta de baixa é desenhada quando a mínima da vela toca o SAR. Os sinais são gerados em tempo real, sem a necessidade de esperar o fechamento da vela.  Recursos Uma ferramenta útil para traders que desejam experimentar estratégias de negociação que envolvem o indicador Parabolic SAR.  Pode ser usado para identificar pontos de reversão no mercad
KT Ichimoku Trader
KEENBASE SOFTWARE SOLUTIONS
1 (1)
Cinco estratégias Ichimoku operadas automaticamente KT Ichimoku Trader é um Expert Advisor que abre e fecha operações automaticamente com cinco estratégias clássicas de Ichimoku Kinko Hyo. Você ativa as estratégias que deseja e cada uma opera por conta própria: com suas próprias regras de entrada, suas próprias regras de saída e no máximo uma operação aberta por estratégia ao mesmo tempo. Cada entrada é verificada em um candle fechado. Quando um novo candle abre, o EA lê o candle que acabou de f
KT Volatility Oscillator
KEENBASE SOFTWARE SOLUTIONS
O Oscilador de Volatilidade KT analisa os dados de mercado passados e atuais utilizando uma fórmula matemática para exibir o resultado na forma de um oscilador. As ondas crescentes e decrescentes equivalem a alta e baixa volatilidade do ativo.  Em resumo, a volatilidade é simplesmente uma medida das flutuações de preço de um ativo ao longo de um determinado período de tempo. Sem volatilidade, haveria pouco movimento no mercado e os traders não poderiam lucrar com as variações de preço. Uso da V
KT COG Robot
KEENBASE SOFTWARE SOLUTIONS
KT COG Robot is a fully automated Expert Advisor based on the KT COG Indicator . The COG indicator was originally presented by John F. Ehlers in the May 2002 edition of Technical Analysis of Stocks & Commodities magazine. The EA fires a long trade when COG line cross above the signal line and a short trade is fired when the COG line cross below the signal line.  Adaptive Filtration Our adaptive filtration algorithm combines the original COG formula with the major trend direction and market acce
ACB Breakout Arrows EA
KEENBASE SOFTWARE SOLUTIONS
Automatize o fluxo de rompimento ACB O ACB Breakout Arrows EA avalia sinais de rompimento no gráfico ativo e gerencia operações com a lógica integrada do ACB Breakout Arrows e do ACB Trade Filter. Anexe o EA ao ativo e período gráfico que deseja monitorar, habilite a negociação automática e depois escolha as regras de posição, sessão, filtros e saída adequadas ao seu plano de teste. Os indicadores e componentes necessários estão incorporados ao EA, portanto não é preciso fazer download separado.
KT Asian Breakout
KEENBASE SOFTWARE SOLUTIONS
4 (1)
KT Asian Breakout carefully analyzes the range-bound market during the Asian session and then fires a long or short trade after doing some preassessment based on its inbuilt technical analysis module. The executed orders are closed within a day before the completion of the next day session. The inbuilt technical analysis module checks for the session range and compares it with the last 20 days price movement. If it finds any erratic price movement within the session, the orders are not executed
KT London Breakout
KEENBASE SOFTWARE SOLUTIONS
First thirty minutes are essential for a trading session. The early reaction of traders and market players sets a path for the rest of the day. KT London Breakout EA takes advantage of this phenomenon, and after analyzing the first thirty minutes of London session, it places two bidirectional pending orders. One of pending order is eventually canceled after realizing the market direction with certainty. It has been strictly tested and developed for EUR/JPY using 30-Min Time Frame. You can expe
Currency strength and pair correlation in one indicator KT Currency Strength and Correlation ranks the eight major currencies from strongest to weakest and shows, in a colored matrix, how closely ten currency pairs of your choice move together. Before you open a trade from your own strategy, you can check whether the two currencies of the pair are really moving apart, and whether the new trade adds risk to a trade you already hold. What you see on the chart Strength lines: a separate window belo
MACD Divergence Seeker
KEENBASE SOFTWARE SOLUTIONS
KT MACD Divergence Seeker trades the regular and hidden divergence signals generated by our free indicator named KT MACD Divergence indicator. Trading the standalone divergences can be a risky affair that's why the KT MACD Divergence Seeker combines the standard divergence signals with an advanced analysis module to exploit the price inefficiencies on some FX pairs. What is the Divergence exactly? As a general conception if the price is making higher highs, then macd should also be making hig
KT Asian Breakout Indicator
KEENBASE SOFTWARE SOLUTIONS
Marque o intervalo da sessão asiática O KT Asian Breakout Indicator marca a máxima e a mínima de uma janela de quatro horas da sessão asiática e acompanha o preço depois que o intervalo é concluído. O parâmetro GMT Offset alinha a sessão ao horário do servidor da sua corretora, enquanto Draw Session Box controla a exibição do intervalo. Veja o rompimento e os níveis da operação juntos Uma seta altista aparece quando o preço fecha acima da máxima da sessão. Uma seta baixista aparece quando o preç
MACD Divergence MT4
KEENBASE SOFTWARE SOLUTIONS
O KT MACD Divergence mostra as divergências regulares e ocultas formadas entre o preço e o oscilador. Se sua estratégia de trading antecipa uma reversão de tendência, você pode usar a divergência regular do MACD para identificar possíveis pontos de virada. Já se sua estratégia é baseada na continuação da tendência, a divergência oculta do MACD será uma boa escolha. Limitações do KT MACD Divergence Usar a divergência do MACD como único sinal de entrada pode ser arriscado. Nem toda divergência d
KT Bollinger Bands Trader MT4
KEENBASE SOFTWARE SOLUTIONS
O KT Bollinger Bands Trader é um consultor especializado 100% automatizado que utiliza uma estratégia de reversão à média com base nas Bandas de Bollinger durante períodos de baixa volatilidade. O preço frequentemente reage nas linhas superior ou inferior das bandas, mas a reversão nem sempre ocorre. No entanto, as chances de reversão aumentam em momentos de baixa volatilidade. Entradas Uma compra é ativada quando o preço se alinha corretamente abaixo da linha inferior das Bandas de Bollinger.
KT CCI Divergence MT4
KEENBASE SOFTWARE SOLUTIONS
KT CCI Divergence shows the regular and hidden divergence created between the price and CCI oscillator. Divergence is one of the vital signals that depicts the upcoming price reversal in the market. Manually spotting the divergence between price and CCI can be a hectic and ambiguous task. Limitations of KT CCI Divergence   Using the CCI divergence as a standalone entry signal can be risky. Every divergence can't be interpreted as a strong reversal signal. For better results, try to combine it w
KT Heiken Ashi Smoothed MT4
KEENBASE SOFTWARE SOLUTIONS
Acompanhe o estado suavizado do Heiken Ashi O KT Heiken Ashi Smoothed transforma o movimento do preço em velas azuis e vermelhas suavizadas. Ele adiciona uma seta azul para cima quando o estado muda de baixista para altista e uma seta vermelha para baixo quando muda de altista para baixista, facilitando a visualização das transições de direção no gráfico. O período e o método de suavização controlam a intensidade da suavização das velas. Isso oferece uma visão mais estável que o Heiken Ashi padr
KT MA Crossover MT4
KEENBASE SOFTWARE SOLUTIONS
O KT MA Crossover desenha setas de compra e venda com base no cruzamento das médias móveis selecionadas. Além disso, ele também gera os alertas apropriados e exibe o valor de MFE (Excursão Mais Favorável) para cada sinal consecutivo. O cruzamento de médias móveis é uma das estratégias mais utilizadas por traders em todo o mundo. Normalmente envolve uma média móvel rápida e uma lenta para identificar sinais de compra e venda com base na direção do cruzamento. Sinal de compra – quando a média móv
KT Round Numbers MT4
KEENBASE SOFTWARE SOLUTIONS
KT Round Numbers plots the round number levels which are also commonly known as psychological levels in the Forex world. In the context of Forex trading, round number levels are those levels in which there are two or more zeroes at the end. They are named as 00 levels on the chart. Some traders also consider the halfway points as a valid round number level. They are named as 50 levels on the chart. Use of round number levels in trading Round number levels work as strong support and resistance
KT Inside Bar Advanced MT4
KEENBASE SOFTWARE SOLUTIONS
Despite the popularity of inside bar pattern among the traders, using it as a standalone signal doesn't provide any edge in the market. KT Inside Bar Advanced indicator solves this problem by combining the classic inside bar pattern with the "ECE" cycle and Fibonacci extensions. Using this indicator in place of our classic inside bar indicator will provide a tremendous advantage and edge in the market. What is the ECE cycle? In financial markets, the price never moves in a straight line but u
KT Inside Bar Hunter MT4
KEENBASE SOFTWARE SOLUTIONS
Despite the popularity of inside bar pattern among traders, using it as a standalone entry signal doesn't provide any evidentiary advantage. KT Inside Bar Hunter trades only selected inside bar patterns using some preassessment and ECE price action cycle. Trading Strategy On successful detection of the required pattern, EA places a pending order in the direction of the forecasted price expansion phase. Pending orders are canceled if they are not triggered within the next bar. Once triggered, ac
Filtro:
Sem comentários
Responder ao comentário