PZ Support Resistance
- Indicadores
- Versão: 7.0
- Atualizado: 19 julho 2024
- Ativações: 20

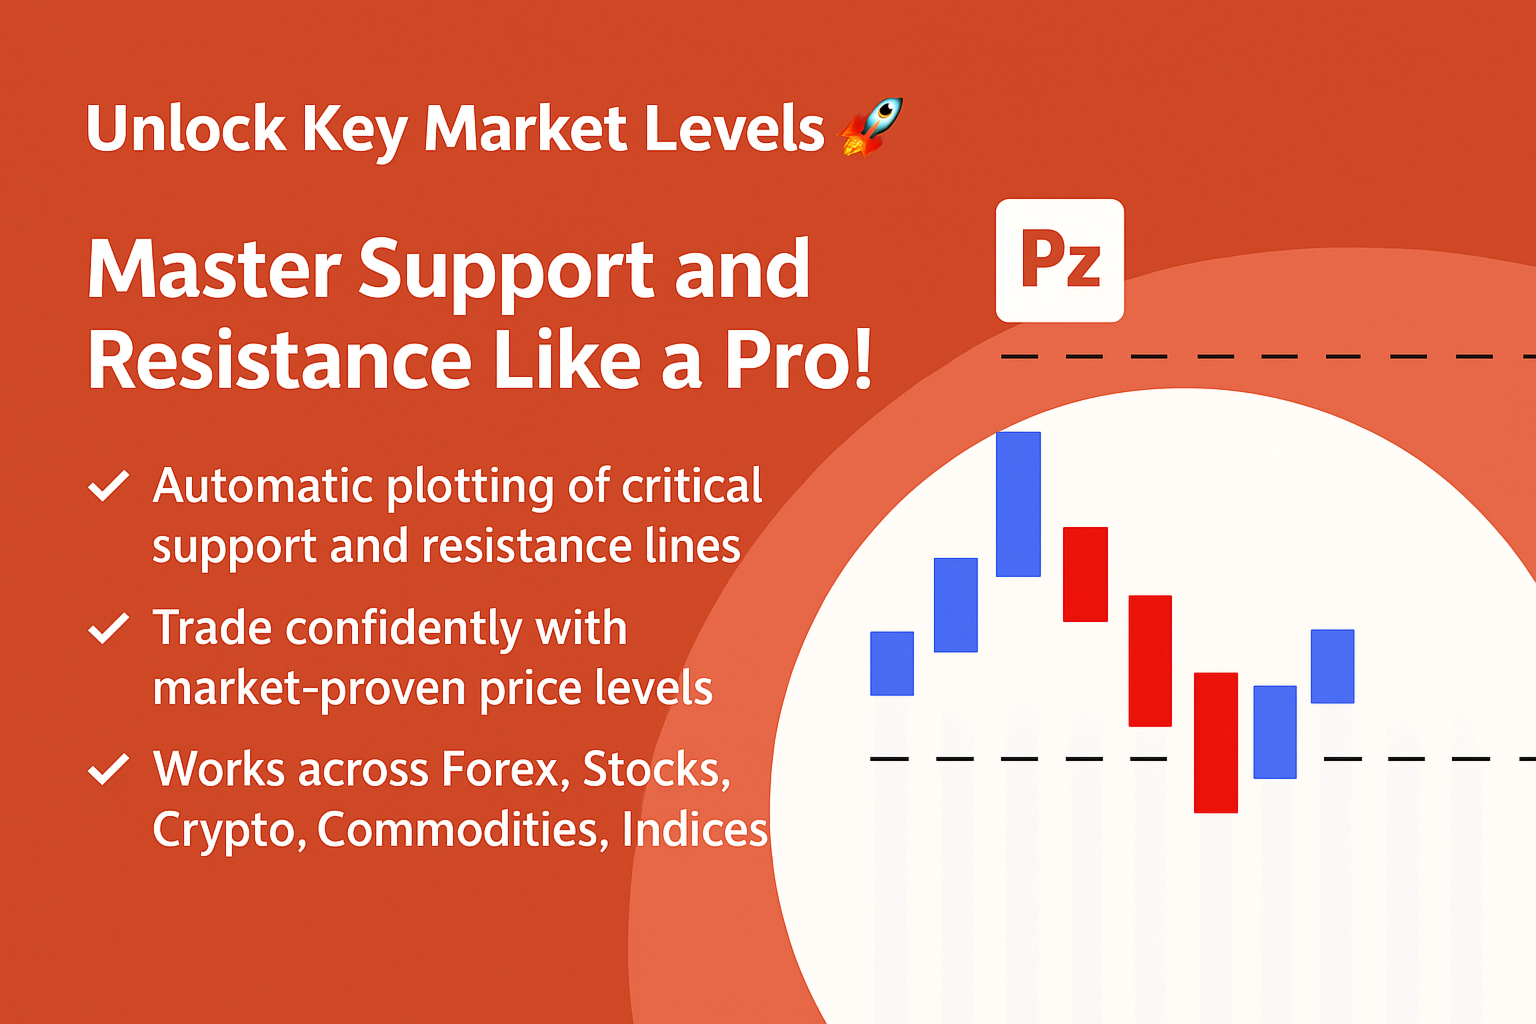
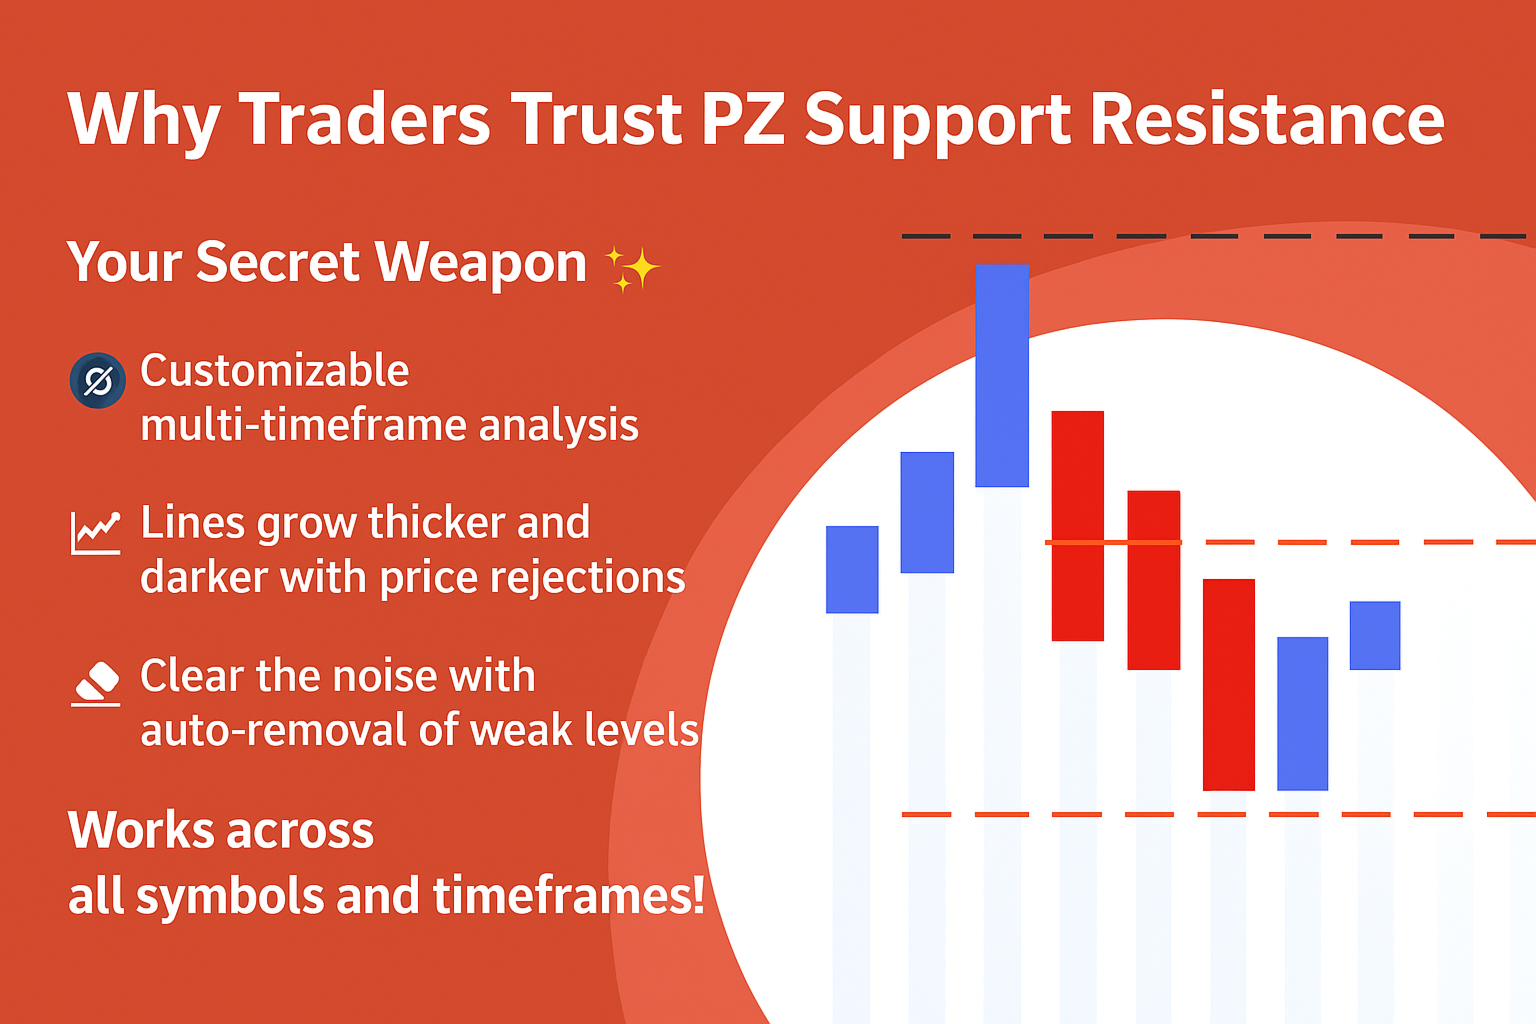
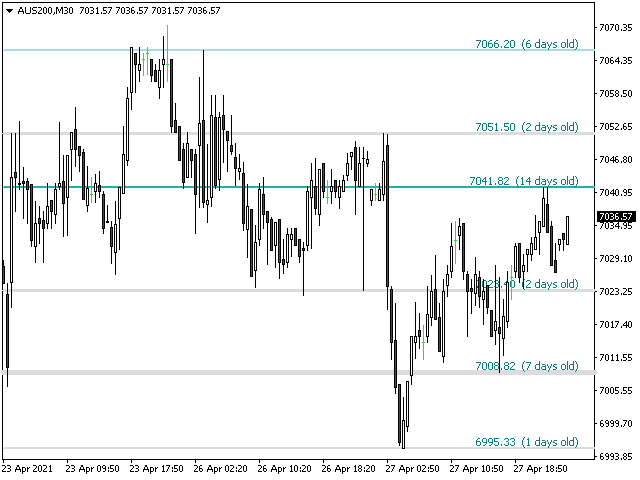
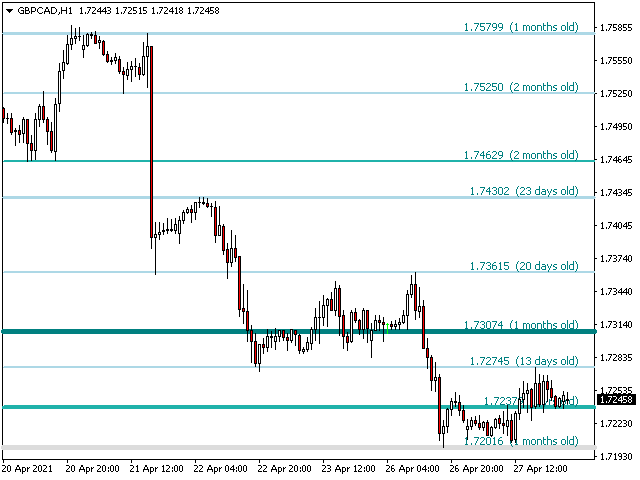
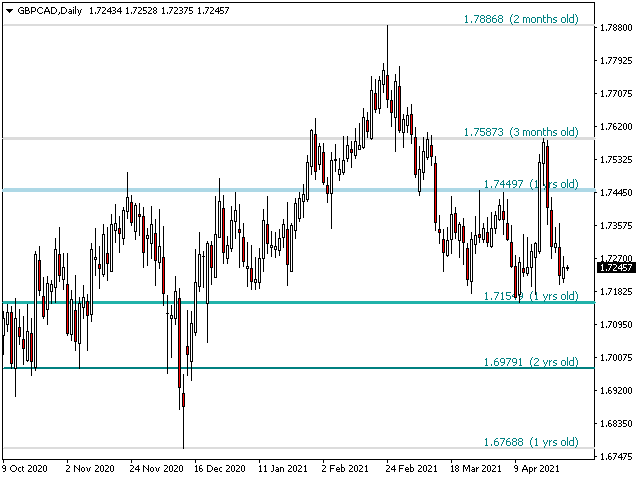
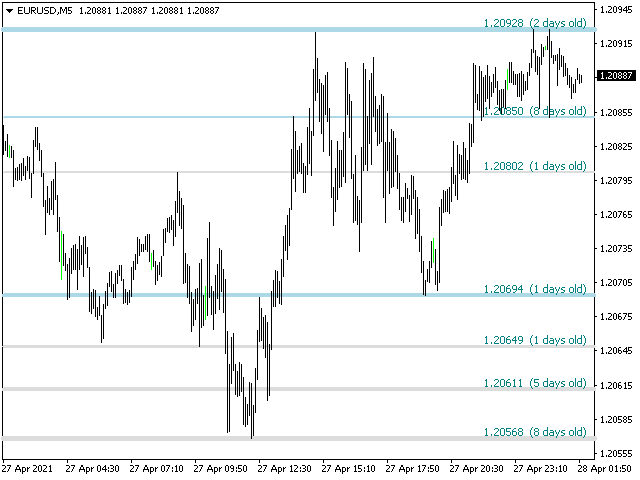
Cansado de traçar linhas de suporte e resistência? A Resistência de suporte é um indicador de período múltiplo que detecta e plota automaticamente linhas de suporte e resistência no gráfico com um toque muito interessante: conforme os níveis de preços são testados ao longo do tempo e sua importância aumenta, as linhas se tornam mais espessas e mais escuras.
[ Guia de instalação | Guia de atualização | Solução de problemas | FAQ | Todos os produtos ]
- Melhore sua análise técnica da noite para o dia
- Detecte níveis de preços importantes sem navegar pelos gráficos
- Reconhecer rapidamente a força relativa de todos os níveis de preços
- Economize até meia hora de linhas de plotagem para todas as operações
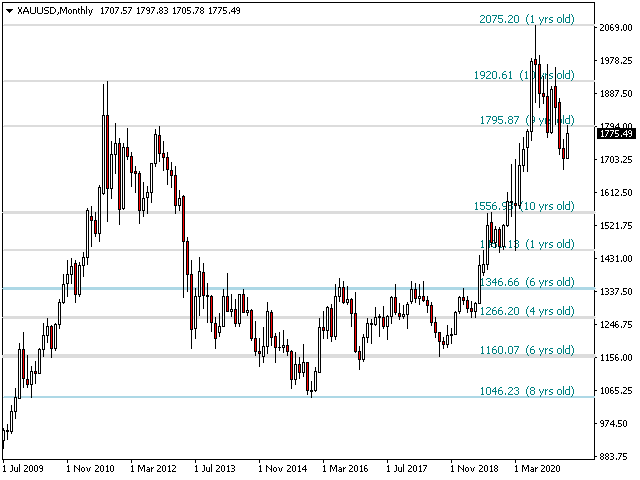
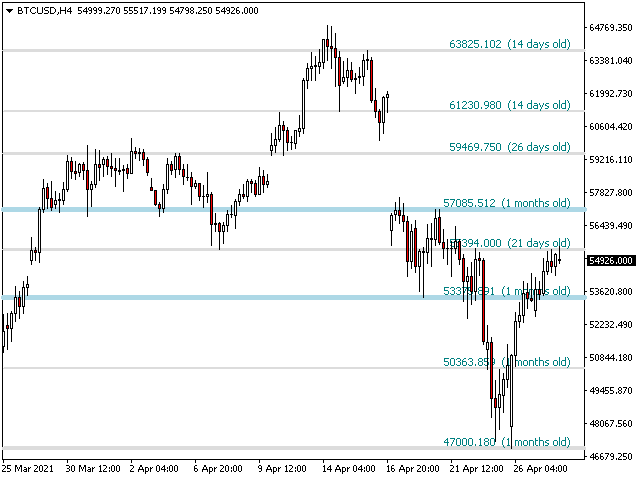
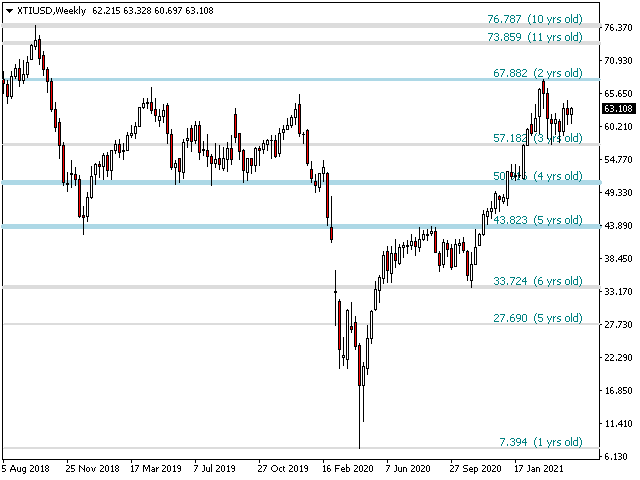
- O indicador exibe a idade de todos os níveis de preço
- O indicador não está repintando
Os níveis de preços passado e presente são colapsados pela proximidade e ajustados à ação atual do mercado. Linhas são desenhadas onde a ação está e não necessariamente nos picos.
- Os níveis de preços ficam mais escuros e amplos à medida que são rejeitados ao longo do tempo
- Níveis de preços sem importância são limpos regularmente para evitar ruídos
- Seleção de período personalizável e fator de recolhimento
- Implementa alertas de email / som / push para fugas
Parâmetros de entrada
- Configurações do indicador: O indicador lerá o preço do período atual, mas você pode opcionalmente selecionar outro. Por exemplo, você pode exibir linhas de suporte e resistência D1 nos gráficos H4. Você também pode escolher a quantidade de níveis de preço a exibir no gráfico, usando o parâmetro de densidade do nível de preço .
- Configurações de cores: digite as cores desejadas para linhas de suporte e resistência com base na importância.
- Configurações de etiqueta: opcionalmente, as etiquetas que exibem a idade de cada linha de suporte e resistência podem ser exibidas no indicador. Isso está desativado por padrão. Você pode escolher a fonte e o tamanho da etiqueta.
- Alertas: ative alertas de exibição / e-mail / push / som para fugas.
Autor
Arturo López Pérez, investidor e especulador privado, engenheiro de software e fundador da Point Zero Trading Solutions.

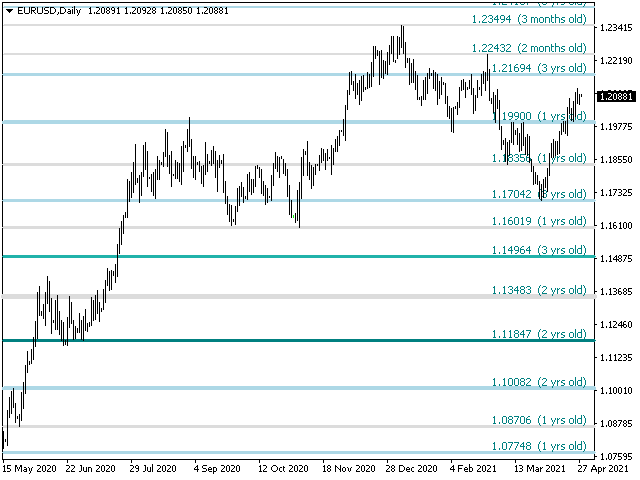
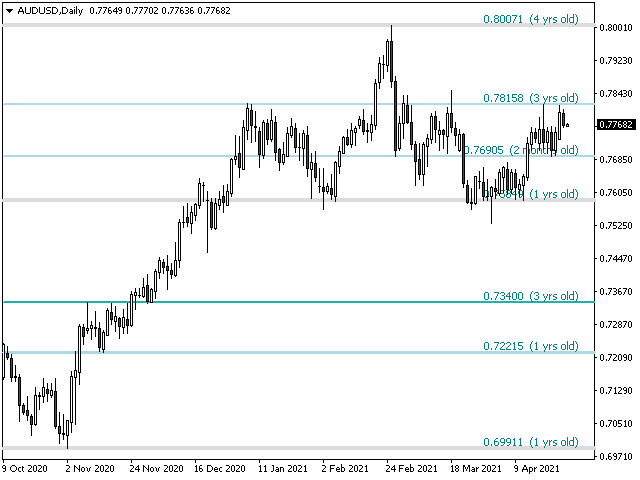
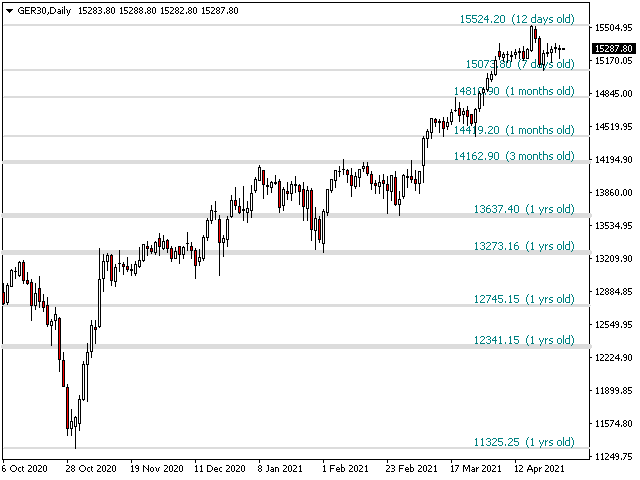

At D1 it works quite well.