Conheça o Mercado MQL5 no YouTube, assista aos vídeos tutoriais
Como comprar um robô de negociação ou indicador?
Execute seu EA na
hospedagem virtual
hospedagem virtual
Teste indicadores/robôs de negociação antes de comprá-los
Quer ganhar dinheiro no Mercado?
Como apresentar um produto para o consumidor final?
Indicadores Técnicos para MetaTrader 5 - 37

MT4 version Overview The Lowess Channel indicator is a smoothed trend-following tool designed to help traders identify the direction of the trend , detect flat or ranging markets , and spot breakouts from consolidation zones. It creates a central smoothed line with upper and lower channel boundaries, adapting to market noise while maintaining clarity. How It Works The indicator builds a channel around a smoothed price line. The central line reflects the current trend. The upper and lower bounda
FREE

Indicator and Expert Adviser EA Available in the comments section of this product. Download with Indicator must have indicator installed for EA to work.
Mt5 indicator alerts for bollinger band and envelope extremes occurring at the same time. Buy signal alerts occur when A bullish candle has formed below both the lower bollinger band and the lower envelope Bar must open and close below both these indicators. Sell signal occur when A bear bar is formed above the upper bollinger band and upper
FREE

I present the well-known Moving Average indicator.
This indicator is presented as a channel, where the upper and lower lines are equidistant from the main line by a percentage set by the user.
The indicator is easy to use. The basic settings of the moving average have been saved and a percentage parameter (Channel%) has been added.
Basic parameters:
Channel% - shows how much we want to deviate from the main line.
The indicator is freely available.
FREE

MultiFrame Volume Trend (MFVI) is a powerful VWAP-based indicator that displays volume trends across multiple timeframes in a clean, easy-to-read dashboard directly on your chart. Instantly capture the overall market direction in just seconds. Features Multi-timeframe VWAP analysis from M1 to MN1. Dashboard panel shows the trend state of each timeframe at a glance. Plots VWAP line and buy/sell arrows directly on the chart. Fully customizable: colors, line width, panel position, arrow symbols. Bu
FREE

Indicador: Currency Strength Meter Pro Visualização da Amplitude do Mercado Vantagens: Em vez de gráficos confusos, exibe dados num "Painel" limpo. Identifique instantaneamente os pares mais fortes ou fracos. Benefícios: Poupa tempo e acelera a decisão de quais pares negociar. Classificação e Ordenação Automática Vantagens: Modo de "Classificação Horizontal" que ordena pares do "Mais Forte" para o "Mais Fraco". Benefícios: Veja os Vencedores e Perdedores do dia/semana/mês imediatamente. Lógica I

if you want to test it : private message me ( MT5 demo testing doesn't work ) Designed to help traders gain a deeper understanding of the market’s true order flow dynamics . By visualizing the “ footprints ” left by candles, this indicator reveals how the delta ( the difference between buying and selling pressure ) changes during the candle formation, as well as how volume fluctuates at different price levels. These insights are essential for traders seeking to identify reversals, breakouts, and

Moving Average Crossover with Alert is a indicator that can show buy and sell arrow types of alerts supported by the platform based on the crossover of two moving averages according to the parameters given by the trader. You can change inputs by yourself. This indicator only show the arrows to buy or sell to execute the trade you have to do it by yourself. For more information see the screenshot.

Procurando um indicador poderoso para levar sua negociação para o próximo nível? Não procure além do nosso indicador exclusivo baseado em RSI, que combina o melhor do Índice de Força Relativa (RSI), Média Móvel e indicadores Heiken-Ashi em MQL5.
Nosso indicador oferece dados em tempo real sem nenhum atraso, permitindo que você tome decisões de negociação informadas com confiança. É perfeito para traders de todos os níveis, de iniciantes a especialistas.
Com configurações e parâmetros personal

Versão MT4 https://www.mql5.com/en/market/product/139061 Versão MT5 https://www.mql5.com/en/market/product/139062
Half Trend Heikin Ashi Panel – Scanner de Tendências Inteligente de Vários Pares e Vários Períodos O Half Trend Heikin Ashi Dashboard é uma ferramenta analítica revolucionária que combina o poder de dois dos indicadores favoritos dos traders – Half Trend e Heikin Ashi – num painel compacto e informativo. Concebido especificamente para traders que desejam monitorizar dezenas de pare

O Ichimoku Alerts é um indicador que identifica oportunidades de mercado usando o indicador Ichimoku. Ele detecta quatro tipos de sinais. Quando um padrão de reversão aparece na linha Tenkansen ou Kijunsen, e ambas as linhas estão em tendência de alta ou de baixa, o indicador envia um alerta e gera uma ferramenta de gerenciamento de risco que calcula automaticamente o tamanho da operação e os níveis potenciais de stop-loss e take-profit. Se o sinal se formar na linha Tenkansen, o stop-loss será

O KT Knoxville Divergence é uma ferramenta poderosa que revela divergências únicas no preço de um instrumento financeiro, utilizando uma combinação cuidadosamente elaborada do Índice de Força Relativa (RSI) e de um oscilador de momentum. Este indicador captura com eficiência variações sutis na dinâmica do mercado e auxilia os traders a identificar oportunidades de negociação potencialmente lucrativas com maior precisão. A Knoxville Divergence é um tipo de divergência no trading desenvolvida por
Supertrend Multicurrency Scanner Dashboard MT5 é uma ferramenta poderosa projetada para monitorar múltiplos pares de moedas e períodos de tempo utilizando o indicador Supertrend. Organiza os sinais em um formato de grade, exibindo o status da tendência de cada símbolo em períodos de tempo de M1 a MN1. Os traders podem habilitar ou desabilitar períodos de tempo específicos para alinhá-los com suas estratégias. A versión para MT4 está disponível aqui: SuperTrend Multicurrency Scanner MT4 Para docu
O ATT Support and Resistance é um indicador leve para o MetaTrader que encontra máximas e mínimas locais em tempo real utilizando o princípio fractal e traça automaticamente níveis significativos de suporte e resistência com base nos mesmos. Mais produtos: Aqui Remove o "ruído" das linhas muito próximas e atualiza as zonas a cada novo tique, sem carga desnecessária no terminal. Indicador clássico com a máxima facilidade de configuração e ajuste do número de zonas para exibição. E também regulan
FREE

Melhore sua estratégia de trading com o Big Candle Scanner Dashboard MT5, um painel multi-ativo versátil projetado para detectar velas alcistas e baixistas de grande tamanho em numerosos pares de moedas e timeframes, sinalizando possíveis mudanças de momentum ou picos de volatilidade. Enraizado em técnicas clássicas de análise de velas popularizadas por traders como Steve Nison nos anos 90 através de seu trabalho em gráficos de velas japonesas, essa ferramenta se tornou um item essencial para en
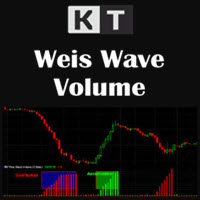
O indicador KT Weis Wave Volume é uma ferramenta técnica baseada na tendência atual do mercado e na direção do movimento dos preços. O indicador utiliza o volume e exibe os volumes acumulados para os aumentos e quedas de preço no gráfico.
Além disso, a janela do indicador mostra um histograma de ondas verdes e ondas vermelhas em ascensão.
A cor verde representa o movimento de alta; quanto mais o preço sobe, maior é o volume verde. A cor vermelha representa uma onda de baixa; o volume vermelho

KT Stochastic Alerts é uma adaptação personalizada do oscilador Estocástico que gera sinais e alertas com base em seis eventos: Cruzamento altista: quando a linha principal cruza acima da linha de sinal. Cruzamento baixista: quando a linha principal cruza abaixo da linha de sinal. Quando o Estocástico entra na zona de sobrecompra. Quando o Estocástico sai da zona de sobrecompra. Quando o Estocástico entra na zona de sobrevenda. Quando o Estocástico sai da zona de sobrevenda.
Funcionalidades
Pe

Bem-vindo ao Twin Peak Indicator MT5 --(Double Top/ Double Bottom)-- O Double Top and Bottom Indicator é uma ferramenta de análise técnica projetada para identificar possíveis padrões de reversão no mercado.
Ele identifica áreas onde o preço fez dois picos ou depressões consecutivos de altura quase igual, seguido por um movimento de preço na direção oposta.
Esse padrão indica que o mercado está perdendo força e pode estar pronto para uma reversão de tendência. *Entre em contato comigo após a
O Fine Timeframes é um indicador de timeframes subminuto para MT5. Ele cria gráficos com intervalos de 1 a 30 segundos, permitindo o acesso a movimentos de mercado que permanecem invisíveis em gráficos de minutos e horas, mantendo a funcionalidade completa de negociação: você pode abrir e fechar posições como em timeframes padrão. O Fine Timeframes funciona apenas com ticks em tempo real e não foi projetado para o Testador de Estratégias — baixe a versão de demonstração e teste o indicador em co
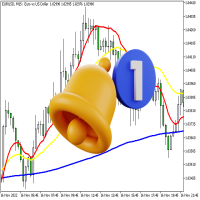
O indicador exibe três linhas e monitora dois tipos de interseções. Três linhas do indicador: " MA " - indicador lento "Média móvel", " DEMA lento " - indicador lento " Média móvel exponencial dupla" e " DEMA rápido " - indicador rápido "Média móvel exponencial dupla". Dois tipos de cruzamentos : " Alert Price MA " - o preço cruza a linha "MA" e " Alert DEMA DEMA " - as linhas cruzam "DEMA Lento" e "DEMA Rápido ". Ao cruzar, as seguintes opções estão dis

Introducing RSIScalperPro - the revolutionary RSI-based indicator for Metatrader 5, specifically designed for scalping in the one-minute chart. With RSIScalperPro, you'll have a powerful toolkit for precise entry and exit signals to take your trading to the next level. RSIScalperPro utilizes two different RSI indicators that provide clear signals for overbought and oversold areas. You can customize the time periods and limit values of the two RSIs according to your preferences to achieve the be

Eleve sua precisão no trading com o Fibonacci Killer Alert MT5, um indicador poderoso que utiliza níveis de retração de Fibonacci para fornecer sinais de entrada precisos nos mercados de forex, ações, criptomoedas e commodities. Aclamado em comunidades de trading como Forex Factory e Reddit’s r/Forex, e elogiado em discussões no Investopedia e TradingView por sua precisão em identificar reversões e continuações de tendência, este indicador é um favorito entre traders que buscam configurações de
Stochastic Multicurrency Scanner Dashboard MT5 é uma ferramenta poderosa projetada para monitorar múltiplos pares de moedas e períodos de tempo utilizando o oscilador Estocástico. Organiza os sinais em um formato de grade, exibindo o status de cada símbolo em períodos de tempo de M1 a MN1. Os traders podem habilitar ou desabilitar períodos de tempo específicos para se adequar às suas estratégias. A versión para MT4 está disponível aqui: Stochastic Oscillator Multicurrency Scanner MT4 Para docume
Eleve a precisão do seu trading com o Indicador SSL Channel MT5 , uma ferramenta dinâmica projetada para visualizar a dinâmica das tendências de preço por meio da abordagem inovadora do Semaphore Signal Level (SSL). Baseado em conceitos de análise técnica popularizados em comunidades como MQL5 e Forex Factory, este indicador utiliza duas médias móveis simples (SMA) de 10 períodos—uma para os máximos e outra para os mínimos—para formar um canal de preço adaptável. Reconhecido por sua simplicida
O indicador KT Adaptive RSI integra um módulo adaptativo ao RSI clássico, identificando níveis dinâmicos de sobrecompra e sobrevenda com base nas condições atuais do mercado. O RSI tradicional assume que um instrumento está sobrecomprado acima de 70 e sobrevendido abaixo de 30, mas isso nem sempre é preciso para todos os ativos. Nosso módulo adaptativo analisa rapidamente dados históricos para identificar, de forma adaptativa, os níveis ideais de sobrecompra e sobrevenda. Isso ajuda os traders a
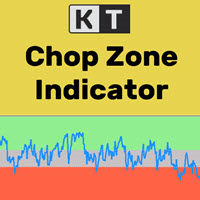
É um fato bem conhecido que os mercados financeiros tendem apenas cerca de 30% do tempo, enquanto nos outros 70% movimentam-se dentro de uma faixa lateral. No entanto, a maioria dos traders iniciantes tem dificuldade em identificar se o mercado está em tendência ou preso em um movimento lateral. O KT Chop Zone resolve esse problema ao destacar claramente a fase do mercado em três zonas: Zona de Baixa, Zona de Alta e Zona de Consolidação (Chop Zone).
Recursos
Melhore instantaneamente sua negocia
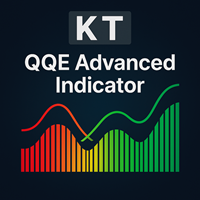
O KT QQE Advanced é uma versão modificada do oscilador QQE clássico que o apresenta de forma mais fiel por meio de um histograma colorido com Trailing Line (TL) rápido e lento.
Diferente do QQE tradicional, o KT QQE Advanced traz um histograma com níveis de sobrecompra/sobrevenda.
Aplicações
Encontre sinais rápidos de compra/venda em todos os timeframes usando o scanner MTF. Determine a direção da tendência com maior precisão. Detecta mercado sobrecomprado/sobrevendido. Mostra o momentum do p

Devido às manipulações Técnicas e Lógicas da Corretora, percorri um longo caminho para trazer este indicador traseiro que combina inúmeras estratégias que possuem as seguintes capacidades:
Identificação de tendências de mercado: compreenda a tendência geral do mercado.
Pontos de reversão: identifique potenciais pontos onde o mercado pode mudar de direção.
Pontos de entrada e saída: determine os momentos ideais para entrar e sair das negociações.
Para uma compreensão abrangente de como util

Astral Pulse Oscillator — The Celestial Flow & Energy Resonance Tool Step into the mystic rhythm of market energy with the Astral Pulse Oscillator , a non-repainting fusion of celestial flow mapping and harmonic pulse resonance . This indicator translates hidden energetic fluctuations into radiant visual waves, allowing traders to interpret the unseen emotional tide that moves price — from euphoric expansions to ethereal contractions. Within its luminous subwindow, two astral forces dance: Ce

Indicador gratuito para detectar rapidamente quebras de linha de tendência e alta ou baixa de uma faixa de preço. Ele exibe linhas com base nas altas e baixas dos preços e também encontra e exibe linhas de tendência inclinadas. Assim que o preço ultrapassa a linha e o candle fecha, o indicador sinaliza isso com uma seta (você também pode ativar um alerta). Este indicador é fácil de usar e também gratuito. O número de velas para definir as linhas de tendência, bem como o máximo e o mínimo da fai
FREE

This indicator shows ratios between extremes on the chart. You can specify your own ratios (e.g. Fibonacci).
Parameters Most important Density - how much in details to search ratios in extremes. Bigger number means less details, smaller number means more details. Base unit is 1 bar on the chart. History - how far to go in history while searching. When you set -1, the indicator processes all bars from history. Base unit is 1 bar on the chart. Range - how far search ratios from given extreme. Bas
FREE

Trend Reversal Candles is an indicator designed to highlight common candlestick reversal and continuation patterns directly on the chart.
It marks detected setups with arrows and labels for easier visual recognition, reducing the need for manual pattern searching. Detected Patterns Bullish and Bearish Engulfing Hammer and Hanging Man Shooting Star Doji variations Other widely used reversal setups Features Displays arrows and pattern names on the chart Works on any symbol (Forex, Gold, Indices, C
O Indicador de Zona FVG MT5 é uma ferramenta poderosa projetada para identificar Lacunas de Valor Justo (FVG) no mercado, destacando desequilíbrios de preço entre valor justo e preço de mercado. Essa identificação precisa de lacunas permite que os traders identifiquem potenciais pontos de entrada e saída do mercado, aumentando significativamente sua capacidade de tomar decisões comerciais informadas. Com sua interface intuitiva e amigável, o Indicador de Zona FVG escaneia automaticam

The index makes it easy for traders to know the opening and closing times of global markets :
- Sidney - Tokyo - London - New York
Where it misleads each time zone and enables us to know the times of overlapping the markets when the liquidity is high.
To get more indicators and signals, follow us on the Telegram channel link
https://t.me/tuq98
Or our YouTube channel, which has explanations in Arabic and a technical analysis course
https://www.youtube.com/@SSFX1
FREE
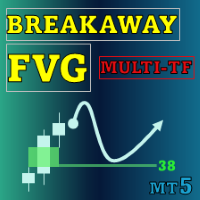
Special offer : ALL TOOLS , just $35 each! New tools will be $30 for the first week or the first 3 purchases ! Trading Tools Channel on MQL5 : Join my MQL5 channel to update the latest news from me A ferramenta Breakaway Fair Value Gaps (FVG) é uma solução inovadora projetada para ajudar traders a identificar áreas onde o preço se afastou do equilíbrio, fornecendo insights detalhados sobre as probabilidades de mitigação. Esta ferramenta não apenas destaca sinais críticos, mas també

Você já se sentiu perdido no meio de uma operação, sem saber exatamente qual é sua exposição ao risco? Já tomou decisões emocionais que custaram caro porque não tinha uma visão clara do seu plano de trading? A disciplina no gerenciamento de risco é o que separa os traders consistentes dos que ficam pelo caminho. No entanto, calcular e monitorar o risco em tempo real pode ser complexo e estressante. Apresentamos o Risk Matrix, o indicador de painel visual definitivo para o MetaTrader 5, projetado
FREE

O KT Psar Arrows plota setas no gráfico utilizando o indicador padrão Parabolic SAR. Uma seta de alta é desenhada quando a máxima da vela toca o SAR. Uma seta de baixa é desenhada quando a mínima da vela toca o SAR. Os sinais são gerados em tempo real, sem a necessidade de esperar o fechamento da vela.
Recursos
Uma ferramenta útil para traders que desejam experimentar estratégias de negociação que envolvem o indicador Parabolic SAR. Pode ser usado para identificar pontos de reversão no mercad
100PIPSignals — Sistema de cruzamento de EMA rápida para ouro (M1) Um indicador leve de cruzamento de EMA projetado para CFDs de ouro no gráfico de 1 minuto. Ele marca pontos de entrada de baixo risco com setas claras e círculos dourados, valida movimentos por uma meta de pip mínima configurável e pode enviar alertas/notificações.
Como funciona (simples) O indicador utiliza duas médias móveis exponenciais (EMA rápida e EMA média).
Quando a EMA rápida cruza acima da EMA média, uma seta de sina

The indicator shows Jake Bernstein's MAC (Moving Average Channel) System signals ---------------------------------------- System assumes several types of entering in trade, in this indicator only one type implemented - on closing of second trigger bar. It is recommended to start using this indicator together with Jake Bernstein's free lessons https://www.youtube.com/@JakeatMBH/videos Arrow shows signal bar - enter on closing or on opening of the next bar, cross - stop level, dot - minimum profi
FREE

SDivergence Indicator calculates and shows regular divergences and hidden divergences for MACD and Stochastic(for now). The benefit of this indicator is multiple input variables. Using these inputs you can modify to get more adaptive RD and HD's to your strategy. Guide : 1- First put your desired oscillator (MACD or Stochastic or Both) on the chart. 2- Run SDivergence indicator and set corresponding sub-window index of previously put oscillator in SDivergence input window. -Note: the chart sub-w
FREE

BITCOIN DAILY TOP BOTTOM ENGINE (V1)
This is not a simple indicator. This is a professional-grade market observation and decision engine designed for serious Bitcoin traders who demand clarity, structure, and precision.
The Bitcoin Daily Top Bottom Engine is built to identify high-probability daily extremes using adaptive range logic, sweep behavior analysis, and market condition filtering. Instead of reacting late, this engine prepares you in advance by defining where the market is most like
FREE

Kindly rate and comment about the product for upgradation & Support
The 5 EMA is plotted in green color ( Lime ).
The 14 EMA is plotted in red color ( Red ).
The 20 EMA is plotted in blue color ( Blue ).
The 200 EMA is plotted in yellow color ( Yellow ).
The Quarter EMA that provided calculates and plots four Exponential Moving Averages (EMAs) on the chart using different periods: 5, 14, 20, and 200. Each EMA is represented by a different color on the chart. Here's a description of each EMA:
FREE

15:30 Breakout Indicator
The 15:30 Breakout Indicator is designed to accurately identify breakout points generated by the 15:30 candle (New York session open) — one of the most volatile and high-volume moments in the market. It automatically analyzes the 15:30 candle on both M15 and M5 timeframes , drawing the high and low levels as dynamic breakout zones. Once price breaks these levels, the indicator highlights potential trade opportunities driven by the volatility expansion typical of this
FREE

Get the best out of your forex trading experience with our Superb Trend indicator! Our revolutionary technology helps you make smarter and more successful trades, no matter your skill level. With a simple and intuitive interface, you'll be able to analyze trends and make wiser decisions in no time. Stop gambling with your money; start leveraging our Superb Trend Indicator to outperform the market!
Trend Signals: Bullish trend will show as Green line. Bearish trend will show as Red line.
Supe
FREE
Descrição
Candlestick Pattern Analyzer é uma ferramenta avançada para traders discricionários e sistemáticos, projetada para identificar automaticamente os principais padrões de velas japonesas e fornecer uma análise estatística detalhada de seu desempenho histórico. O indicador é ideal para quem deseja verificar a eficácia real dos padrões e utilizá-los em combinação com filtros de confirmação (tendência, níveis-chave, volume etc.) e uma estratégia de gestão de risco bem definida. Funcionalida
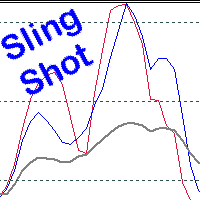
Scalping, Mean reversion or Position trading strategy
Get into an established trend on a pullback in the market. Use the Pinch in the indicator for profit taking. Use the Pinch as a mean reversion strategy, scalping back to a moving average line.
Input Parameters Fast Sling Shot configuration. Slow Sling Shot configuration. Dual Sling Shot configuration. Price line configuration. Trigger zones or levels. Example of Sling Shot trade idea: Price line sets the mood, below the baseline level (50)

O algoritmo é baseado na ideia do indicador Currency Power Meter. Nesta versão, o número de valores exibidos é ilimitado, seu código é mais compacto e rápido, os valores da barra atual podem ser obtidos através de buffers de indicadores. O que o indicador mostra : uma faixa fina e o número superior na frente da moeda mostram o índice de força relativa para as últimas N horas (N é definido nos parâmetros da variável 'Horas'), uma faixa mais larga mostra o índice diário. Quanto mais pares de moe
FREE

TrendBite v1.5 - Indicador profissional de acompanhamento de tendências Desenvolvedor: 8aLt4 Versão: 1.5 Plataforma: MetaTrader 5
Visão geral O TrendBite v1.5 é um indicador de análise técnica avançado, concebido para identificar mudanças de tendência no mercado e fornecer sinais de compra e venda claros aos investidores. Baseado no algoritmo das Bandas de Bollinger, esta ferramenta capta com precisão as inversões de tendência, sendo ideal tanto para principiantes como para traders experiente
FREE

ADR Adaptativo O ADR Adaptativo é um indicador profissional para calcular e exibir o intervalo diário médio (ADR). Cálculo e métodos Quatro tipos de suavização: SMA , EMA , SMMA (Wilder) , LWMA Adaptável a diferentes estilos de negociação e modelos de volatilidade Lógica diária dinâmica Inicia automaticamente com a sessão de negociação Define dois níveis simétricos ao redor do preço de abertura Os níveis se estreitam até o ADR ser atingido Após isso, permanecem fixos até o fim do dia Orientação
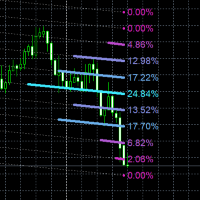
O indicador Linear Regression Volume Profile combina análise de regressão linear com perfilagem de distribuição de volume para criar uma ferramenta sofisticada de visualização de estrutura de mercado. A fundação começa com o cálculo de regressão linear através de um número especificado de barras históricas, computando tanto a inclinação quanto os valores de intersecção do eixo Y que definem a trajetória da linha de tendência através da ação de preço. Esta linha de regressão serve como eixo centr

This indicator combines RSI(14) and ADX(14) to find out the signal that price moves strongly. When it appears signal (represent by the yellow dot), and price is going down, let consider to open a SELL order. Otherwise, let consider to open a BUY order. In this case, the strength of moving is strong (normally after sideway period), so we can set TP by 3 times of SL .
FREE

การพิจารณาคุณลักษณะ HUD ขณะนี้ผมกำลังมุ่งเน้นไปที่คำอธิบายภาษาอังกฤษสำหรับแดชบอร์ด GAPHUNTER UAD รุ่น Compact HUD ผมกำลังวิเคราะห์คุณสมบัติหลักของรุ่นนี้โดยเฉพาะ เป้าหมายของผมคือการสร้างคำอธิบายผลิตภัณฑ์ที่แสดงจุดขายและประโยชน์ที่เป็นเอกลักษณ์อย่างชัดเจนสำหรับกลุ่มเป้าหมาย เป้าหมายคือการเน้นย้ำถึงความกะทัดรัดและการใช้งาน การวิเคราะห์คุณสมบัติหลัก ตอนนี้ ผมกำลังเจาะลึกฟีเจอร์สำคัญๆ มากขึ้น โดยเฉพาะอย่างยิ่งในบริบทของผู้ใช้ MQL5 Market โดยเน้นที่การติดตามกำไร/ขาดทุนแบบเรียลไทม์ของ Compact HUD และ
FREE

Tyr Bands Indicator (IC MARKETS GOLD). Just drag and drop. This indicators gets you entry points for the market. it is for gold, but you can configure for any other currency. Tyr Band works with BB and 3 different deviations, plus the Stochastic confirmation. So when the price closes below/above the BB Reversal Band (Red) and the Stochcastic is in the confirmation zone, then the arrow (buy/sell) appears. This arrow indicates that we can entry to the market up/down on the next opening. Since it i
FREE

The indicator highlights the points that a professional trader sees in ordinary indicators. VisualVol visually displays different volatility indicators on a single scale and a common align. Highlights the excess of volume indicators in color. At the same time, Tick and Real Volume, Actual range, ATR, candle size and return (open-close difference) can be displayed. Thanks to VisualVol, you will see the market periods and the right time for different trading operations. This version is intended f
FREE

The indicator draws a normal chart by coloring it in colors based on prices calculated by the Heiken Ashi indicator algorithm.
That is, the shape of the candles does not change.
In fact, this is the same Heiken Ashi that does not distort the price chart.
Then there will be a drawing of a cat, because there is nothing more to write about the indicator. .
FREE

Introdução ao indicador Range Perfect Range Perfect (RP) é um indicador proprietário para MetaTrader 5 desenvolvido pela MX Robots, projetado especialmente para traders que atuam em mercados laterais ou em fases de exaustão de tendência. Ele identifica o enfraquecimento do movimento do preço e destaca zonas de reversão de alta probabilidade em instrumentos como XAUUSD, EURUSD, pares principais de Forex, criptomoedas como Bitcoin e outros ativos voláteis. Ao contrário de muitos indicadores tradic

。。。。。。。。。。。。。。。。。。。。。。。。。。。。。。。。。。。。。。。。。。。 This indicator is based on Bollinger Bands indicator. It helps user clearly know the Band is expand or contract.
The method of use is the same as the traditional Brin channel index. Users can use different color areas to distribute forest channel indicators in expansion or contraction stage. -------------------------------------------------------------------------------------------
FREE
MrGoldTrend is a sophisticated trend-following indicator designed exclusively for XAUUSD (Gold) traders on the MQL5 platform. With clear, easy-to-interpret visual signals, this indicator helps you quickly identify the prevailing trend and make informed trading decisions on the H1 timeframe. MrGoldTrend’s gold lines indicate an uptrend, while blue lines signify a downtrend, providing immediate visual clarity for trend direction. Key Features: Clear Trend Visualization : Gold lines for uptrends, b
FREE
ZigZag Reversal Detector Signals This is a technical indicator based on the ZigZag principle, designed to automatically detect market reversal points and generate clear buy and sell signals. Customizable Parameters ️: Level : Determines the sensitivity of the ZigZag to price changes. Ecart : Sets the minimum distance between two ZigZag points. Rebond : Adjusts the confirmation threshold for a reversal. Alerts & Notifications : Enable or disable according to your needs. Pe
FREE
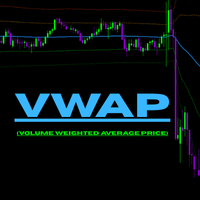
PVWAP Improved MT5 – Indicador avancado de Volume Weighted Average Price PVWAP Improved MT5 e uma versao aprimorada e otimizada do meu indicador VWAP pessoal. Ele exibe o preco medio ponderado pelo volume junto com varias bandas de desvio padrao que ajudam a identificar zonas potenciais de suporte, resistencia e perda de impulso. Funciona em todos os timeframes e permanece leve mesmo com grande quantidade de historico. Proposito do indicador O VWAP representa o preco medio onde ocorreu a maior

This variant of the ZigZag indicator is recalculated at each tick only at the bars that were not calculated yet and, therefore, it does not overload CPU at all which is different from the standard indicator. Besides, in this indicator drawing of a line is executed exactly in ZIGZAG style and, therefore, the indicator correctly and simultaneously displays two of its extreme points (High and Low) at the same bar!
Depth is a minimum number of bars without the second max
FREE

This indicator that I am sharing publicly is an adaptation for MetaTrader 5 (MT5), and I want to make it absolutely clear that it is not my original work . The original code was published on the TradingView platform and can be freely accessed at the following official link:
TradingView – Original Indicator The reason for making it public on MetaTrader 5 is that I want more people to have free access to it, just as its original author shares it on TradingView. This publication is not intended
FREE

CDS SR Fractal Level: Dynamic Fractal Support & Resistance with Breakout Alerts Overview Tired of manually drawing and updating support and resistance lines? The CDS SR Fractal Level indicator automates this crucial process by intelligently identifying key market levels based on fractals. This lightweight and efficient tool allows you to focus on your trading strategy, not on chart setup, ensuring you never miss an important price level or a potential breakout. This indicator is clean, simple,
FREE

O Oscilador de Quebra de Volume é um indicador que combina o movimento dos preços com as tendências de volume sob a forma de um oscilador.
Queria integrar a análise de volume nas minhas estratégias, mas sempre me desiludiram a maioria dos indicadores de volume, como OBV, Money Flow Index, A/D, mas também como Volume Weighted Macd e muitos outros. Por isso escrevi este indicador para mim próprio, estou satisfeito com a sua utilidade e por isso decidi publicá-lo no mercado.
Principais caracterí

El indicador "Time Broker Deriv" está diseñado específicamente para su uso en los índices sintéticos Boom y Crash, así como en otros pares de trading disponibles en la plataforma MT5. Su función principal es proporcionar la hora del broker en comparación con nuestra hora local. Es importante destacar que el indicador "Time Broker Deriv" solo muestra la hora del broker.
FREE

The Simple Dashboard is a dashboard where you can build your own strategy based on RSI, Stochastic, and Moving Average. You can define your own buy and sell signal conditions as you wish. For example, you can set a sell signal when RSI is at the 70 level and Stochastic is in a death cross, or even the opposite. The point is, set it however you like and apply your own custom configuration. That’s how simple it is.
FREE

Indicator measures strength of each currency in your list.
Main idea: It simply iterates through all combinations of pairs and adds difference between open and close in percent. Parameters: List of currencies - what currencies will be calculated (maximum is 8) Calculation type - from which data will be strength calculated Calculation data input - used as input related to calculation type Symbol suffix - used in case of suffix on symbols, e.g: when your symbols look like EURUSDm, EURUSDmicro etc
FREE
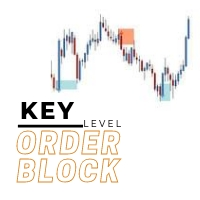
The key level order block indicator automatically draws order-blocks for you on the chart. The indicator compliments any strategy and can also be used as an independent tool. It can work with smart money concepts, harmonic patterns, supply and demand, flag patterns, Quasimodo strategy and many more.
Advantages
The key level order block DOES NOT RE-PAINT, giving you confidence when a signal appears and also helps when looking back. The key level order block includes an on/off button on the c

Three Bar Break is based on one of Linda Bradford Raschke's trading methods that I have noticed is good at spotting potential future price volatility. It looks for when the 1st bar's High is less than the 3rd bar's High as well as the 1st bar's Low to be higher than the 3rd bar's Low. This then predicts the market might breakout to new levels within 2-3 of the next coming bars. It should be used mainly on the daily chart to help spot potential moves in the coming days. Features :
A simple meth
FREE
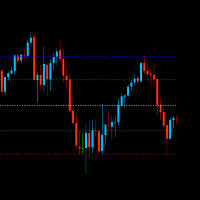
Indicador de topo e fundo, com a liberdade de escolha da barra inicial e tempo gráfico a ser usado para calculo independentemente do time frame do gráfico atual. Também plota linhas de meio do range e de retração de 23%. Bom indicador de forca de mercado e direção atual do deslocamento do preço. Também com a total liberdade de configurações de tipos de linhas e cores para cada linha do indicador. Também conta com indicador do tempo a barra e saldo aberto no ativo.
FREE

This Indicator works as a momentum oscillator however it is most used to surf the trends. Despite of being an oscillator, MACD (Moving Average Convergence/Divergence) doesn't work with over limit conditions (such as OverBought or OverSold). Graphically it's shown as two lines and an histogram with the diference of them. Standard metatrader has this indicator, however with only the two lines and without the histogram. This way it is much easier to read and uderstand it.
FREE
Saiba como comprar um robô de negociação na AppStore do MetaTrader, a loja de aplicativos para a plataforma MetaTrader.
O Sistema de Pagamento MQL5.community permite transações através WebMoney, PayPay, ePayments e sistemas de pagamento populares. Nós recomendamos que você teste o robô de negociação antes de comprá-lo para uma melhor experiência como cliente.
Você está perdendo oportunidades de negociação:
- Aplicativos de negociação gratuitos
- 8 000+ sinais para cópia
- Notícias econômicas para análise dos mercados financeiros
Registro
Login
Se você não tem uma conta, por favor registre-se
Para login e uso do site MQL5.com, você deve ativar o uso de cookies.
Ative esta opção no seu navegador, caso contrário você não poderá fazer login.