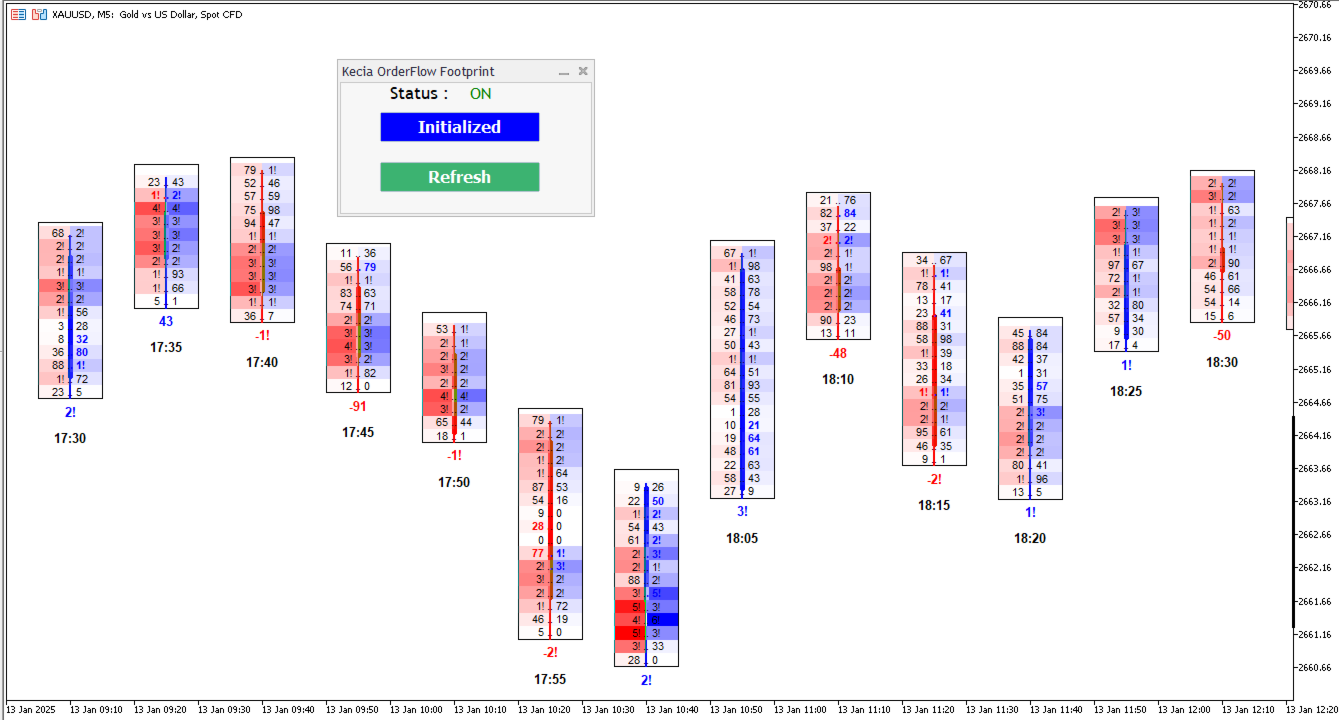
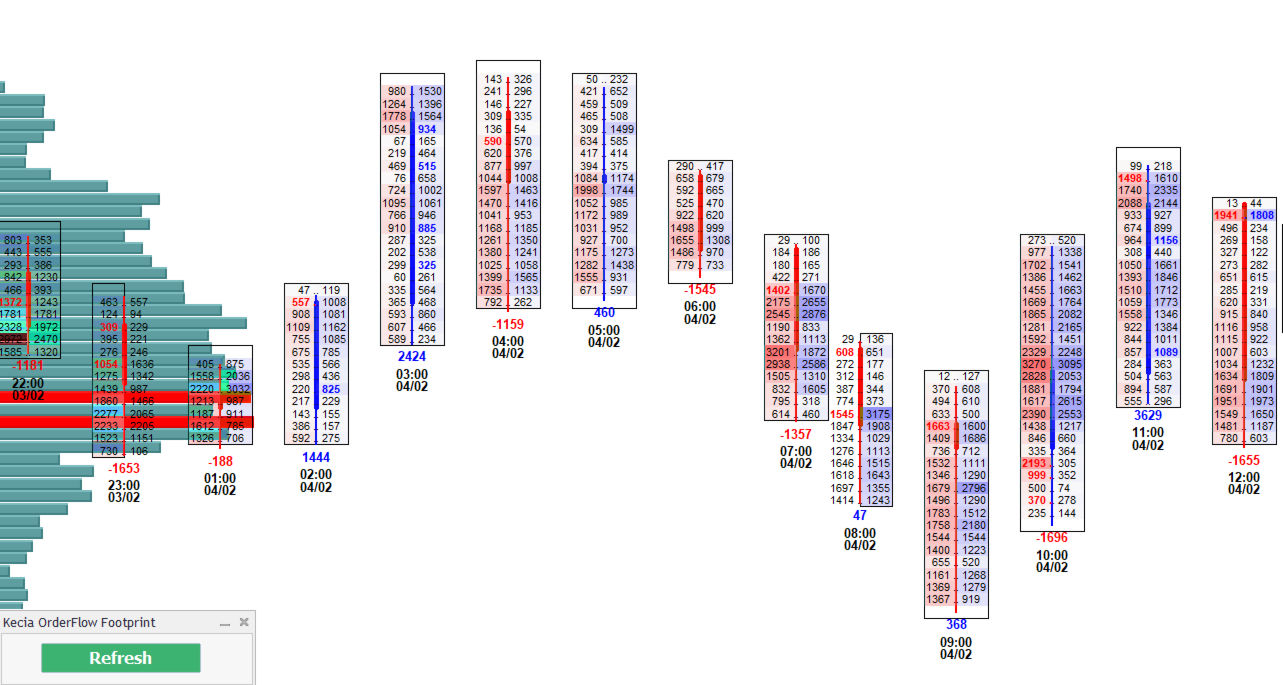
Kecia Footprint Orderflow
- Indicadores
- Versão: 2.80
- Atualizado: 3 julho 2025
- Ativações: 10

if you want to test it : private message me (MT5 demo testing doesn't work)
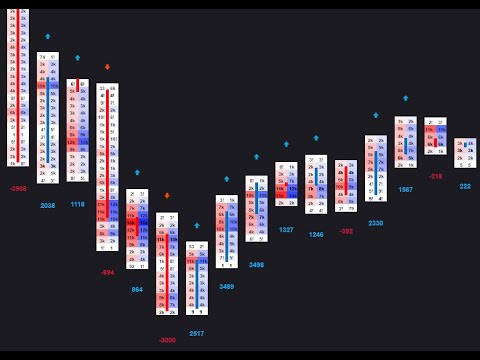
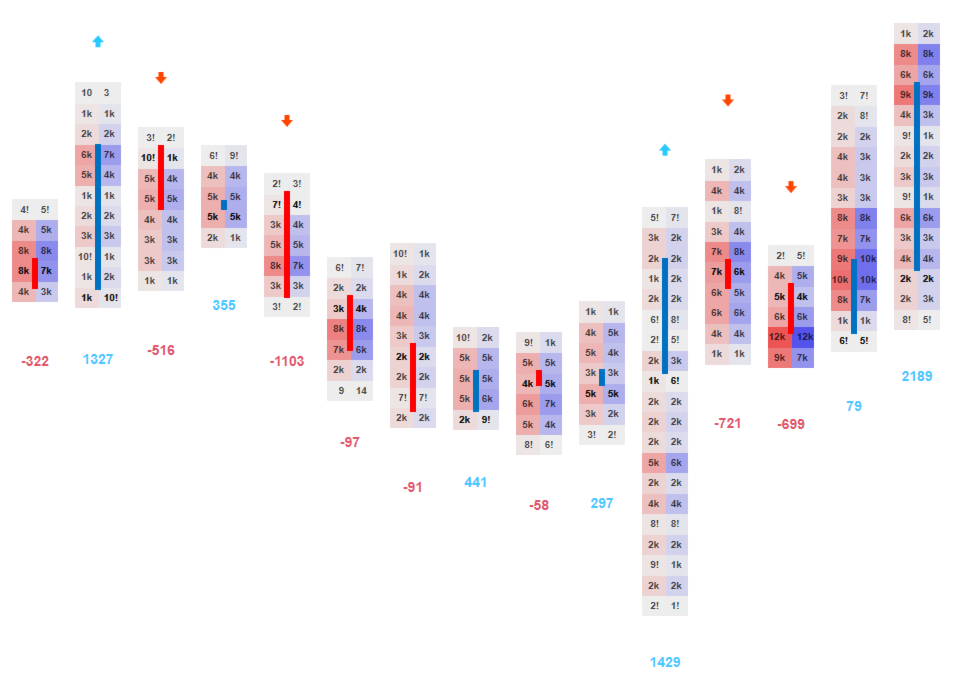
Designed to help traders gain a deeper understanding of the market’s true order flow dynamics. By visualizing the “footprints” left by candles, this indicator reveals how the delta (the difference between buying and selling pressure) changes during the candle formation, as well as how volume fluctuates at different price levels. These insights are essential for traders seeking to identify reversals, breakouts, and key support or resistance zones based on the underlying order flow.
What sets this indicator apart is its ability to display bid-ask imbalances and its comprehensive visualization of how the market's order flow evolves. With this tool, traders can precisely track volume changes and delta variations to understand where significant shifts in market sentiment are occurring, helping you to make better-informed trading decisions.
It is important to note that the footprint data presented by this indicator is an approximation rather than an exact representation of the real volume. This is because MT5 does not natively offer access to raw, real-time order flow data at the tick level. As such, the Kecia Footprint Orderflow indicator uses available data to estimate volume during tick movements, providing you with a close approximation of market behavior, but not an exact picture of the actual order volume. Despite this limitation, the indicator performs its best to “understand” the real volume during tick formations, enabling traders to make informed decisions based on an educated estimation of market activity.
Practical Applications
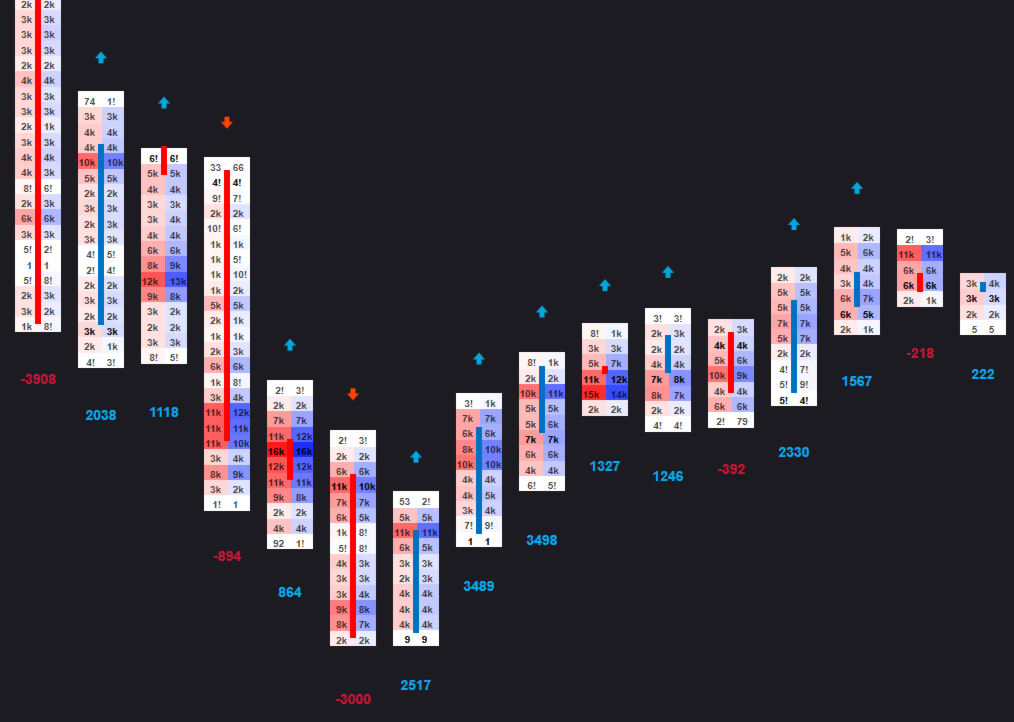
- Spotting Reversals:This indicator is ideal for spotting potential reversal points. When a price trend starts to lose momentum, the delta and volume data become crucial for confirming whether a reversal is about to take place. If delta shifts dramatically from negative to positive (or vice versa), accompanied by a volume spike, the indicator marks this with arrows, alerting you to a potential shift in market sentiment.For example, during a bullish trend, if the delta shows increasing selling pressure or negative delta values, it could signal a weakening uptrend and a possible reversal. Conversely, during a downtrend, a spike in buying pressure and positive delta can indicate the beginning of a bullish reversal.
- Identifying Breakouts:Breakouts are often the result of a significant imbalance between buyers and sellers. The Kecia Footprint Orderflow indicator tracks these imbalances by showing large delta shifts and volume spikes, especially at key price levels such as support and resistance zones.When the delta crosses a specific threshold (set by the user), and there is a surge in volume, it signals that a breakout is likely. The indicator will plot arrows at these levels, providing early warnings of breakout opportunities.By combining delta variations and volume analysis, traders can confidently enter trades in the direction of the breakout, armed with real-time data confirming the strength of the move.
- Confirming Trend Strength:This indicator is not just useful for spotting reversals and breakouts—it can also help confirm the strength of an ongoing trend. If the delta continues to show increasing buying or selling pressure in the direction of the trend, it’s a sign that the trend is likely to continue. This information is critical when deciding whether to hold onto a position or exit early.For example, if the market is in an uptrend, and delta shows persistent positive values (buying pressure) with increasing volume, you can be more confident that the trend will continue. On the other hand, if delta starts fluctuating or moving in the opposite direction, it might be a sign that the trend is weakening, and a reversal could be imminent.
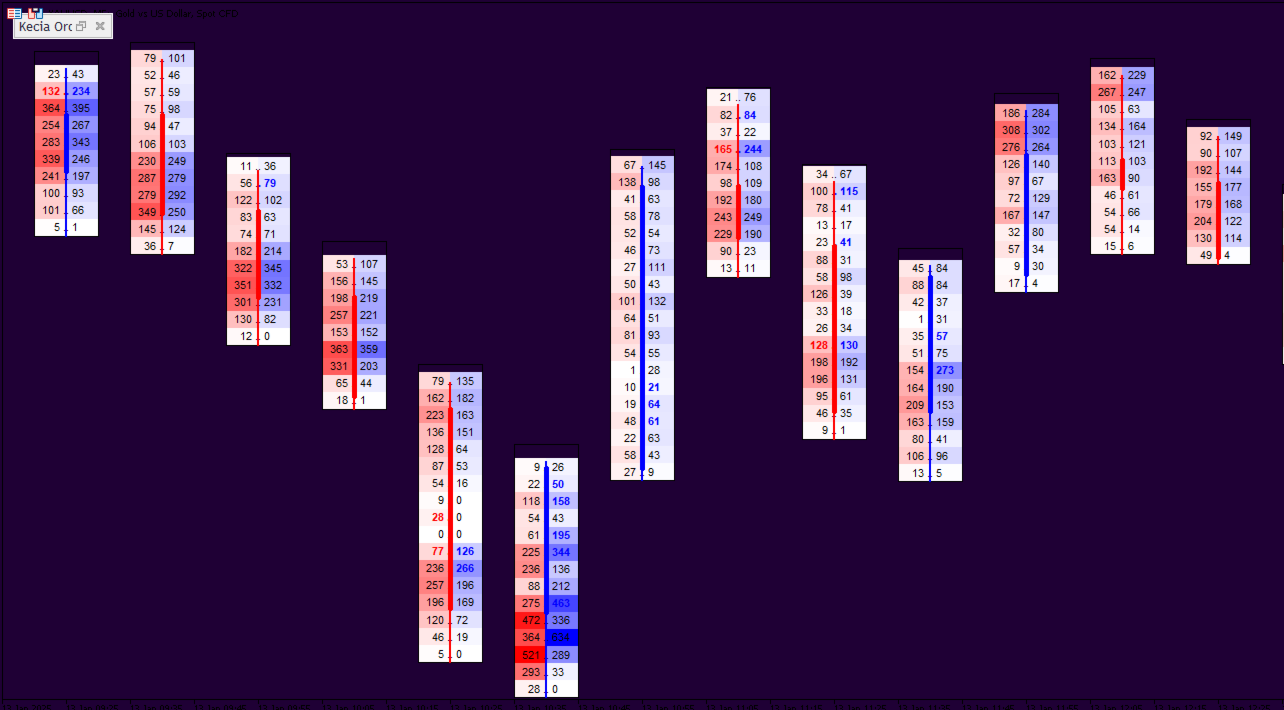
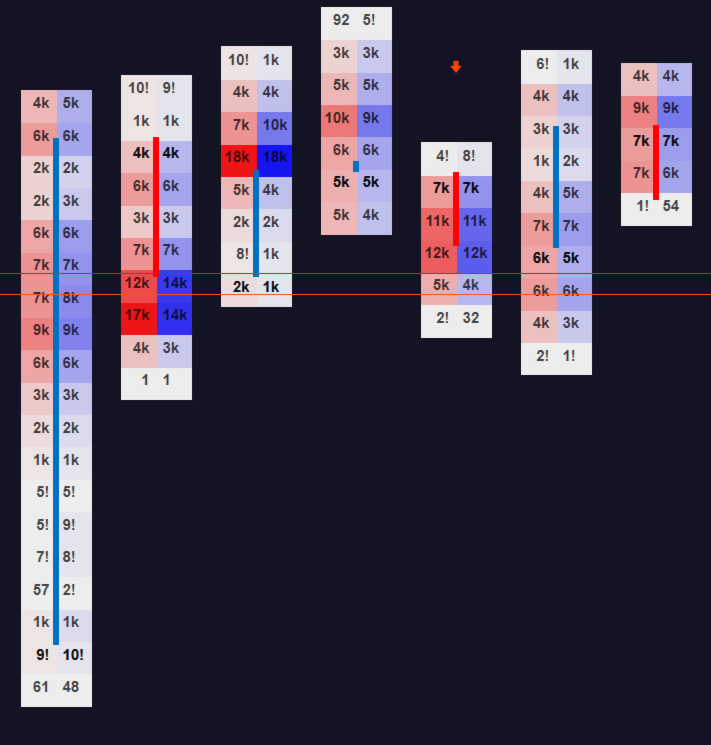
- Volume Analysis for Market Sentiment:Volume is an essential tool for confirming price moves and understanding the market’s true sentiment. The Kecia Footprint Orderflow indicator allows you to see where large volumes are concentrated at specific price levels. This data helps identify high-interest zones where significant market participants are positioning their orders.For example, if a price moves higher with increasing volume and a positive delta, it signals strong buying pressure and a bullish sentiment. If volume decreases while the price continues to rise, it might signal a weakening trend, suggesting that the price move could soon reverse.By analyzing the volume profile and delta in real time, the indicator allows you to understand how market sentiment is evolving and adjust your strategy accordingly.
- Bid-Ask Imbalances for Price Confirmation:The Kecia Footprint Orderflow indicator also helps identify bid-ask imbalances, a crucial tool for understanding the underlying strength of price movements. These imbalances reveal where there is more buying or selling pressure at specific price levels.When the ask (sell orders) outweighs the bid (buy orders), it can indicate that sellers are in control, potentially pushing the price lower. Conversely, when the bid outweighs the ask, buyers are in control, and the price may rise. By identifying these imbalances in real time, you can anticipate price movements before they are fully reflected in the chart, giving you a key advantage in fast-moving markets.
New Features:
- volume profile
- daily volume profile

great indi as well as great support