KT Weis Wave Volume MT5
- Indicadores
-
KEENBASE SOFTWARE SOLUTIONS
 A Keenbase Trading desenvolve indicadores profissionais e Expert Advisors para MetaTrader 4 e MetaTrader 5, ajudando traders a tomar decisões de negociação mais informadas.
 - Versão: 1.0
- Ativações: 10
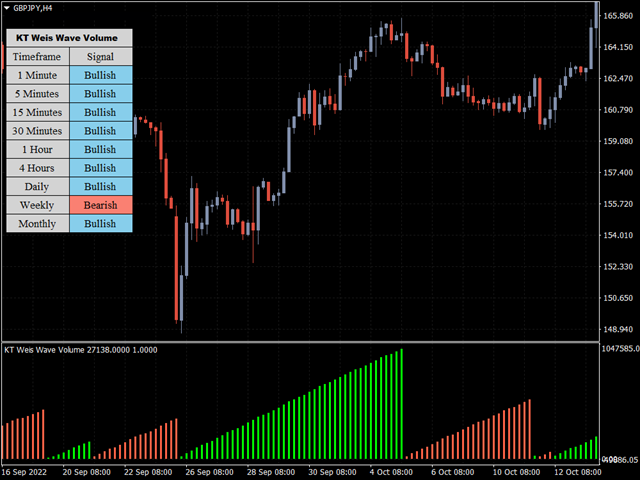
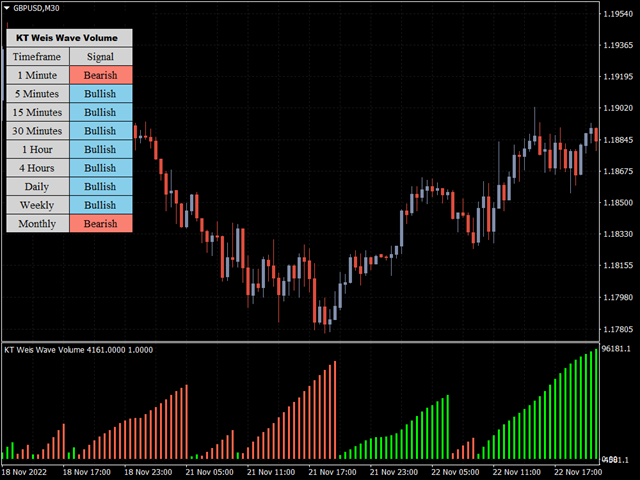
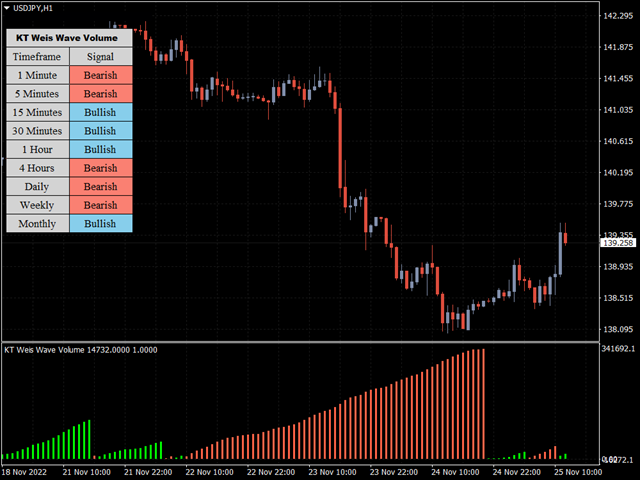
O indicador KT Weis Wave Volume é uma ferramenta técnica baseada na tendência atual do mercado e na direção do movimento dos preços. O indicador utiliza o volume e exibe os volumes acumulados para os aumentos e quedas de preço no gráfico.
Além disso, a janela do indicador mostra um histograma de ondas verdes e ondas vermelhas em ascensão.
A cor verde representa o movimento de alta; quanto mais o preço sobe, maior é o volume verde. A cor vermelha representa uma onda de baixa; o volume vermelho aumenta conforme o preço cai. Ao analisar cada onda gerada, o indicador permite entender melhor o estado do mercado volátil.
Recursos
- O indicador fornece ondas de preços e volumes para qualquer mercado.
- Ajuda a determinar a direção e a força da tendência.
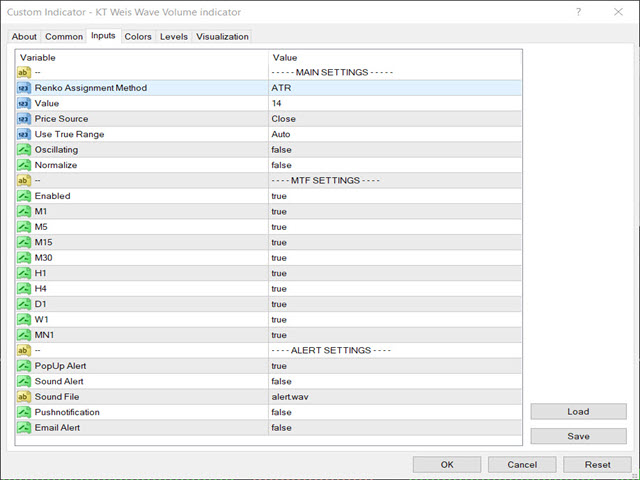
- Você pode personalizar as configurações e os esquemas de cores conforme sua preferência.
- Funciona em todos os períodos de tempo.
Como funciona o KT Weis Wave Volume
O volume Weis Waves soma os volumes de cada onda. É assim que obtemos um gráfico de barras com volumes acumulados de ondas alternadas.
O volume acumulado é o que torna os gráficos Weis Wave únicos. Isso permite comparar a relação entre as características da sequência de ondas, como a força aplicada (expressa em volume) e o resultado obtido (na barra de preços).