Color Bollinger Bands

5

。。。。。。。。。。。。。。。。。。。。。。。。。。。。。。。。。。。。。。。。。。。

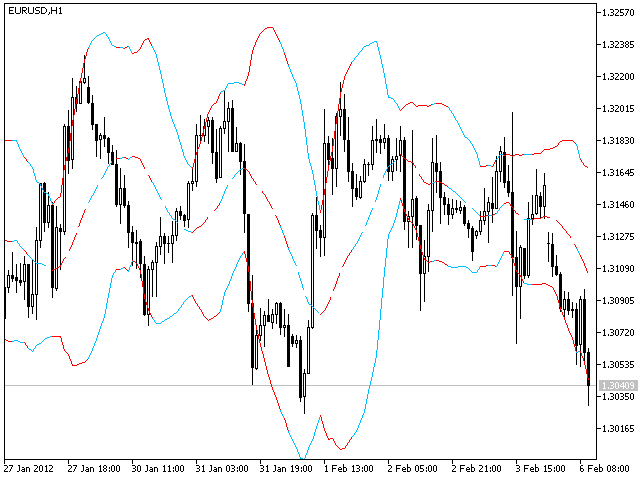
This indicator is based on Bollinger Bands indicator. It helps user clearly know the Band is expand or contract.


The method of use is the same as the traditional Brin channel index.

Users can use different color areas to distribute forest channel indicators in expansion or contraction stage.

-------------------------------------------------------------------------------------------


Comentários 7
AlephTrader
26
AlephTrader 2025.05.30 11:35 
 

He mejorado mi operativa considerablemente con este indicador. Es fantástico. Lo recomiendo un 100%. Muchas gracias MQL5.

BlackArmor
438
BlackArmor 2024.05.20 12:21 
 

Thank you. Very good indicator when combining it with your system.

Heitor Leal Farnese
229
Heitor Leal Farnese 2021.07.09 03:03 
 

Loved it. It's very nice to be always able to know whether the bands are expanding or contracting.

Produtos recomendados
The indicator draws a normal chart by coloring it in colors based on prices calculated by the Heiken Ashi indicator algorithm. That is, the shape of the candles does not change. In fact, this is the same Heiken Ashi that does not distort the price chart. Then there will be a drawing of a cat, because there is nothing more to write about the indicator. .                                                       
FREE
Flow Architect
Alex Amuyunzu Raymond
Flow Architect Lite - Professional Market Structure Toolkit Free Version Features: Core Structure Analysis: Daily VWAP Engine   - Volume-weighted average price for institutional level tracking Standard Deviation Bands (SD1)   - Dynamic support and resistance zones Break of Structure Detection   - Visual markers for market structure shifts Fair Value Gap Identification   - Highlighted imbalance zones on your charts ATR Volatility Context   - Real-time Average True Range measurement Clean Informat
FREE
Ticks Bars
Andrej Nikitin
4 (2)
This tick indicator draws synthetic bars/candlesticks that contain a definite number of ticks. Parameters: option prices - price option. It can be Bid, Ask or (Ask+Bid)/2. the number of ticks to identify Bar - number of ticks that form OHLC. price levels count - number of displayed price levels (no levels are displayed if set to 0 or a lower value). calculated bar  - number of bars on the chart. Buffer indexes: 0 - OPEN, 1 - HIGH, 2 - LOW, 3 - CLOSE.
FREE
O indicador   "Haven Key Levels PDH PDL"   ajuda os traders a visualizar os níveis-chave no gráfico. Ele marca automaticamente os seguintes níveis: DO (Daily Open)   — o nível de abertura diária. NYM (New York Midnight)   — o nível da meia-noite de Nova Iorque. PDH (Previous Day High)   — o máximo do dia anterior. PDL (Previous Day Low)   — o mínimo do dia anterior. WO (Weekly Open)   — o nível de abertura semanal. MO (Monthly Open)   — o nível de abertura mensal. PWH (Previous Week High)   — o
FREE
DALA Forecast
Grigorii Matsnev
About the indicator: DALA Forecast is a universal tool for predicting the dynamics of time series of any nature. For prediction, modified methods of nonlinear dynamics analysis are used, on the basis of which a predictive model is built using machine learning methods.  To get the trial version of the indicator, you can contact me in private messages. How to use the indicator: Apply the indicator to your chosen financial instrument or indicator with the settings you need. The prediction will be
FREE
Donchian Channel DC is the indicator of Donchian Channels, that plots maximum and minimum values of a specific period, besides mean value line. It´s possible to configure simple period for analysis and the indicator will plot all three values. You can trade with this indicator as trend or reversal, according to each strategy. Do not let to test others indicators as soon as others expert advisors.
Fixed Time AVWAP (Free) — Basic Fair Price Analysis The Fixed Time AVWAP indicator is a crucial tool for any trader, based on the Volume-Weighted Average Price (VWAP) concept. We provide you with an accurate and reliable AVWAP line, calculated from a user-fixed time, which is essential for determining the current fair value of an asset. Understanding VWAP: Why You Need This Indicator? VWAP is the average price at which an instrument has traded, adjusted by volume. It highlights where the
FREE
FT ROC Histogram
FLEK TRADING s.r.o.
3 (1)
The indicator displays the value of ROC (Rate of change) from the selected price or moving average as a histogram. You can plot the moving average ROC values for smoothing indicator. Displayed Data ExtROC - rate of change ExtMAROC - smoothing line Parameters You can change the price, on which the indicator is calculated. Inputs InpMAPeriod - in case you want to calculate the moving average ROC, enter averaging period. Enter 1 for the calculation of the specified prices. InpMAMethod - smoothin
FREE
Follow The Line MT5
Oliver Gideon Amofa Appiah
4.6 (35)
This indicator obeys the popular maxim that: "THE TREND IS YOUR FRIEND" It paints a GREEN line for BUY and also paints a RED line for SELL. (you can change the colors). It gives alarms and alerts of all kinds. IT DOES NOT REPAINT and can be used for all currency pairs and timeframes. Yes, as easy and simple as that. Even a newbie can use it to make great and reliable trades. NB: For best results, get my other premium indicators for more powerful and reliable signals. Get them here: https://www.m
FREE
RCCMA is a general moving average indicator that works with ReviewCandleChart. Original is "Custom Moving Average" provided by MetaQuotes Software Corp. Based on that source code, I corresponded to ReviewCandleChart . Advantages When ReviewCandleChart is ON, no line will be displayed on the right side from the vertical reference line. When ReviewCandleChart is ON and you press a key such as "Z" or "X" Following that, the MA is drawn. When ReviewCandleChart is OFF, the same drawing as the origin
FREE
Weis Waves
Flavio Javier Jarabeck
2.83 (18)
The original author is David Weis, an expert in the Wyckoff Method. The Weis Wave is a modern adaptation of the 1930's Wyckoff Method, another expert in Tape Reading techniques and Chart Analysis. Weis Waves takes market volume and stacks it into waves according to price conditions giving the trader valuable insights about the market conditions. If you want to learn more about this subject you can find tons of videos in YouTube. Just look for "The Wickoff Method", "Weis Wave" and "Volume Spread
FREE
MACD Enhanced
Nikita Berdnikov
5 (2)
Introducing the MACD  Enhanced – an advanced MACD (Moving Average Convergence Divergence) indicator that provides traders with extended capabilities for trend and momentum analysis in financial markets. The indicator uses the difference between the fast and slow exponential moving averages to determine momentum, direction, and strength of the trend, creating clear visual signals for potential entry and exit points. Attention! To achieve the best results, it is recommended to adapt the indicator
FREE
Apex WilliamsR MT5 Looking for sharper entries? This indicator provides the foundation for visual price action. However, specialized markets require specialized tools. If you trade Gold or Indices, check out Gold Master Indicator or Nasdaq Master Indicator , specifically optimized for those assets' unique volatility. Don't just trade; trade with the right edge. Apex Williams %R MT5 is a professional technical indicator that enhances the traditional Williams %R oscillator with advanced momentum
FREE
Expansoes M
Marcus Vinicius Da Silva Miranda
As Expansões M são variações da Proporção Áurea (Sequência de Fibonacci). É a primeira técnica de projeção, no mercado mundial, desenvolvida para ancoragem em Candle. Vantagens: Fácil Plotagem, pode ser ancorada em apenas um Candle; Alto grau de precisão como suportes / resistências; Excelente relação de Risco x Retorno; Funciona em qualquer tempo gráfico; Funciona em qualquer ativo.   As regiões das Expansões M são classificadas em: M0: Ponto 0 (candle inicial) LC: Linha de suporte inicial
FREE
Fibonacci Trend Indicator
Vinoth Durairaj Durairaj
Fibonacci Trend Indicator for MT5 Unlock the power of Fibonacci analysis on your MetaTrader 5 charts! Our   Fibonacci Trend Indicator   automatically plots dynamic support and resistance levels so you can spot trends, reversals, and breakout opportunities at a glance. Features & Advantages Automatic Fibonacci Levels Instantly displays seven key Fibonacci retracement levels based on the highest and lowest prices from your chosen lookback period — no manual work required. Dynamic Trend Adaptatio
FREE
Waves Sizer
Flavio Javier Jarabeck
3.86 (7)
Wyckoff fans, enjoy! Ideally to be used with the Weis Waves indicator, but it can be easily used alone, the Waves Sizer puts the range (in resulting Price movement) done by the Price on its market swings. You can control how accurate or loose will be the swings. This tool is very helpful for visually know how much the Price has traveled in your Timeframe. This way you can confront this level of effort with the resulting Volume, etc... Weis Waves indicator: https://www.mql5.com/en/market/produc
FREE
An analogue of the Stochastic oscillator based on algorithms of singular spectrum analysis (SSA) SSA is an effective method to handle non-stationary time series with unknown internal structure. It is used for determining the main components (trend, seasonal and wave fluctuations), smoothing and noise reduction. The method allows finding previously unknown series periods and make forecasts on the basis of the detected periodic patterns. Indicator signals are identical to signals of the original i
FREE
Indicator and Expert Adviser  EA Available in the comments section of this product. Download with Indicator must have indicator installed for EA to work. Mt5 indicator alerts for bollinger band and envelope extremes occurring at the same time. Buy signal alerts occur when A bullish candle has formed below both the lower bollinger band and the lower envelope  Bar must open and close below both these indicators. Sell signal occur when A bear bar is formed above the upper bollinger band and upper
FREE
This indicator is an automated version of the Fibonacci retracement (Fib) indicator. Deciding the best areas to use when drawing the fib can be tricky and this  indicator was made with that in mind. When you drop it on the chart it will automatically choose the best points to draw the fib with, but in case you aren't satisfied with those regions, you can adjust it as you wish.
FREE
This is addition of  Effective SV squeeze momentum  that add bolliger band and Keltner channel to chart window.  Squeeze momentum introduced by “John Carter”, the squeeze indicator for MT5 represents a volatility-based tool. Regardless, we can also consider the squeeze indicator as a momentum indicator, as many traders use it to identify the direction and strength of price moves. In fact, the Tradingview  squeeze indicator shows when a financial instrument is willing to change from a trending ma
FREE
Value Chart Candlesticks
Flavio Javier Jarabeck
4.69 (13)
The idea of a Value Chart indicator was presented in the very good book I read back in 2020 , " Dynamic Trading Indicators: Winning with Value Charts and Price Action Profile ", from the authors Mark Helweg and David Stendahl. The idea is simple and the result is pure genius: Present candlestick Price analysis in a detrended way! HOW TO READ THIS INDICATOR Look for Overbought and Oversold levels. Of course, you will need to test the settings a lot to find the "correct" one for your approach. It
FREE
Este indicador é baseado no indicador Bollinger Bands. Ele ajuda o trader a identificar uma entrada para comprar ou vender. Vem com um alerta sonoro sempre que um novo sinal aparece. Ele também possui mensagens via e-mail. O seu endereço de e-mail e configurações do servidor SMTP devem ser inseridos na janela "Opções" da guia "Ferramentas" no seu MetaTrader 5. Seta azul pra cima = Compra. Seta vermelha para baixo = Venda Linha = Trailing Stop. Você também pode usar um dos meus produtos, o Traili
FREE
Are you tired of drawing trendlines every time you're analyzing charts? Or perhaps you would like more consistency in your technical analysis. Then this is for you. This indicator will draw trend lines automatically when dropped on a chart. How it works Works similar to standard deviation channel found on mt4 and mt5. It has 2 parameters: 1. Starting Bar 2. Number of bars for calculation The   starting bar   is the bar which drawing of the trend lines will begin, while the   number of bars for c
FREE
SC MTF Stochastic MT5
Krisztian Kenedi
4.87 (15)
Highly configurable Stochastic indicator. Features: Highly customizable alert functions (at levels, crosses, direction changes via email, push, sound, popup) Multi timeframe ability Color customization (at levels, crosses, direction changes) Linear interpolation and histogram mode options Works on strategy tester in multi timeframe mode (at weekend without ticks also) Adjustable Levels Parameters: Stochastic Timeframe:  You can set the lower/higher timeframes for Stochastic. Stochastic    Bar S
FREE
Candle Heiken Ashi
BPASoftware Thai Co. Ltd
5 (2)
Presentation Another indicator that makes scalping on tick charts easier, it displays an Heiken Ashi graph in Ticks. It allows to detect entry points and trend reversals. Recommended  number of ticks in a candle : 5, 13 or 21. Parameters Ticks in candle: Number of ticks in a candle (default 5), Displays Trend arrows : displays a trend arrow based on EMA8 and EMA20 crossing, Displays MM50, Displays MM100, Max Candle (CPU): number of candles max to manage, low value will save ressources of your
FREE
Panic Meter limited
Dmitriy Gurenko
1 (1)
The indicator measures the frequency of incoming ticks to analyze the market activity. Bullish and bearish ticks are analyzed separately, informing about the currently predominant market sentiment. According to observations, an increase in the frequency of ticks (panic) indicates the beginning of strong price changes, and an increase in the frequency of ticks in a particular direction not only accompanies a price change in this direction, but also often anticipates it. The indicator is indispens
FREE
Este indicador é baseado no indicador Heiken Ashi. Ele ajuda o usuário a identificar se é para comprar ou vender. Ele vem com um alerta que soará sempre que um novo sinal aparece. Ele também possui uma facilidade de e-mail. O seu endereço de e-mail e configurações do servidor SMTP devem ser especificados na janela de configurações do guia "caixa de correio" no seu MetaTrader 5. Seta azul para cima = Compra. Seta vermelha para baixo = Sell. Linha = stop móvel. Você pode usar um dos meus produtos
FREE
Descrição geral Este indicador é uma versão aprimorada do Canal Donchian clássico, enriquecida com funções práticas para o trading real. Além das três linhas padrão (máxima, mínima e linha do meio), o sistema detecta breakouts e os mostra visualmente com setas no gráfico, exibindo apenas a linha oposta à direção da tendência atual para uma leitura mais limpa. O indicador inclui: Sinais visuais : setas coloridas nos breakouts Notificações automáticas : alerta pop-up, push e e-mail Filtro RSI : pa
FREE
Special offer : ALL TOOLS , just $35 each! New tools   will be   $30   for the   first week   or the   first 3 purchases !  Trading Tools Channel on MQL5 : Join my MQL5 channel to update the latest news from me O indicador Supertrend Fakeout é uma versão aprimorada do clássico indicador Supertrend , projetado para fornecer sinais de tendência mais confiáveis. Ao incorporar recursos avançados como Fakeout Index Limit e Fakeout ATR Mult , este indicador ajuda a filtrar reversões de tendência fals
FREE
Indicador Heiken Ashi MT5 Eleve sua análise de mercado com o Indicador Heiken Ashi MT5. Esta poderosa ferramenta transforma os dados de preços padrão em velas mais suaves, focadas em tendências, facilitando a identificação de tendências de mercado e potenciais pontos de reversão. Características principais: Identificação clara de tendências: Distingue visualmente entre tendências de alta e baixa com cores de velas distintas. Redução de ruído: Filtra as flutuações de preços, proporcionando uma v
FREE
Os compradores deste produto também adquirem
Se você comprar este indicador, receberá meu Gerenciador de Operações Profissional + EA  GRATUITAMENTE. Primeiramente, vale ressaltar que este Sistema de Trading é um Indicador Não Repintado, Não Redesenho e Não Atrasado, o que o torna ideal tanto para o trading manual quanto para o automatizado. Curso online, manual e download de predefinições. O "Sistema de Trading Inteligente MT5" é uma solução completa de trading projetada para traders novos e experientes. Ele combina mais de 10 indicadores
Power Candles MT5
Daniel Stein
5 (2)
Power Candles – Sinais de entrada baseados em força para qualquer mercado Power Candles leva a análise de força comprovada da Stein Investments diretamente para o seu gráfico de preços. Em vez de reagir apenas ao preço, cada candle é colorido com base na força real do mercado, permitindo identificar instantaneamente a construção de momentum, aceleração de força e transições limpas de tendência. Uma única lógica para todos os mercados Power Candles funciona automaticamente em todos os símbolos de
Divergence Bomber
Ihor Otkydach
4.96 (77)
Cada comprador deste indicador recebe adicionalmente, e de forma gratuita: A ferramenta exclusiva "Bomber Utility", que acompanha automaticamente cada operação, define os níveis de Stop Loss e Take Profit e fecha operações de acordo com as regras da estratégia; Arquivos de configuração (set files) para ajustar o indicador em diferentes ativos; Set files para configurar o Bomber Utility nos modos: "Risco Mínimo", "Risco Balanceado" e "Estratégia de Espera"; Um vídeo tutorial passo a passo que aju
FX Power MT5 NG
Daniel Stein
5 (28)
FX Power: Analise a Força das Moedas para Decisões de Negociação Mais Inteligentes Visão Geral FX Power é a sua ferramenta essencial para compreender a força real das principais moedas e do ouro em quaisquer condições de mercado. Identificando moedas fortes para comprar e fracas para vender, FX Power simplifica as decisões de negociação e revela oportunidades de alta probabilidade. Quer você prefira seguir tendências ou antecipar reversões usando valores extremos de Delta, esta ferramenta adap
***Entry In The Zone and SMC Multi Timeframe é uma ferramenta de análise de mercado em tempo real desenvolvida com base nos Smart Money Concepts (SMC). Ela foi projetada para ajudar os traders a analisarem a estrutura do mercado de forma sistemática e obterem uma visão mais clara da direção geral do mercado. O sistema analisa automaticamente Pontos de Reversão, Zonas-Chave e a Estrutura de Mercado em múltiplos timeframes, enquanto exibe Points of Interest (POI), sinais sem repaint e níveis autom
AriX
Temirlan Kdyrkhan
1 (4)
AriX Indicator for MT5 A powerful trend-following and signal-evaluation tool AriX is a custom MT5 indicator that combines Moving Averages and ATR-based risk/reward logic to generate clear buy/sell signals. It visualizes dynamic SL/TP levels, evaluates past trade outcomes, and displays win/loss statistics in a clean on-chart panel. Key features include: Buy/Sell signals based on MA crossovers ATR-based SL/TP1/TP2/TP3 levels with visual lines and labels Signal outcome tracking with real-time stat
O Game Changer é um indicador de tendências revolucionário, concebido para ser utilizado em qualquer instrumento financeiro, transformando o seu metatrader num poderoso analisador de tendências. O indicador não se retraça nem apresenta atrasos. Funciona em qualquer período de tempo e auxilia na identificação de tendências, sinaliza potenciais reversões, atua como um mecanismo de trailing stop e fornece alertas em tempo real para respostas rápidas do mercado. Quer seja um profissional experiente
ARICoins
Temirlan Kdyrkhan
ARICoin is a powerful trading companion designed to generate high-probability entry signals with dynamic TP/SL/DP levels based on volatility. Built-in performance tracking shows win/loss stats, PP1/PP2 hits, and success rates all updated live. Key Features: Buy/Sell signals with adaptive volatility bands Real-time TP/SL/DP levels based on ATR Built-in MA Filter with optional ATR/StdDev volatility Performance stats panel (Success, Profit/Loss, PP1/PP2) Alerts via popup, sound, push, or email Cust
Atomic Analyst MT5
Issam Kassas
4.19 (27)
Primeiramente, vale ressaltar que este Indicador de Negociação não repinta, não redesenha e não apresenta atrasos, tornando-o ideal tanto para negociação manual quanto automatizada. Manual do utilizador: configurações, entradas e estratégia. O Analista Atômico é um Indicador de Ação de Preço PA que utiliza a força e o momentum do preço para encontrar uma vantagem melhor no mercado. Equipado com filtros avançados que ajudam a remover ruídos e sinais falsos, e aumentam o potencial de negociação.
Gold Sniper Scalper Pro
Ich Khiem Nguyen
3.29 (7)
Gold Sniper Scalper Pro - Sistema de Negociação de Ouro (XAU/USD) no MetaTrader 5 Para o negociador sério: Aborde a negociação de Ouro com uma metodologia estruturada e baseada em dados que combina múltiplos fatores de análise de mercado. Esta ferramenta foi construída para apoiar a sua análise de negociação de Ouro. Oportunidade de Preço Limitada Esta é uma chance de possuir o Gold Sniper Scalper Pro antes que o preço aumente. O preço do produto aumentará $50 após cada 10 compras subsequentes.
Trend Screener Pro MT5
STE S.S.COMPANY
4.84 (99)
Desbloqueie o poder da negociação de tendências com o indicador Trend Screener: sua solução definitiva de negociação de tendências, alimentada por lógica difusa e sistema de múltiplas moedas! Eleve sua negociação de tendências com o Trend Screener, o revolucionário indicador de tendências alimentado por lógica difusa. É um poderoso indicador de acompanhamento de tendências que combina mais de 13 ferramentas e recursos premium e 3 estratégias de negociação, tornando-o uma escolha versátil para to
Azimuth Pro
Ottaviano De Cicco
5 (1)
PROMOÇÃO DE LANÇAMENTO O preço do Azimuth Pro está inicialmente definido em 299 $ para os primeiros 100 compradores. O preço final será de 499 $. A DIFERENÇA ENTRE ENTRADAS RETAIL E INSTITUCIONAIS NÃO É O INDICADOR — É A LOCALIZAÇÃO. A maioria dos traders entra em níveis de preço arbitrários, perseguindo momentum ou reagindo a sinais atrasados. As instituições esperam o preço atingir níveis estruturados onde oferta e demanda realmente mudam. Azimuth Pro mapeia esses níveis automaticamente: V
Smart Stop Indicator – Precisão inteligente de stop-loss diretamente no seu gráfico Visão geral O Smart Stop Indicator é a solução ideal para traders que desejam definir seu stop-loss de forma clara e metódica, sem adivinhações ou decisões baseadas apenas na intuição. A ferramenta combina lógica clássica de price action (topos mais altos, fundos mais baixos) com um sistema moderno de detecção de rompimentos para identificar onde realmente deve estar o próximo nível lógico de stop. Seja em tend
ARIScalping
Temirlan Kdyrkhan
ARIScalp is a powerful trading companion designed to generate high-probability entry signals with dynamic TP/SL/DP levels based on volatility. Built-in performance tracking shows win/loss stats, PP1/PP2 hits, and success rates all updated live. Key Features: Buy/Sell signals with adaptive volatility bands Real-time TP/SL/DP levels based on ATR Built-in MA Filter with optional ATR/StdDev volatility Performance stats panel (Success, Profit/Loss, PP1/PP2) Alerts via popup, sound, push, or email Cus
FX Levels MT5
Daniel Stein
5 (12)
FX Levels: Suporte e Resistência com Precisão Excepcional para Todos os Mercados Visão Geral Rápida Procurando um meio confiável de identificar níveis de suporte e resistência em qualquer mercado—incluindo pares de moedas, índices, ações ou commodities? FX Levels combina o método “Lighthouse” tradicional com uma abordagem dinâmica de vanguarda, fornecendo uma precisão quase universal. Baseado em nossa experiência real com corretores e em atualizações automáticas diárias mais as de tempo real,
Trend indicator AI mt5
Ramil Minniakhmetov
5 (13)
O indicador Trend Ai é uma ótima ferramenta que irá melhorar a análise de mercado de um trader, combinando a identificação de tendências com pontos de entrada acionáveis e alertas de reversão. Este indicador permite que os usuários naveguem pelas complexidades do mercado forex com confiança e precisão Além dos sinais primários, o indicador Trend Ai identifica pontos de entrada secundários que surgem durante retrações ou retrações, permitindo que os comerciantes capitalizem as correções de preço
SynaptixQuant Dominance Matrix
Devie Arevalo Montemayor
5 (1)
SynaptixQuant Dominance Matrix: Institutional-Grade Market State Extraction Engineered for traders who require a data-driven view of market behaviour beyond surface-level indicators. The Synaptix Quant (SQ) Dominance Matrix is not a conventional currency strength display. Behind its intentionally streamlined interface runs a sophisticated analytical architecture designed to quantify market conditions with precision. Every output is generated through layered signal processing built to identify d
- Real price is 80$ - 45% Discount (It is 45$ now) Contact me for extra bonus   indicator, instruction or any questions! - Lifetime update free - Non-repaint - Related product: Gann Gold EA - I just sell my products in Elif Kaya Profile, any other websites are stolen old versions, So no any new updates or support. Advantages of  M1 Scalper Pro  Profitability: M1 Scalper Pro is highly profitable with a strict exit strategy. Frequent Opportunities: M1 Scalper Pro  takes advantage of numerous smal
IX Power MT5
Daniel Stein
4.92 (12)
IX Power: Descubra informações de mercado para índices, commodities, criptomoedas e forex Visão Geral IX Power é uma ferramenta versátil projetada para analisar a força de índices, commodities, criptomoedas e símbolos de forex. Enquanto o FX Power oferece a máxima precisão para pares de moedas ao utilizar dados de todos os pares disponíveis, o IX Power foca exclusivamente nos dados do mercado do símbolo subjacente. Isso torna o IX Power uma excelente escolha para mercados fora do forex e uma o
Grabber System MT5
Ihor Otkydach
4.81 (21)
Apresento a você um excelente indicador técnico: Grabber, que funciona como uma estratégia de trading “tudo incluído”, pronta para usar. Em um único código estão integradas ferramentas poderosas de análise técnica de mercado, sinais de entrada (setas), funções de alertas e notificações push. Cada comprador deste indicador também recebe gratuitamente: Utilitário Grabber: ferramenta para gerenciamento automático de ordens abertas Vídeo tutorial passo a passo: como instalar, configurar e operar com
Quantum TrendPulse
Bogdan Ion Puscasu
5 (20)
Apresentando   Quantum TrendPulse   , a ferramenta de negociação definitiva que combina o poder do   SuperTrend   ,   RSI   e   Stochastic   em um indicador abrangente para maximizar seu potencial de negociação. Projetado para traders que buscam precisão e eficiência, este indicador ajuda você a identificar tendências de mercado, mudanças de momentum e pontos de entrada e saída ideais com confiança. Principais características: Integração SuperTrend:   siga facilmente a tendência predominante do
ARIPoint
Temirlan Kdyrkhan
1 (1)
ARIPoint is a powerful trading companion designed to generate high-probability entry signals with dynamic TP/SL/DP levels based on volatility. Built-in performance tracking shows win/loss stats, PP1/PP2 hits, and success rates all updated live. Key Features: Buy/Sell signals with adaptive volatility bands Real-time TP/SL/DP levels based on ATR Built-in MA Filter with optional ATR/StdDev volatility Performance stats panel (Success, Profit/Loss, PP1/PP2) Alerts via popup, sound, push, or email Cu
Gartley Hunter Multi
Siarhei Vashchylka
5 (11)
Gartley Hunter Multi - An indicator for searching for harmonic patterns simultaneously on dozens of trading instruments and on all possible timeframes. Manual (Be sure to read before purchasing) | Version for MT4 Advantages 1. Patterns: Gartley, Butterfly, Shark, Crab. Bat, Alternate Bat, Deep Crab, Cypher 2. Simultaneous search for patterns on dozens of trading instruments and on all possible timeframes 3. Search for patterns of all possible sizes. From the smallest to the largest 4. All fou
Weis Wave with Alert MT5
Trade The Volume Waves Single Member P.C.
4.94 (17)
Rental/Lifetime Package Options and Privileges  Rent Monthly Six Months   Yearly/Lifetime Weis Wave with Speed with Alert+Speed Index x x x Manual  x x x Quick Set up Video x x x Blog x x x Lifetime Updates x x x Setup and Training Material x x Discord Access Channel "The SI traders"          x Rectangle Break Alert Tool      x How to trade with it:    http://www.tradethevolumewaves.com   ** If you purchase please contact me to setup your  : Training Room and  complete manual access.  Wei
Antes de tudo, vale ressaltar que esta Ferramenta de Negociação é um Indicador Não Repintante, Não Redesenhante e Não Atrasado, o que a torna ideal para negociação profissional. Curso online, manual do utilizador e demonstração. O Indicador de Conceitos de Ação de Preço Inteligente é uma ferramenta muito poderosa tanto para traders novos quanto experientes. Ele combina mais de 20 indicadores úteis em um único, combinando ideias avançadas de negociação como Análise do Trader do Círculo Interno
MTF Supply Demand Zones MT5
Georgios Kalomoiropoulos
5 (1)
Próxima geração de zonas automatizadas de oferta e demanda. Algoritmo novo e inovador que funciona em qualquer gráfico. Todas as zonas estão sendo criadas dinamicamente de acordo com a ação do preço do mercado. DOIS TIPOS DE ALERTAS --> 1) QUANDO O PREÇO ATINGE UMA ZONA 2) QUANDO UMA NOVA ZONA É FORMADA Você não recebe mais um indicador inútil. Você obtém uma estratégia de negociação completa com resultados comprovados.     Novas características:     Alertas quando o preço atinge a zona d
ACB Breakout Arrows MT5
KEENBASE SOFTWARE SOLUTIONS
5 (1)
O indicador ACB Breakout Arrows fornece um sinal de entrada crucial no mercado ao detectar um padrão especial de rompimento. O indicador escaneia constantemente o gráfico em busca de um momento de consolidação em uma direção e fornece o sinal preciso logo antes do movimento principal. Obtenha o scanner de múltiplos ativos e múltiplos períodos aqui - Scanner para ACB Breakout Arrows MT5 Principais recursos Níveis de Stop Loss e Take Profit são fornecidos pelo indicador. Acompanha um painel Scan
Trend Forecaster
Alexey Minkov
5 (7)
The Trend Forecaster indicator utilizes a unique proprietary algorithm to determine entry points for a breakout trading strategy. The indicator identifies price clusters, analyzes price movement near levels, and provides a signal when the price breaks through a level. The Trend Forecaster indicator is suitable for all financial assets, including currencies (Forex), metals, stocks, indices, and cryptocurrencies. You can also adjust the indicator to work on any time frames, although it is recommen
Trend Flow PRO
Aliaksandr Alferchyk
TREND FLOW PRO ajuda a identificar onde o mercado realmente muda de direção. O indicador destaca reversões de tendência e áreas onde os principais participantes do mercado voltam a entrar. As marcações BOS no gráfico representam mudanças reais de tendência e níveis-chave de timeframes superiores. Os dados do indicador não são redesenhados e permanecem no gráfico após o fechamento de cada candle. Principais elementos do indicador: BOS FLOW – ondas de tendência e mudanças reais de tendência. Repre
Este é sem dúvida o indicador de reconhecimento automático de formação de preço harmônico mais completo que você pode encontrar para a MetaTrader Platform. Ele detecta 19 padrões diferentes, leva as projeções de Fibonacci tão a sério quanto você, exibe a Zona de Reversão Potencial (PRZ) e encontra níveis adequados de stop loss e take-profit. [ Guia de instalação | Guia de atualização | Solução de problemas | FAQ | Todos os produtos ] Detecta 19 formações harmônicas de preços diferentes Traça
Mais do autor
Reverse TradeCopier for Followers can copy trades from an account that is running   Reverse TradeCopier for Source . Features: Copies trades from one source (master) account to multiple following (slave) accounts. Allow investor (read only) password for source (master) account. There are no complicated settings and input parameters, everything is easy. Works with different brokers. Works with different quotes symbols (EURUSD_FX, eurusd_m, etc.). Can copy orders from 4-digit quotes platform to 5-
FREE
If you want something as below: Sell FOREX trading signal. Manage multiple accounts. Follow the trading from somebody. "TradeCopier_follow" and   "TradeCopier_source"   can help you! Features: Copying from one source (master) account to multiple follower (slave) accounts. Allow investor (read only) password for the source (master) account. There are no complicated settings and input parameters, everything is easy. Works with different Brokers. Works with different symbols (EURUSD_FX, eurusd_m, e
FREE
The Synchronized Charts script allows comparing bars of different symbols or different periods of the same symbol. Attach the script to a chart and move bars or change the scale, all opened chart will move synchronously with the current one. The bars on different charts aligned to the border according to their open time. Please be sure the relevant history datas have been downloaded before synchronize charts. 。。。。。。。。。。。。。。。。。。。。。。。。。。。。。。。。。。。。。。。。。。。。。。。。。。
This product is used to check the foreign exchange market history datas. Good quality historical datas is important for traders to perform market analysis or back testing. But the quality of historical datas provided by various foreign exchange brokers is uneven. Sometimes we notice missing k-line sequences, but sometimes it is not easy to detect them. This product helps users locate these missing locations.If there are many gaps in a given period of time on a chart, you need to be careful about
Some trading strategies are suitable for the quiet market with less volatility, while others are suitable for the volatile and violent market. Either way, traders should have a clear measure of how hot or cold the market is. This product is convenient for traders to compare the degree of cold heat of different trading varieties, or the trading heat of the same trading variety in different time periods. You can put it on different charts to get the intuition. It's easy to see which is more hot an
This indicator is used to indicate the difference between the highest and lowest prices of the K line, as well as the difference between the closing price and the opening price, so that traders can visually see the length of the K line. The number above is the difference between High and Low, and the number below is the difference between Close and Open. This indicator provides filtering function, and users can only select K lines that meet the criteria, such as positive line or negative lin
Some traders don't like expose Take Profit/Stop Loss level in their positions, this Expert Advisor can help them. Put it to chart and set Take Profit/Stop Loss pips (0 means ignore), it watch the price of the symbol on chart and close the position if price reach Hidden TP/SL level. It hide user's TP/SL price in effect. Welcome to contact me. 。。。。。。。。。。。。。。。。。。。。。。。。。。。。。
This script allows traders to easily close positions if their profit/loss reaches or exceeds a value specified in pips. The script allows users to easily close positions if their profit/loss reaches or exceeds a value specified in pips. Please set slippage value first. Sometimes some positions do not close due to high volatility of the market. Please set larger slippage or restart the script. ...................................................................................................
Script to Delete Pending Orders Sometimes you placed many Pending Orders and then you want delete certain kind of these orders, this script can help you! Usage: Download and drag and drop this script to the chart. Check "Allow AutoTrading" in "Common" tab and set input parameters in "Inputs" tab. Input Parameters: TypeOfPending: which type Order you would delete. mySymbol: which Symbol you would delete. The input format of the Symbol is such as "EURUSD" or "eurusd".
The script allows to easily watch the date and time of several cities selected by the user from more than 30 important cities all over the world. It also shows GMT, Server time and Local time. The cities on the screen are automatically sorted by the date and time. You can save your setting on the Inputs tab and use them in future. Notice: Daylight saving time is not considered.
Some trading strategies are suitable for the quiet market with less volatility, while others are suitable for the volatile and violent market. Either way, traders should have a clear measure of how hot or cold the market is. This product is convenient for traders to compare the degree of cold heat of different trading varieties, or the trading heat of the same trading variety in different time periods. You can put it on different charts to get the intuition. It's easy to see which is more hot an
Painting Deals
Jinsong Zhang
4.67 (3)
Painting Deals on active chart. It allows analyzing trade history on an account to which you have an investor (read only) password. Type of the arrow displayed indicated the deal type: Right Arrow means In and In/Out deals Arrow Left Left means Out deals. Blue arrows are for Buy deals and Red arrows are for Sell deals. The indicator displays deals in the real time mode, it also displays their Stop Loss and Take Profit levels. Put the mouse over the arrows to see the details of deals including op
The script shows statistics of trades for the specified period. For example, if you want to know the details of trades of the ATC2010 Winner ( bobsley ): Login with his account using the investor (read-only) password (MetaTrader5); Open the chart of his trading symbol (EURUSD); Run this script on the chart; Specify 2010.10.1 in "date from", and the diagram will be shown.
The Synchronized Charts script allows comparing bars of different symbols or different periods of the same symbol. Attach the script to a chart and move bars or change the scale, all opened charts will move synchronously with the current one. The bars on different charts aligned to the border according to their open time. Please be sure the relevant history datas have been downloaded before synchronize charts.
This script allows traders to easily close positions if their profit/loss reaches or exceeds a value specified in pips. The script allows users to easily close positions if their profit/loss reaches or exceeds a value specified in pips. Please set slippage value first. Sometimes some positions do not close due to high volatility of the market. Please set larger slippage or restart the script. ............................................................................................
This script notifies a user about different events by playing sounds, sending emails and text messages to a mobile device. The following events are supported: New deals (in/in out/out). Expiration of Pending orders. The terminal disconnected. The terminal or the script closed. Please set a notification type for each event separately. If you need notifications via Email, please make sure that the settings on the Email tab are correct. If you need to receive notifications on a mobile device, pleas
This script alerts a user via sounds and alert box at the end of a countdown. It is like an alarm clock. There are 2 ways to start counting down: Set a value of remaining minutes. Example: if you need an alert after 1 hour, set it to 60. Set countdown end time. If you like to use a custom sound for the alert, copy your sound files to "terminal_path\Sounds" folder and set the exact file name in the input parameters. The sound file must be in *.wav format.
This product is used to check the foreign exchange market history datas. Good quality historical datas is important for traders to perform market analysis or back testing. But the quality of historical datas provided by various foreign exchange brokers is uneven. Sometimes we notice missing k-line sequences, but sometimes it is not easy to detect them. This product helps users locate these missing locations.If there are many gaps in a given period of time on a chart, you need to be careful about
SmartMA
Jinsong Zhang
This is a trend indicator, as you can see here. When the white line is above the red, it means a bull market. Conversely, the white line below the red line is a bear market. This index is suitable for long - term trading and is suitable for most trading varieties. --------------------------------------------------------------------------------------------
This indicator let user clearly see Buy/Sell signals. When a bar is closed and conditions meet, arrow signal will come up at Close Price, up is Buy and down is Sell. It works on all Timeframes. And you can set sound alert when signals come up.
This indicator is used to compare the relative strength of the trade on the chart against the other several selected symbols. By comparing the price movement of each traded variety based on the same base day, several trend lines of different directions can be seen, reflecting the strong and weak relationship between the several different traded varieties, so that we can have a clearer understanding of the market trend. For example, you can apply this indicator on a EurUSD chart and compare it w
.................................. This script is intended to help users to get information about ticks and spreads (e.g. ticks count, minimum/maximum/average spread). It can export reports in the CSV format with this information. Traders can see spread statistics in real time in the chart window It is useful for comparing spreads of different brokers. --------------------------------------------------------------------------
This is visualization tool based on the Depth of Market. It works with the symbols that have the Depth of Market available. It's a visual indicator that shows the volume of each Bid/Ask price and ratio of total volume of Bids/Asks. Note: check if your broker supports DOM before purchasing. 。。。。。。。。。。。。。。。。。。。。。。。。。。。。。。。。。。。。。。。。。。。。。。。。。。。 。。。。。。。。。。。。。。。。。。。。。。。。。。。。。。。。。。。。。。。。。。。。。。。。。。。
This indicator is used to compare the relative strength of the trade on the chart against the other two selected symbols. By comparing the price movement of each traded variety based on the same base day, three trend lines of different directions can be seen, reflecting the strong and weak relationship between the three different traded varieties, so that we can have a clearer understanding of the market trend. For example, you can apply this indicator on a EurUSD chart and compare it with curre
Most time the market is in a small oscillation amplitude. The Trade Area indicator helps users to recognize that time. There are 5 lines in this indicator: Area_high, Area_middle, Area_Low, SL_high and SL_low. Recommendations: When price is between Area_high and Area_Low, it's time to trade. Buy at Area_Low level and sell at Area_high level. The SL_high and SL_low lines are the levels for Stop Loss. Change the Deviations parameter to adjust SL_high and SL_low.
This indicator is used to indicate the difference between the highest and lowest prices of the K line, as well as the difference between the closing price and the opening price, so that traders can visually see the length of the K line. The number above is the difference between High and Low, and the number below is the difference between Close and Open. This indicator provides filtering function, and users can only select K lines that meet the criteria, such as positive line or negative line.
This script allows you to compare quotes and spreads from different trading servers or brokers to identify a server/broker that offers the best bid/ask price and the tightest spread. It can be compared with up to six different servers or brokers at a time, and it is easy to find the best quote provider by score. Usage: Open up to 6 MetaTrader client terminals, login to different servers/brokers, and then start the script on each terminal's chart.
Rocket Projectile
Jinsong Zhang
1 (1)
This is a multi-currency paired trading system.I won't go into the details of how it works, but what the user needs to care about is how it actually works. It is highly recommended that you download the product and test it thoroughly, including back testing with the historical data and foward testing in the simulated account. As this EA trades multiple currency pairs, relevant historical data will be automatically downloaded at the first time of its historical review, with data volume around 6GB
This tool is used to generate a K - line reflection chart of a currency pair for foreign exchange transactions. For example, if the currency pair is EURUSD, a custom currency pair named EURUSD_ref is generated and a chart for that currency pair is opened. The price of a custom pair of currency is the inverse of the price of the original pair, which is the equivalent of a new pair of currency, the USDEUR. The usage is simple, put it on any chart, the new chart will open, and then draw the corr
It's a self-learning indicator. You need to set a starting time and download the relevant historical data for it to learn. Learn as few rules as possible and give the maximum freedom to the indicators. Therefore, the principle of choosing the best outcome during the learning period does not guarantee that every transaction is profitable. In general, the longer the study, the more reliable the results. In the strategy tester, you need to set the time parameter before the test starts so that the i
Filtro:
AlephTrader
26
AlephTrader 2025.05.30 11:35 
 

He mejorado mi operativa considerablemente con este indicador. Es fantástico. Lo recomiendo un 100%. Muchas gracias MQL5.

BlackArmor
438
BlackArmor 2024.05.20 12:21 
 

Thank you. Very good indicator when combining it with your system.

paulojorgemoura
15
paulojorgemoura 2022.12.23 11:07 
 

muito util. melhores decisões

Adriana Gonzalez
216
Adriana Gonzalez 2022.01.13 13:47 
 

Excelente indicador, muchas gracias!!

Heitor Leal Farnese
229
Heitor Leal Farnese 2021.07.09 03:03 
 

Loved it. It's very nice to be always able to know whether the bands are expanding or contracting.

[Excluído] 2019.11.04 13:36 
 

O usuário não deixou nenhum comentário para sua avaliação

[Excluído] 2019.01.14 07:15 
 

O usuário não deixou nenhum comentário para sua avaliação

Responder ao comentário