Rigorous Market Sessions Chart
- 유틸리티
-
Yu Zhang
 I am a senior practitioner in Fintech industry.
And I have done a lot of academic research on financial markets.
From 2012, I work as a Quant.
Forex, stock and futures are my main trading varieties.
I can use MQL4, MQL5, C++, MySql, and Python. - 버전: 1.4
- 업데이트됨: 26 6월 2022
- 활성화: 20
1. What is this.
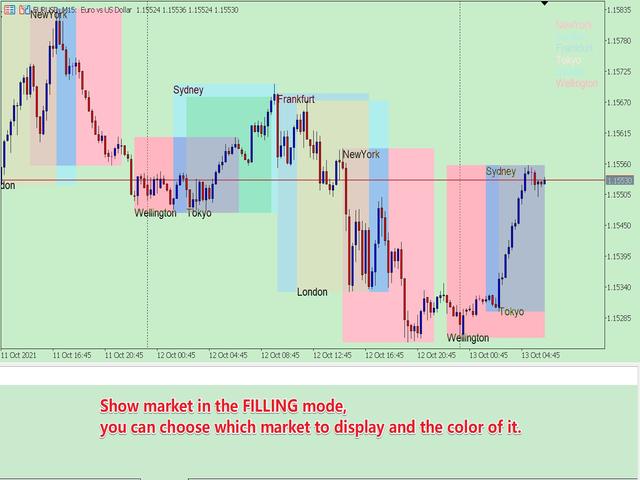
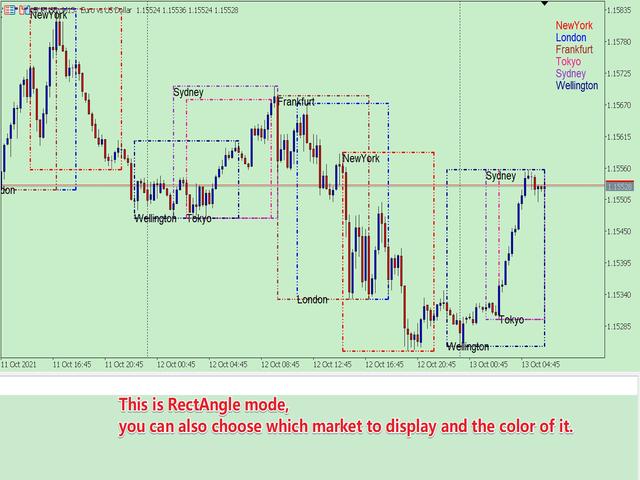
This is a very rigorous indicator to show different market trading sessions. It shows the main markets: NewYork, London, Frankfurt, Sydney, Wellington, Tokyo.
Very important:
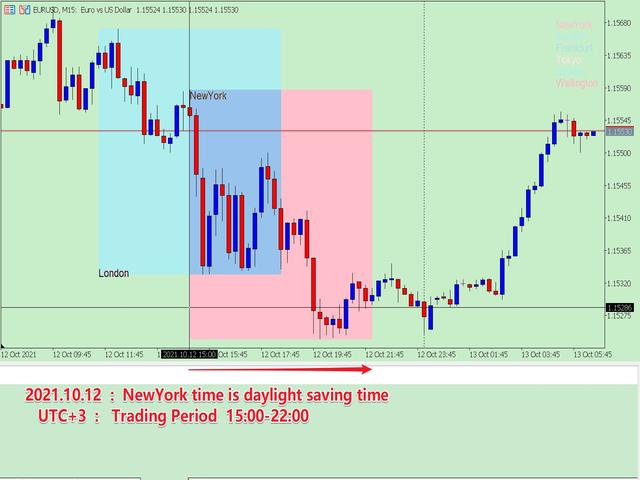
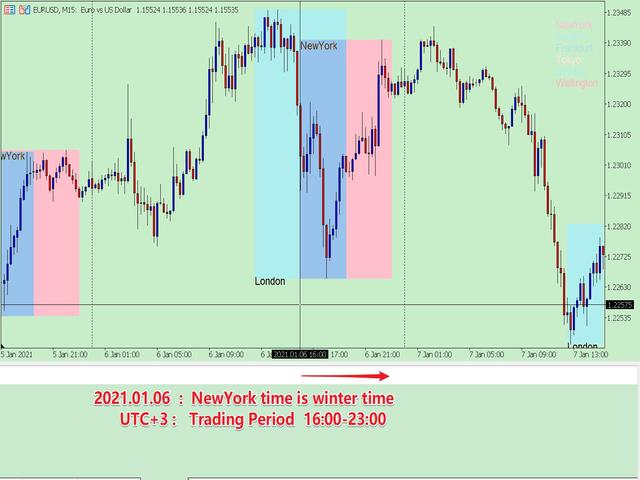
Different markets have different start and end dates for daylight saving time, and the trading session of a market can vary depending on daylight saving time and winter time.
Also, the daylight saving time system is different for countries in the northern hemisphere and southern hemisphere, as well as the system of daylight saving time changes in a market in different years.
For example: New York daylight saving time system:
New York forex market trading session (UTC+3): 15:00-22:00 (daylight saving time); 16:00-23:00 (winter time).
- 1987-2006: 02:00 on the first Sunday in April --> 02:00 on the last Sunday in October
- 2007-present: 02:00 on the second Sunday in March --> 02:00 on the first Sunday in November
Therefore, the trading session must consider the city, the daylight saving time of the year, and the corresponding trading period, otherwise the trading period is wrong. But if these are all set manually, which is very cumbersome, this program can be set automatically.
You can refer to my blog to learn about the daylight saving time system and trading hours of major countries:
DAYLIGHT SAVING TIME RECORDS OF MAJOR COUNTRIES
OPENING AND CLOSING TIME OF MAJOR INTERNATIONAL FOREIGN EXCHANGE MARKETS
2. Program Features
- Automatically determine whether the price is in the daylight saving time of the year;
- According to whether the market is in daylight saving time, automatically determine the trading time period of the market;
- According to the UTC time zone you want, automatically convert the trading time period;
- The historical data is all rigorously matched, so you can get accurate historical market trading sessions, which is convenient for your research.
- With multiple display modes, you can always find a solution that suits you.
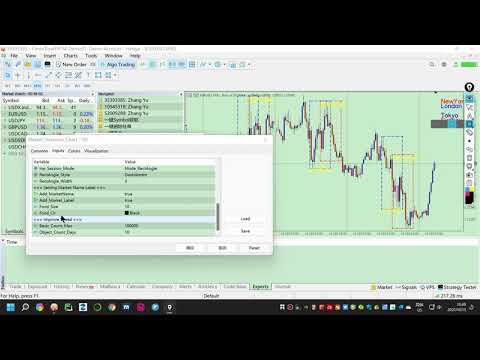
3. How to use (chart window mode)
The parameters are expressed in groups, which are very easy to understand. The following describes each parameter group:
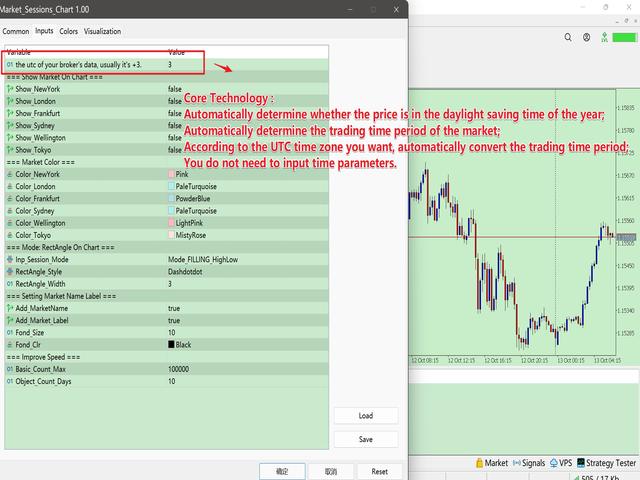
- bool_BrokerAuto = true; // Whether the broker automatically adjusts the time zone, usually True.
- Inp_utc = 3; // if the above is true, summer utc; if false summer or winter utc.
- group "=== Show Market On Chart ===" : The parameter in the group is to choose whether to display the corresponding market, which is the general control key for a single market.
- Show_NewYork = true;
- Show_London = true;
- Show_Frankfurt = true;
- Show_Sydney = true;
- Show_Wellington = true;
- Show_Tokyo = true;
- group "=== Market Color ===" : The parameters in the group are to set the color of each market
- Color_NewYork = clrRed;
- Color_London = clrRoyalBlue;
- Color_Frankfurt = clrGreen;
- Color_Sydney = clrSilver;
- Color_Wellington = clrDeepSkyBlue;
- Color_Tokyo = clrSlateGray;
- group "=== Mode: RectAngle On Chart ===" : Market Sessions display mode
- Inp_Sessions_Mode = Mode_FILLING_HighLow;
- // Mode_FILLING_HighLow---Fill mode with color, Mode_RectAngle--- RectAngle mode
- RectAngle_Style = STYLE_DASHDOTDOT;
- // Set the type of box in Mode_RectAngle mode
- RectAngle_Width = 3;
- // The width of the RectAngle , according to the limitations of MT5, only STYLE_SOLID, STYLE_DASHDOTDOT types can be greater than 1.
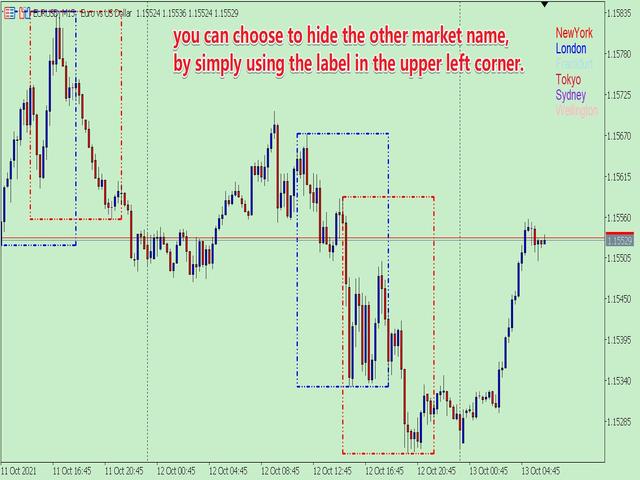
- group "=== Setting Market Name Label ===" : The parameter setting in the group displays the market name
- Add_MarketName= true; // Whether to add the market name in the main window
- Add_Market_Label = true; // Whether to display the market name in the upper right corner of the main window
- Fond_Size = 10; // Text size
- Fond_Clr = clrBlack; // Text color
- group "=== Improve Speed ===" : The parameters in the group are used to set the number of calculations. When studying historical data, you can set a larger one; for real-time trading, you can set a smaller one.
- Basic_Count_Max = 100000; // The basic number of data, this can be set very large.
- Object_Count_Days = 5; // The number of boxes and name tags in units of days.
4. Others
Due to the limitations of MT5, I had to write the program in two forms.
One is the sub-window mode; the other is the chart window mode. The two modes are different, there is always one that suits you. The current page is the chart window mode.