Directional Key To Change Symbols and TimeFrames
- 유틸리티
-
Yu Zhang
 I am a senior practitioner in Fintech industry.
And I have done a lot of academic research on financial markets.
From 2012, I work as a Quant.
Forex, stock and futures are my main trading varieties.
I can use MQL4, MQL5, C++, MySql, and Python. - 버전: 1.6
- 업데이트됨: 6 6월 2020
- 활성화: 20
Do you think it's a bit cumbersome when you need to switch symbols or timeframes with mouse click?
1. What is this?
This is a program that can switch symbols and timeframes with direction keys.
- Fast switching, very convenient, no mouse click required.
- For traders, one symbol with multi-timeframe charts are usually added, you can change symbol on those charts easily.
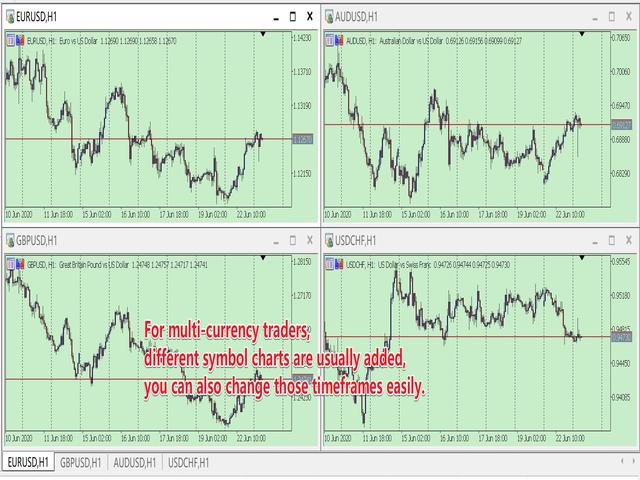
- For multi-currency traders, different symbol charts are usually added, you can also change those timeframes easily.
I wrote this program in the form of indicator. So you can load other EAs, indicators or run other scripts.
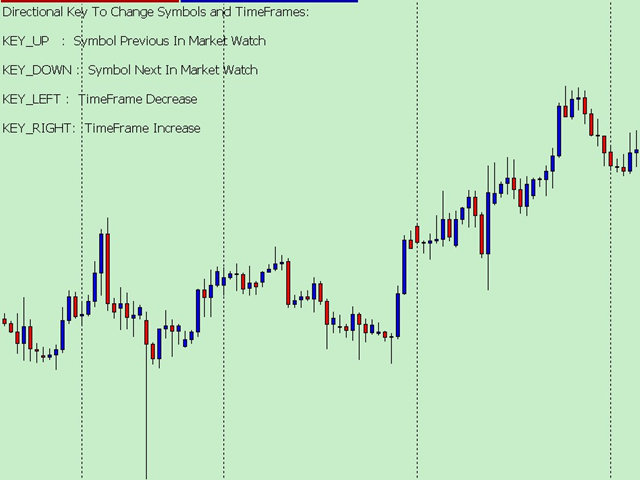
2. How to use it
When you load the program:
- The direction key UP is to switch to the previous symbol in market watch.
- PS: When the chart is the first symbol, Key UP will switch to the last symbol.
- The direction key DOWN is to switch to the next symbol in market watch.
- PS: When the chart is the last symbol, Key DOWN will switch to the first symbol.
- The direction key LEFT is to decrease the timeframes.
- PS: When the timeframe is M1, Key LEFT will switch to the MN1 timeframe.
- The direction key RIGHT is the increase time frame.
- PS: When the timeframe is MN1, Key RIGHT will switch to the M1 timeframe.
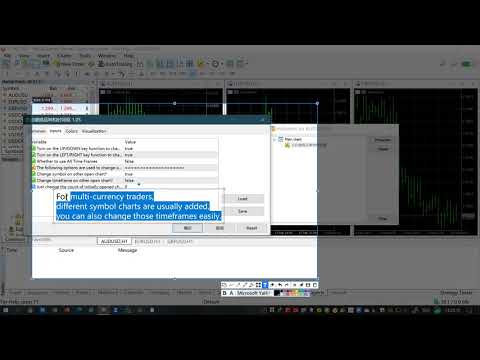
3. Parameters:
- bool TurnOn_UpDown=true; // Turn on the UP/DOWN key function to change Symbol.
- bool TurnOn_LeftRight=true; // Turn on the LEFT/RIGHT key function to change TimeFrame.
- bool AllTimeFrames=false; // Whether to use All Time Frames
=====The following options are used to change other open charts:
PS: I must tell you, when switching between multi charts, the system will download the data, If your system doesn't have data, it will download the data and sometime will cause slowdowns. That is the limited of MT5/MT4 client. When you don't have enough data, don't use the keyboard too quickly.
- bool OtherOpenChart_Symbol = false; // Change symbol on other open chart?
- bool OtherOpenChart_TimeFrame = false; // Change timeframe on other open chart?
- int PermitCount = 0; // Just change the count of initially opened chart. 0 means all.
- PS: when you want to change other charts, but not all the open charts. you can change the num.
The link is MT4 version: https://www.mql5.com/en/market/product/43106

사용자가 평가에 대한 코멘트를 남기지 않았습니다