Rigorous Market Sessions Chart
- 实用工具
- 版本: 1.4
- 更新: 26 六月 2022
- 激活: 20

1. 这是什么.
这是一个非常严谨的以展示不同市场交易时段的指标。它展示了主要市场:NewYork, London, Frankfurt, Sydney, Wellington, Tokyo.
非常重要:
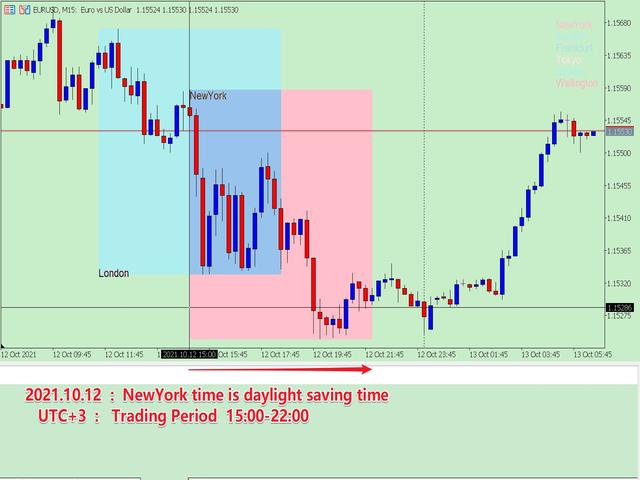
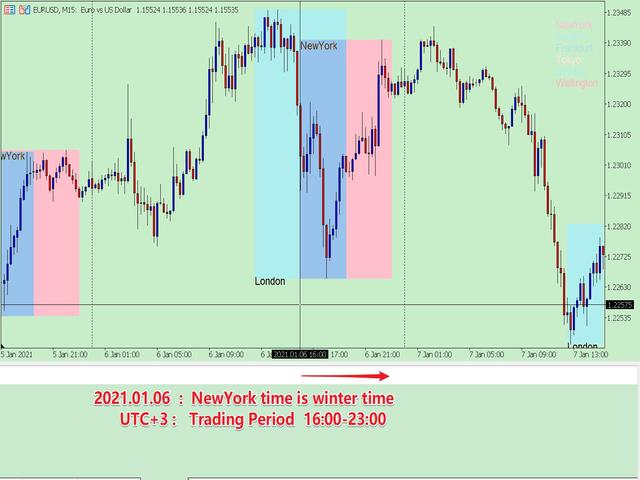
不同的市场夏令时起止日期不同,而一个市场的交易时段又会因夏令时冬令时而不同。
同时,北半球国家、南半球国家夏令时制度也是不同的,以及一个市场在不同的年份,夏令时的制度也是变化的。
比如:纽约夏令时制度:
纽约外汇市场交易时段(UTC+3): 15:00-22:00(夏令时); 16:00-23:00(冬令时)。
- 1987年-2006年:4月第一个星期日02:00 --> 10月最后一个星期日02:00
- 2007年-至今: 3月的第二个星期日02:00 --> 11月的第一个星期日02:00
所以交易时段,必须要考虑历史上所在城市、所处年份的夏令时日期、以及对应的交易时段,否则交易时段是错误的。但是如果这些都是手工设置,非常的繁琐,本程序就可以自动设置。
你可以参阅我的博客了解主要国家的夏令时制度以及交易时段:
DAYLIGHT SAVING TIME RECORDS OF MAJOR COUNTRIES
OPENING AND CLOSING TIME OF MAJOR INTERNATIONAL FOREIGN EXCHANGE MARKETS
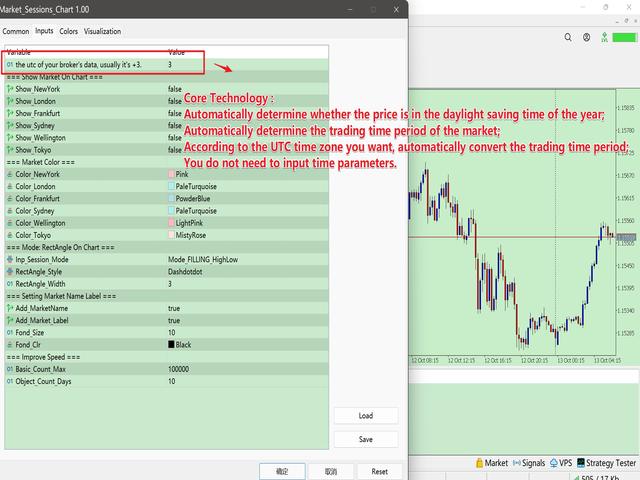
2. 程序特色
- 自动判断价格的时间是否处在当年的夏令时中;
- 根据市场是否处于夏令时,自动判断市场的交易时间段;
- 根据你希望的UTC时区,自动转换交易时间段;
- 历史数据全部进行了严谨的匹配,所以你可以得到准确的历史上的市场交易时段,这便于你进行研究。
- 多种展示模式,你总能够找到适合你自己的方案。
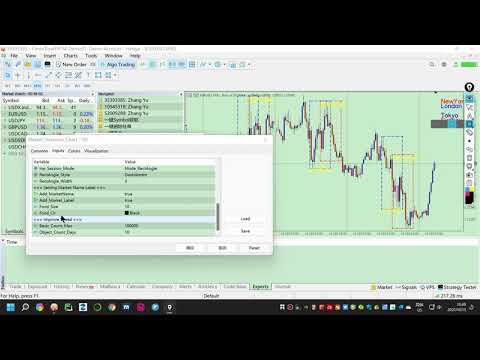
3. 如何使用(主窗口模式)
参数以分组的形式表示,它非常容易理解,下面介绍下各个参数组:
- the utc of your broker's data, usually it's +3.
- group "=== Show Market On Chart ===" : 组内的参数为选择是否显示对应的市场,这是单个市场的总控制键。
- Show_NewYork = true;
- Show_London = true;
- Show_Frankfurt = true;
- Show_Sydney = true;
- Show_Wellington = true;
- Show_Tokyo = true;
- group "=== Market Color ===" : 组内的参数为设置各个市场的颜色
- Color_NewYork = clrRed;
- Color_London = clrRoyalBlue;
- Color_Frankfurt = clrGreen;
- Color_Sydney = clrSilver;
- Color_Wellington = clrDeepSkyBlue;
- Color_Tokyo = clrSlateGray;
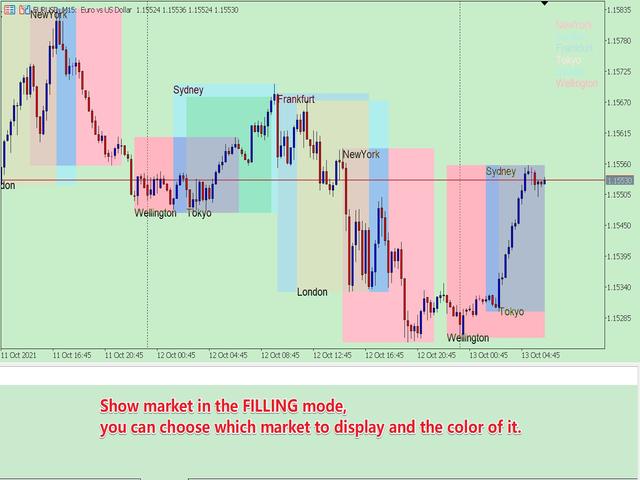
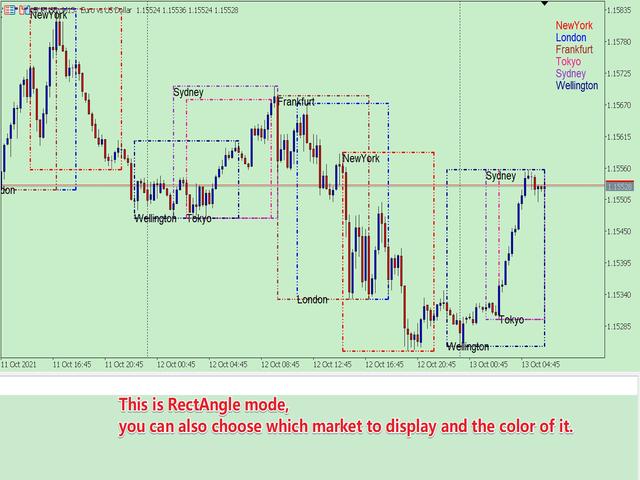
- group "=== Mode: RectAngle On Chart ===" : 市场时段显示模式
- Inp_Sessions_Mode = Mode_FILLING_HighLow; // Mode_FILLING_HighLow---以颜色填充模式, Mode_RectAngle---方框模式
- RectAngle_Style = STYLE_DASHDOTDOT; // Mode_RectAngle模式下设置方框的类型
- RectAngle_Width = 3; // 方框的宽度,根据MT5的限制,只有 STYLE_SOLID、STYLE_DASHDOTDOT 类型才可以大于1.
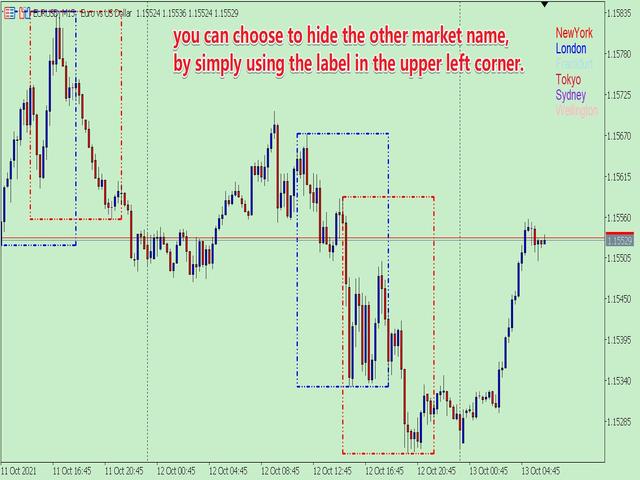
- group "=== Setting Market Name Label ===" : 组内的参数设定是否显示市场名称
- Add_MarketName= true; // 是否在主窗口添加市场名称
- Add_Market_Label = true; // 是否在主窗口右上角显示市场名称
- Fond_Size = 10; // 文字的大小
- Fond_Clr = clrBlack; // 文字的颜色
- group "=== Improve Speed ===" : 组内的参数用于设定计算的数量。在研究历史数据时,可以设置大一点;在实时交易时,可以设置小一点。
- Basic_Count_Max = 100000; // 基本的数据数量,这个可以设置的很大。
- Object_Count_Days = 5; // 以日为单位,方框、名称标签的数量。
4. 其他
由于MT5的限制,我不得不把程序写成两种形式。