Multi Chart Synchronization OthersToFirstChart

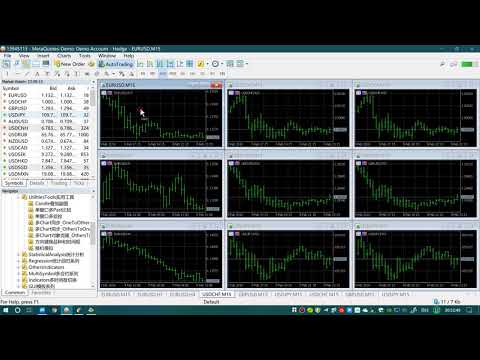
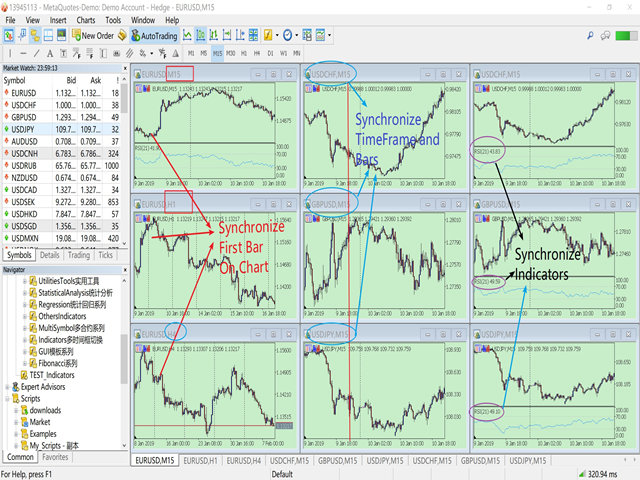
This product can be used to synchronize multiple Charts, and each Chart can be set to a different sync mode. With this product you can better view and manipulate charts: different time frames for a single Symbol, the same time frame for multiple Symbols, system indicators for single/multiple Symbols... and more.


Feature:

  • Chart settings can be synchronized, including : background, indentation, size, etc.
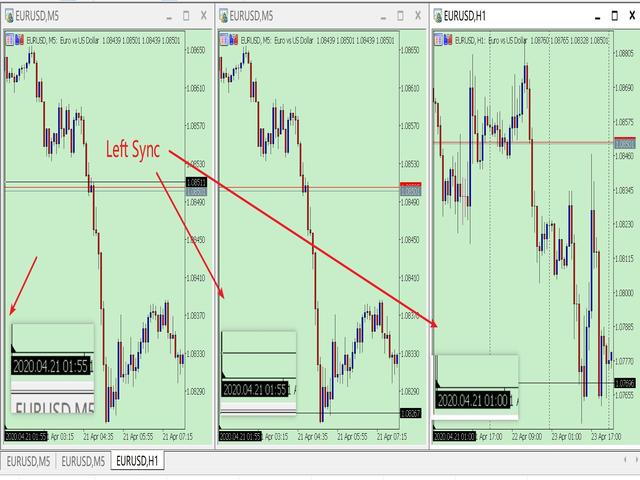
  • Multiple Chart window start times or end times can be synchronized.
  • Multiple Chart time frames can be synchronized.
  • Multiple Chart System Indicators can be synchronized.
  • Multiple Chart Custom Indicators can be synchronized.
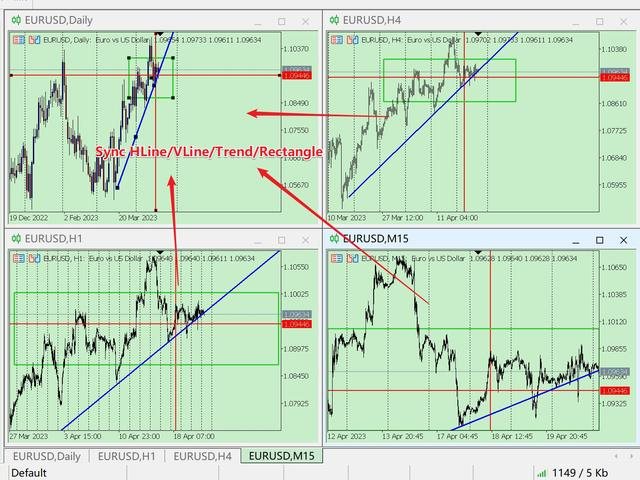
  • Multiple Chart HLine/VLine/Trend/Rectangle can be synchronized.
  • MT5 can only run one EA/Script for a Chart. This product is compiled in the form of Indicator and does not affect the superposition of other EAs/Scripts.
How To Use:
  • Your first open Chart is your operation Chart,  you need to load the program into other Charts,  please do not load this program into your operation Chart.
  • " Your first open Chart " means :  When your Chart is empty,  Your first open Symbol Chart. (Sometimes you open a lot of Symbol charts, and you dragged the Chart in the Chart List, which causes your leftmost chart is not your first.)
Parameter:
  • IsChartSynchronize=true;              // Whether to synchronize chart settings of Chart, including window start time.
  • IsTimeFrameSynchronize=true;     // Whether to synchronize the timeframe of the Chart
  • IsSysIndicatorsSynchronize=true;  // Whether to synchronize the system Indicators of Chart
  • IsCustomIndiSyn = false;               //Whether To Synchronize Custom Indicators.
  • SynRefreshMillisecond=100;          // Set the millisecond frequency of synchronization
  • IsLockShift=true;                          // Is Lock Chart Start_Times And ChartScale
    • ---true  : the default setting just like previous version. 
      ---false : after synchronize to the first chart, you can drag your other charts, and change ChartScale. If you operate the first chart again, Sync again. 
    • This feature makes synchronization flexible, You can also operate other charts while retaining the sync function. 

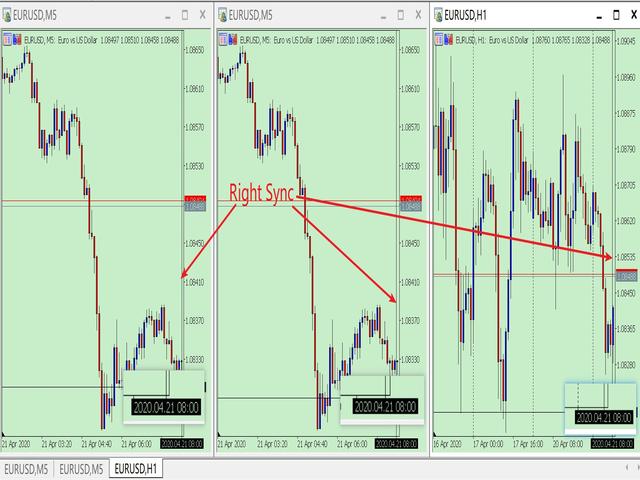
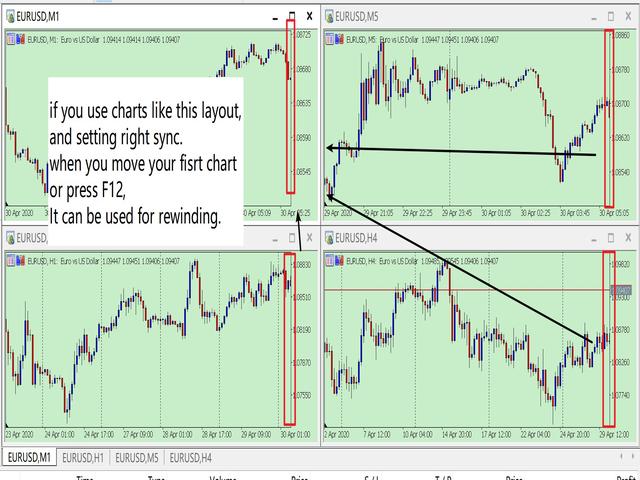
  • LeftSyn=true; //true: left synchronized / false: right synchronized
    • If you setting right sync, this function can be used for rewinding.
  • SynObject = false; // Whether to Syn HLine/VLine/Trend/Rectangle

Synchronize custom indicators should pay attention:
1. Custom indicators are based on the programming ability of the provider. 
2. Synchronization of custom indicators is identified by name. And ex5 file must be placed in the Indicators folder.
3. If you want to synchronize different parameters of the same custom indicator, the custom indicator must use the IndicatorSetString() code to set the indicator name with different parameters.
    for example: SMA(5), SMA(10) is different parameters with same indicator. But some code only named them SMA.
4. If the provider does not set the indicator name with parameters through IndicatorSetString(), custom indicators with the same name cannot be superimposed. However, it does not affect the synchronization once.


New Function:

Now add the function to synchronize HLine/VLine/Trend/Rectangle.  You can see the video link: https://youtu.be/A_3CWyrg3c0


Thanks for using my program.

PS: In my experience, sometimes the Symbol have no data, the MT5 will download the data from the server,  which will lead to slowness. I recommend you my another software,  it will help to download data to your system

https://www.mql5.com/en/market/product/35688


추천 제품
25R - WASD Order is a visual risk management EA for MetaTrader 5 that combines gaming-style WASD keyboard controls with interactive chart drawing for precise order placement. Designed for active traders who value speed and accuracy, it lets you visually plan trades by dragging entry and stop-loss lines directly on the chart, while automatically calculating position size based on your risk percentage. The tool displays color-coded profit/loss zones with real-time risk metrics, supports automatic
Object Synchronizer MT5 : Better focus/analysis of the price chart in many timeframes. Are you bored to save and load template many times for the same symbol for many chart timeframes? Here is the alternative. With this indicator, you enjoy creating objects across many charts, you can modify the same object in any chart, you can delete the same object in any chart. All objects you created/modified are always synchronized across all chart windows (with the same symbol). Save your time, you can fo
Telegram to mt5 pro
Janet Abu Khalil
4 (4)
Telegram to MT5 Pro — Advanced Telegram Signal Copier with Auto-Fix, Multi-TP, Risk Control and Full Trade Management Telegram to MT5 Pro — 전문 텔레그램 신호 복사기 Telegram to MT5 Pro는 텔레그램 신호를 MetaTrader 5 계정으로 자동으로 직접 실행하는 고성능 트레이드 복사기로, 리스크, 실행, 트레이드 관리에 대한 완전한 제어를 제공합니다. 이 시스템은 두 가지 구성 요소로 이루어져 있습니다: • MetaTrader 5 내부에서 실행되는 Expert Advisor (EA) • 텔레그램에 연결되어 신호를 로컬로 EA에 전송하는 데스크톱 브리지 애플리케이션 두 구성 요소는 동일한 컴퓨터에서 실행되어야 합니다. MQL5 플랫폼 제한으로 인해 EA는 텔레그램에 직접 연결할 수 없습니다. 브리지는 텔레그램을 처리하고 EA는 거래를 실행합니다. 지원 및 설치
The script allows to easily watch the date and time of several cities selected by the user from more than 30 important cities all over the world. It also shows GMT, Server time and Local time. The cities on the screen are automatically sorted by the date and time. You can save your setting on the Inputs tab and use them in future. Notice: Daylight saving time is not considered.
Martingale panel MT5
Mohammadbagher Ramezan Akbari
In this article, we would like to introduce the trade panel product with the Martingale panel. This panel is made in such a way that it can meet the needs of traders to a great extent. This trade panel actually consists of two trade panels at the same time, with the first one you can take positions with certain profit and loss limits, and with the second one, you can have positions with profit limits but without loss limits. When positions lose, a new position will be added based on the settings
이 EA는 주로 XAUUSD 스캘핑에 사용됩니다. 목적   거래 관리에서 감정을 제거 — 포지션을 자동으로 보호하고 이익을 실현함으로써 당신이 압박 속에서 어려운 결정을 내릴 필요가 없게 합니다. 기능   ️ 자동 손절 (Stop Loss)   최근 고점/저점 + 버퍼를 기반으로 SL 설정   수동 배치 스트레스 없음   자동 부분 이익 실현   두 가지 모드:   고정 이동: 가격이 X만큼 움직이면 50% 청산   R-비율: 1.2R 이익 목표 시 50% 청산   승자(이익나는 포지션)를 남기면서 수익을 확보합니다.    ️ 원클릭 버튼   모두 닫기 매도 / 매수 / 이익 / 전체   선택사항: 시간별 필터 (최근 60분)   일반적인 문제 해결   이익을 너무 빨리 취함   신경질적으로 스톱 이동   감정적 의사결정   일관성 없는 리스크 관리   ️ 핵심 설정   Lookback: 20분 (SL 배치용)   버퍼: 추가 안전용 0.2 핍  
Ping
Vagif Shabanov
Ping: 안정적인 거래를 위한 필수 도구 인터넷 제공업체와 VPS는 안정적인 연결을 약속하지만, 과연 이들을 신뢰할 수 있을까요? 1밀리초가 중요한 세계에서 느리거나 불안정한 연결은 수익 손실이나 손실로 이어질 수 있습니다. Ping 스크립트는 다음을 가능하게 합니다. 정보에 입각한 결정: 다양한 VPS 서버와 브로커의 속도를 시각적으로 비교하여, 전략에 가장 빠르고 안정적인 연결을 선택할 수 있습니다. 위험 제거: 주문 실행 속도가 결과에 직접적인 영향을 미치는 스캘퍼 및 고빈도 트레이더에게 특히 유용합니다. 문제 식별: 인터넷이나 VPS가 언제 문제를 일으키는지 신속하게 감지하고, 거래에 영향을 미치기 전에 대응할 수 있습니다. 타협 없는 작업: 저희 스크립트는 다른 전문가 고문과 충돌하지 않고 모든 차트 및 시간 프레임에서 작동합니다. 최대한 편리하고 눈에 띄지 않도록 설계되었습니다. Ping 스크립트는 MetaTrader 5 터미널을 위해 특별히 개발된, 개인용 연결 속도
Эксперт собирает данные из биржевого стакана, суммируя отложенные ордера на покупку или продажу. Далее, по сумме ордеров определяется общее направление, куда смотрят участники рынка. Если суммарные покупки/продажи превышают определенный коэффициент, то производится сигнал. Настройки: Timer=5 // указывается как часто обновлять данные по рынку в секундах. Чаще чем раз в 10 секунд ставить не рекомендуется. X-size =700 // размер окна по оси Х. Y-size=650// размер окна по оси Y. Only "Market Watch"?=
SymbolSync Pro – Instant Chart Symbol Synchronization for MT5 Tired of manually changing symbols on multiple charts? SymbolSync Pro automatically synchronizes symbols between charts in MetaTrader 5. Change the symbol on your master chart — all connected charts update instantly. Features: Real-time symbol synchronization Master/Slave mode Lightweight & ultra-fast No visual clutter (invisible indicator) Works across all chart timeframes Safe file-based communication Perfect For: Multi-chart tr
Elevate your trading control with Smart Risk and Equity Dashboard MT5 , an intelligent assistant designed for real-time risk management and account monitoring. More than just displaying numbers, this tool empowers your decision-making with advanced simulation features. Key Features: - Real-Time Account Status: Monitor Balance, Equity, Projected Equity, and Margin Health Bar in one elegant, professional panel. - ️ Risk & Profit Tracker: Automatically tracks your Profits (Daily, Weekly, To
CloseByTimeEA
Aleksandr Vasiutin
CloseByTime Utility is a MetaTrader 5 service utility designed to automatically close open positions and delete pending orders at a specified time. It helps traders schedule the end of trading activity in advance, for example at the end of the day, before news releases, or before market close. The utility uses broker server time, supports weekday filtering, and can work with all symbols or only with a selected list of instruments. Features Automatically closes open positions at a specified time.
RiskRider Pro
Stephane Paul Heritier
RiskRider Pro is a professional manual trading panel for MetaTrader 5. It puts every essential risk management tool at your fingertips without interrupting your chart analysis. KEY FEATURES One-click BUY / SELL Instant market execution with automatic stop-loss calculation. No confirmation dialogs, no delays. Risk:Reward Take Profit Define your R:R ratio once (default 2.0). The take-profit level is calculated automatically on every trade based on your stop-loss distance. Dynamic Lot Sizing W
It mesures the lot size based on the points measured by clicking with the MIDDLE MOUSE BUTTON then CLICK and DRAG , previous that configure the indicator based on the risk you accept; The risk can be % based on fixed account, actual account size, and fix capital risk; If the INDICATOR DOESN'T WORK propperly try after configuring it CHANGE the TIMEFRAME and GET BACK to the PREVIOUS timeframe, SOMETIMES  this FIX IT
TradeConsole
Musera Isaac
5 (1)
TradeConsole — On-Chart Trading Dashboard with Smart Alerts TradeConsole is a lightweight on-chart utility designed to help traders keep essential market context in one place. It combines session tracking, an upcoming economic news panel, a currency strength view, a quick technical bias summary, trade statistics, and one-click control tools. The purpose of the dashboard is to improve chart awareness, reduce screen clutter, and support faster decision-making during live trading. Main Features On
FREE
Draw price ranges with automatic percentage calculations, customizable visuals, and smart label positioning. Easy to use with intuitive controls - just click and analyze! Key Features ️ Intuitive Drawing Interface One-Click Activation : Simply click the "Draw Price Range" button to start Visual Guide Line : Yellow dashed line helps you position points accurately Two-Point Drawing : Click Point A and click Point B - it's that simple! Real-Time Preview : See your range before finalizing Aut
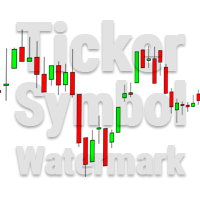
This utility tool draws the ticker symbol and timeframe information as a watermark in the background of the chart. It may come in handy if you have multiple charts on the screen at the same time. Inputs: Font Name:  You can change text font by typing in the name of your favorite font installed on your operating system. (e.g.: Verdana, Palatino Linotype, Roboto, etc...)   Font Color: You can choose your favorite from the available colors or type in a custom RGB color (values from 0 to 255, e.g.:
ENGLISH DESCRIPTION (MQL5 Standard Optimized) Product Name: Telegram WolfSignal V3.50 (MT5) [Subtitle: Smart Async Queue | Multi-Channel Broadcaster | Remote Command Hub] Introduction: The Apex of Telegram Integration Telegram WolfSignal V3.50 is not just a notification script; it is a Master Asynchronous Broadcaster . Built specifically for high-frequency trading (HFT) accounts, prop-firm managers, and elite signal providers, this version completely eradicates the flaws of traditional Telegram
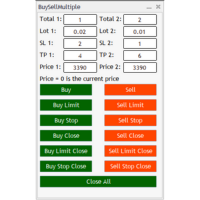
Buy Sell Multiple Panel - Execute Bulk Orders in a Single Click! Description Save time and seize market opportunities instantly. This powerful panel allows you to place multiple buy or sell orders simultaneously, each with custom lot sizes, take-profit, and stop-loss levels. Perfect for sophisticated entry strategies and managing complex trades efficiently. Key Features Bulk Order Execution: Open multiple market orders at once with just one click. Flexible Lot Sizing: Set individual lot sizes f
현재 심볼의 포지션 닫기 현재 심볼의 모든 포지션을 닫는 간단하고 신뢰할 수 있는 스크립트입니다. 반복 작업을 줄이고 소중한 시간을 절약하세요. 장점: 현재 자산에만 집중: 스크립트는 선택한 심볼의 거래만 닫으며, 다른 포지션에는 영향을 미치지 않습니다. 빠르고 편리함: 단 한 번 실행으로 모든 포지션을 몇 초 안에 닫을 수 있습니다. 모든 전략에 적합: 여러 포지션을 관리하는 사람과 단일 자산에 집중하는 사람 모두에게 이상적입니다. 안전성: 각 포지션을 처리하고 오류를 기록하여 완전한 제어를 보장합니다. 작동 원리: MetaTrader 5 터미널에서 스크립트를 실행하세요. 스크립트가 현재 심볼의 모든 오픈 포지션을 자동으로 찾습니다. 다른 자산에는 영향을 주지 않고 모든 거래를 한 번의 클릭으로 닫습니다. 이 도구는 누구에게 적합합니까? 단일 심볼의 포지션을 빠르게 닫아야 하는 트레이더. 단기 전략을 사용하는 사용자 및 속도를 중시하는 사람들. 시간을 절약하고 중요한 결정에 집중하
FREE
You can: observe the price chart inside the chart of a different price evaluate correlation and relationships observe the difference in charts in the form of a histogram Opportunities: "Auto" mode - auto-adjust the chart for another chart "multiplier" - you can multiply the chart by any number shift up / down the chart by value shift the chart to the left "invert" - mirror flip of the chart Important: only charts added to MarketWatch are used Version for MetaTrader 4 -  https://www.mql5.com/e
Close All Pro MT5 – Fast PnL Control is a powerful trade manager MT5 utility that gives you total control over your trades. With a single click, you can close all MT5 orders, monitor real-time profit and loss, and manage your floating PnL directly from a clean on-chart panel. The tool is lightweight, responsive, and built to help traders save time, reduce emotional stress, and maintain focus. Whether you trade manually or through an EA, this MT5 profit panel provides the visibility and precisio
Atlas Trade Desk
Bernhard Wurzlbauer
Atlas Trade Desk MT5 Atlas Trade Desk MT5 is a visual trade panel, risk manager and lot calculator for manual MetaTrader 5 traders. Plan market and pending orders directly on the chart, calculate position size from your selected risk, adjust Entry, Stop Loss and Take Profit visually, and manage open positions from one clean dashboard. The tool is built for discretionary traders who want faster order preparation, clearer risk control and safer position management without switching between multipl
Time Line for MT5 機能: 昨日高値、安値、本日始値、高値、安値の時間から線を引きます。 時間足により表示する時間が変わります。 1分、5分足では1時間ごとの表示 15分、30分足では4時間ごとの表示 1時間、4時間は12時間ごとの表示 日足以降は時間は表示されません。 高値安値は週足より下位足で表示されます。 各ラベルを変更可能になります。 更新頻度を変更できるのでチャート表示が 重くなることはありません。 各パラメータの説明: Server_Time:6 サーバとの時間差を入力 Yesterday_High_Label:昨日高値 Yesterday_Low_Label:昨日安値 Show_Open:true 始値の線を表示するかどうか Today_Open_Label:本日始値 Today_High_Label:本日高値 Today_Low_Label:本日安値 max_bar:true 使用するバーを制限するかどうか Maxbars:1500 制限を使用した場合に1分では5日分 UpdateFrequency:60 更新頻度、ディフォルトは60秒ご
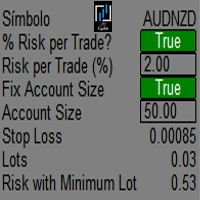
This tool will help you calculate position size based on the lines that you draw on the chart. It will automatically create the trading setup in the background and provide adaptive buttons for market and pending order confirmation. The design is very simple and straightforward, with just a single click you will be able to place the trading setup. Features Set your risk based on your predefined amount or percent of your account balance. Drag the lines to define the entry, take profit target and s
# TradeRoad Risk Panel Advanced TradeRoad Risk Panel Advanced is a MetaTrader 5 utility panel designed to help traders prepare and monitor their risk before and during a trading session. It does not open trades automatically, does not provide trading signals, and does not promise results. Its purpose is simple: make risk, drawdown and trading discipline easier to read directly on your MT5 chart. ## Main features - Position size / lot calculation based on planned risk - Risk amount and risk
Kronos is a multi-timer that displays local time, server time and the countdown of the current period. The programme is multilingual, with a choice of English, Italian and Spanish Language selectables in input. Available in four colours and with the choise of five types of font to be used. Like any other programme we have created, the graphic interface is developed to be non-invasive and intuitive. At start-up, the three windows that make up the graphic interface of Kronos are closed on the left
Overview Partial Trailing Stop EA is an advanced trade management Expert Advisor for MetaTrader 5 that automatically locks in profits by performing partial position closures when price retraces from its maximum favorable movement (peak profit level) . Unlike a traditional trailing stop that closes the entire position, this EA allows you to scale out gradually. When the market moves in your favor, the EA continuously tracks the highest (for Buy trades) or lowest (for Sell trades) price reached. I
Expert TP SL v04 - Professional Trading Assistant with AI Motivation System Advanced manual trading tool with automatic risk management, overtrading protection, and intelligent psychological support for disciplined trading. PRODUCT OVERVIEW Expert TP SL v04 is a comprehensive trading assistant designed for manual traders who want to maintain emotional discipline while automating risk calculations. This isn't just another order placement tool - it's a complete trading psychology system that pr
Trade Manager DashPlus
Henry Lyubomir Wallace
4.85 (13)
DashPlus 는 MetaTrader 5 플랫폼에서 거래 효율성과 효과를 향상시키기 위해 설계된 고급 거래 관리 도구입니다. 리스크 계산, 주문 관리, 고급 그리드 시스템, 차트 기반 도구 및 성과 분석 등 포괄적인 기능을 제공합니다. 주요 기능 1. 리커버리 그리드 불리한 시장 상황에서 거래를 관리하기 위한 평균화 및 유연한 그리드 시스템을 구현합니다. 거래 회복을 최적화할 수 있도록 전략적인 진입 및 종료 포인트를 제공합니다. 2. 스택 그리드 강한 시장 움직임 동안 포지션을 추가하여 유리한 거래에서 잠재적 수익을 극대화하도록 설계되었습니다. 유리한 시장 트렌드에서 승률을 높이며 거래를 확장할 수 있도록 합니다. 3. 손익(P&L) 라인 차트에서 잠재적인 수익 및 손실 시나리오를 시각적으로 표현합니다. 설정을 조정하고 P&L 라인을 드래그하여 실행 전에 다양한 거래 결과를 평가할 수 있습니다. 4. 바스켓 모드 동일한 심볼에 여러 포지션을 단일 집계 포지션으로 결합하여 관리합니
MARB Trader
Siyabonga Sandile Khanyile
This tool allows you to catch possible entries from the M.A.R.B indicator by entering the trades at a click of a button(use link for details on M.A.R.B * https://www.mql5.com/en/market/product/96635 *).M.A.R.B Trader shows a maximum of 4 different possible trades all with different Take profits and different Risk to Reward ratios and you can choose from one by clicking a button.M.A.R.B Trader also allows you to enter Buy stop,Sell stop and Market trades using buttons.
이 제품의 구매자들이 또한 구매함
Trade Assistant MT5
Evgeniy Kravchenko
4.43 (214)
거래당 위험 계산, 라인을 사용한 손쉬운 신규 주문, 부분 청산 기능을 통한 주문 관리, 7가지 유형의 트레일링 스탑 및 기타 유용한 기능을 제공합니다. 추가 자료 및 지침 설치 지침   -   애플리케이션 지침   -   데모 계정용 애플리케이션 평가판 라인 기능       - 차트에 개시선, 손절매, 차익실현을 표시합니다. 이 기능을 사용하면 새로운 주문을 쉽게 하고 개봉 전에 추가 특성을 볼 수 있습니다. 위기 관리       -       위험 계산 기능은 설정된 위험과 손절매 주문의 크기를 고려하여 새 주문의 볼륨을 계산합니다. 이를 통해 손절매 크기를 설정하고 동시에 설정된 위험을 존중할 수 있습니다. 로트 계산 버튼 - 위험 계산을 활성화/비활성화합니다. 필요한 위험 값은 위험 필드에 0에서 100 사이의 백분율 또는 예금 통화로 설정됩니다. 설정 탭에서 위험 계산 옵션을 선택합니다. $ 통화, % 잔액, % 지분, % 자유 마진, % 사용자 정의, % AB 이전
Trade Manager EA에 오신 것을 환영합니다. 이 도구는 거래를 보다 직관적이고 정확하며 효율적으로 만들기 위해 설계된 궁극적인 리스크 관리 도구 입니다. 단순한 주문 실행 도구가 아닌, 원활한 거래 계획, 포지션 관리 및 리스크 제어를 위한 종합 솔루션입니다. 초보자부터 고급 트레이더, 빠른 실행이 필요한 스캘퍼에 이르기까지 Trade Manager EA는 외환, 지수, 상품, 암호화폐 등 다양한 시장에서 유연성을 제공합니다. Trade Manager EA를 사용하면 복잡한 계산은 이제 과거의 일이 됩니다. 시장을 분석하고 진입, 손절 및 익절 수준을 차트의 수평선으로 표시한 후 리스크를 설정하면, Trade Manager가 이상적인 포지션 크기를 즉시 계산하고 SL 및 TP 값을 실시간으로 표시합니다. 모든 거래가 간편하게 관리됩니다. 주요 기능: 포지션 크기 계산기 : 정의된 리스크에 따라 거래 크기를 즉시 결정합니다. 간단한 거래 계획 : 진입, 손절, 익절을 위한
Local Trade Copier EA MT5
Juvenille Emperor Limited
4.97 (143)
Local Trade Copier EA MT5 를 사용하여 매우 빠른 거래 복사 경험을 해보세요. 1분 안에 간편하게 설정할 수 있으며, 이 거래 복사기를 사용하면 Windows 컴퓨터 또는 Windows VPS에서 여러 개의 MetaTrader 터미널 간에 거래를 0.5초 미만의 초고속 복사 속도로 복사할 수 있습니다. 초보자든 전문가든   Local Trade Copier EA MT5 는 다양한 옵션을 제공하여 사용자의 특정 요구에 맞게 맞춤 설정할 수 있습니다. 이는 수익 잠재력을 높이려는 모든 사람을 위한 최고의 솔루션입니다. 지금 사용해보시고 이것이 왜 시장에서 가장 빠르고 쉬운 무역용 복사기인지 알아보세요! 팁: 여기 에서 데모 계정에서 Local Trade Copier EA MT5 데모 버전을 다운로드하여 사용해 볼 수 있습니다. 다운로드한 무료 데모 파일을 MT5 >> File >> Open Data Folder >> MQL5 >> Experts 폴더에 붙여넣고 터
TradePanel MT5
Alfiya Fazylova
4.88 (163)
Trade Panel은 다기능 거래 도우미입니다. 이 애플리케이션에는 50개 이상의 수동 거래 기능이 포함되어 있으며 대부분의 거래 작업을 자동화할 수 있습니다. 구매하기 전에 데모 계정에서 데모 버전을 테스트할 수 있습니다. 데모 계정용 애플리케이션 체험판 다운로드: https://www.mql5.com/en/blogs/post/750865 . 전체 지침 여기 . 거래. 한 번의 클릭으로 거래를 수행할 수 있습니다: 리스크 자동 계산과 함께 예약 주문 및 포지션 열기. 한 번의 클릭으로 여러 주문 및 포지션 열기. 주문 그리드 열기. 예약 주문 및 포지션을 그룹별로 닫기. 포지션 방향 전환 (Buy 닫기 > Sell 열기, Sell 닫기 > Buy 열기). 포지션 잠금 (부족한 포지션을 열어 Buy와 Sell 포지션의 수량을 동일하게 만들기). 모든 포지션 한 번의 클릭으로 부분적으로 닫기. 모든 포지션의 테이크 프로핏과 스톱로스를 같은 가격 수준에 설정. 모든 포지션의 스톱로스를
베타 출시 Telegram to MT5 Signal Trader 는 곧 공식 알파 버전을 출시할 예정입니다. 일부 기능은 아직 개발 중이며, 작은 버그가 발생할 수 있습니다. 문제가 있으면 꼭 보고해 주세요. 여러분의 피드백은 소프트웨어 개선에 도움이 됩니다. Telegram to MT5 Signal Trader 는 Telegram 채널 또는 그룹의 거래 신호를 자동으로 MetaTrader 5 계정으로 복사하는 강력한 도구입니다. 공개 및 비공개 채널을 모두 지원하며, 여러 신호 제공자를 여러 MT5 계정에 연결할 수 있습니다. 소프트웨어는 빠르고 안정적으로 동작하며, 복사된 거래를 완벽히 제어할 수 있습니다. 인터페이스는 깔끔하며 대시보드와 차트가 시각적으로 구성되어 있고, 직관적인 네비게이션이 가능합니다. 여러 Signal Account를 관리하고, 공급자별 설정을 세밀하게 조정하며, 모든 동작을 실시간으로 모니터링할 수 있습니다. 필수 조건 MQL의 제한으로 인해 EA는 Te
Telegram to MT5 Multi-Channel Copier 는 Telegram 채널의 트레이딩 신호를 자동으로 MetaTrader 5로 직접 복사합니다. 봇도, 브라우저 확장 프로그램도, 수동 복사도 필요 없습니다. Telegram에서 신호를 받으면 EA가 몇 초 안에 터미널에서 거래를 엽니다. 본 제품은 두 가지 구성 요소로 구성되어 있습니다: Telegram 채널을 감시하는 Windows 애플리케이션과 MT5 터미널에서 신호를 실행하는 이 Expert Advisor입니다. MT4 버전도 제공됩니다. 설정 가이드 및 애플리케이션 다운로드: https://www.mql5.com/en/blogs/post/768988 작동 방식 Windows 애플리케이션은 봇이 아닌 사용자 자신의 API 자격 증명을 사용하여 Telegram에 연결됩니다. 이는 프라이빗 및 VIP 채널을 포함하여 구독 중인 모든 채널, 그룹 또는 주제를 읽을 수 있음을 의미합니다. 신호를 감지하면 이를 파싱하여
Trade copier MT5
Alfiya Fazylova
4.56 (50)
Trade Copier는 거래 계정 간의 거래를 복사하고 동기화하도록 설계된 전문 유틸리티입니다. 복사는 공급자의 계정/단말기에서 동일한 컴퓨터 또는 vps에 설치된 수신자의 계정/단말기로 발생합니다. 프로모션 - 이미 "Trade copier MT5"를 구매하셨다면, "Trade copier MT4"를 무료로 받으실 수 있습니다 (MT4 → MT5 및 MT4 ← MT5 복사용). 조건에 대한 자세한 정보를 원하시면, 개인 메시지를 통해 저희에게 문의해 주시기 바랍니다! 구매하기 전에 데모 계정에서 데모 버전을 테스트할 수 있습니다. 데모 버전 여기 . 전체 지침 여기 . 주요 기능 및 이점: 복사기는 "МТ5> МТ5", "МТ4> МТ5", "МТ5> МТ4" 복사를 지원합니다. 복사기는 데모 계정 > 실 계정, 실 계정 > 데모 계정, 데모 계정 > 데모 계정 및 실제 계정 > 실 계정 복사를 지원합니다. 복사기는 읽기 전용 암호가 적용된 투자자 계정에서 복사를 지원합니다. 하
Exp COPYLOT CLIENT for MT5
Vladislav Andruschenko
3.97 (35)
MetaTrader 5용 전문 트레이드 복사기 MetaTrader 용 빠르고 전문적이며 신뢰할 수 있는 트레이드 복사기 입니다. COPYLOT 은 MT4와 MT5 터미널 간의 Forex 거래 복사를 지원하며, Hedge 및 Netting 계좌를 모두 지원합니다. COPYLOT MT5 버전 지원 구성: - MT5 Hedge → MT5 Hedge - MT5 Hedge → MT5 Netting - MT5 Netting → MT5 Hedge - MT5 Netting → MT5 Netting - MT4 → MT5 Hedge - MT4 → MT5 Netting MT4 버전 전체 설명 + DEMO + PDF 구매 방법 설치 방법 로그 파일 확인 방법 테스트 및 최적화 방법 Expforex의 모든 제품 MT4 터미널로도 거래를 복사할 수 있습니다(MT4 → MT4, MT5 → MT4): COPYLOT CLIENT for MT4 COPYLOT은 2개, 3개, 심지어 10개의 터미널과 동시에 작동할
파워 캔들 전략 스캐너 - 자체 최적화 다중 종목 설정 찾기 도구 파워 캔들 전략 스캐너는 마켓 워치에 등록된 모든 종목에 대해 파워 캔들 지표와 동일한 자체 최적화 엔진을 동시에 실행합니다. 하나의 패널에서 현재 통계적으로 거래 가능한 종목, 각 종목별 최적의 전략, 최적의 손절매/익절 조합을 알려주며, 새로운 신호가 발생하면 즉시 알림을 전송합니다. 이 도구는 Stein Investments 에코시스템의 일부입니다. 18개 이상의 도구와 함께 당신의 1대1 AI 트레이딩 멘토 Max.  항상 대기 중, 모든 인디케이터를 깊이 있게 이해, 무언가를 차근차근 생각해보고 싶은 순간에 도움을 줍니다.  https://stein.investments 에서 만나보세요 완벽한 시장 모니터링. 종목당 3,000건 이상의 자동 최적화. 2가지 알림 유형. 한 번의 클릭으로 차트를 전환하고 바로 거래하세요. 이 도구가 필요한 이유 대부분의 다중 종목 스캐너는 가격 변동만 보여줍니다. 티커별
Anchor Trade Manager
Kalinskie Gilliam
5 (6)
Anchor: The EA Manager Run your full EA portfolio without conflicts, without stacked risk, and without watching every chart yourself. Anchor coordinates up to 64 Expert Advisors on a single account, including daily loss protection built for prop firm rules. Attach Anchor to any chart. Type your EA names and magic numbers in one line. Click OK. Anchor begins coordinating immediately. Built for portfolios. Built for prop firms. Built for discipline. The Problem Running multiple EAs on the same acc
Trade Manager DaneTrades
Levi Dane Benjamin
4.23 (30)
거래 관리자는 위험을 자동으로 계산하는 동시에 거래를 빠르게 시작하고 종료하는 데 도움을 줍니다. 과잉 거래, 복수 거래 및 감정 거래를 방지하는 데 도움이 되는 기능이 포함되어 있습니다. 거래를 자동으로 관리할 수 있으며 계정 성과 지표를 그래프로 시각화할 수 있습니다. 이러한 기능은 이 패널을 모든 수동 거래자에게 이상적으로 만들고 MetaTrader 5 플랫폼을 향상시키는 데 도움이 됩니다. 다중 언어 지원. MT4 버전  |  사용자 가이드 + 데모 트레이드 매니저는 전략 테스터에서 작동하지 않습니다. 데모를 보려면 사용자 가이드로 이동하세요. 위기 관리 % 또는 $를 기준으로 위험 자동 조정 고정 로트 크기 또는 거래량과 핍을 기반으로 한 자동 로트 크기 계산을 사용하는 옵션 RR, Pips 또는 Price를 사용한 손익분기점 손실 설정 추적 중지 손실 설정 목표 달성 시 모든 거래를 자동으로 마감하는 최대 일일 손실률(%)입니다. 과도한 손실로부터 계정을 보호하고 과도한
Premium Trade Manager - 코치가 내장된 트레이딩 패널 Premium Trade Manager 는 차트 안에 트레이딩 코치를 심어놓은 도구입니다. 주문을 확정하기 전에, AI 트레이딩 코치 Max가 설정된 거래를 직접 읽고 명확한 판단을 내려줍니다. 스톱이 규율 있는 접근 방식에 맞는지, 리스크 크기가 합리적인지, 고영향 뉴스 이벤트가 몇 분 후에 있는지, 프롭 펌 한도에 근접했는지. 그 아래에는 완전한 실행 엔진이 있습니다. 원클릭 리스크 기반 진입, 차트에서 드래그로 세우고 거래가 진행되는 동안에도 계속 움직일 수 있는 플랜, 최대 4단계 분할 익절, 7가지 트레일링 방식, 실시간 프롭 펌 컴플라이언스, 뉴스 가드, 그리고 자체 비용을 평가하는 스프레드까지. 결정은 당신이 내립니다. Max가 두 번째 시선으로 확인합니다. 패널이 그 이후의 모든 것을 처리합니다. 구매 전에 직접 체험해 보세요. 브라우저에서 라이브 패널을 직접 클릭해볼 수 있습니다. 구매 전에 실제
Farmed Hedge Yield Farming | All Markets (Manual - Hybrid - Semi/Automated EA) MULTI-ASSET SUPPORT Trade any asset available on your broker - Forex: Major, Minor, Exotic pairs - Crypto: BTC, ETH, XRP, SOL, BNB - Stocks: Apple, Tesla, Amazon, Google, etc. - Commodities: Gold, Silver, Oil, Gas - Indices: US30, NAS100, SPX500, DAX40 - Any CFD your broker offers VERIFIED TRADING RESULTS - Farmed Hedge Yield Axi Copy:  https://www.mql5.com/en/signals/2356376 - Farmed Hedge Yield Exn Copy:   https:/
VirtualTradePad PRO SE MT5 — MetaTrader 5용 전문 트레이딩 컨트롤 센터 VirtualTradePad PRO SE 는 MetaTrader 5 용 프리미엄 차트 기반 트레이딩 패널이자 거래 관리 워크스페이스입니다. 더 빠른 주문 실행, 더 명확한 포지션 관리, 구조화된 거래 관리, 시각적인 레벨 계획, 그리고 차트에서 직접 작업하는 전문적인 워크플로를 원하는 트레이더를 위해 설계되었습니다. 이 제품은 단순한 BUY / SELL 패널이 아닙니다. PRO SE는 수동 트레이딩, 예약 주문, 포지션 관리, 부분 청산, 바스켓 손익 관리, 평균가 레벨, ATM 규칙, 신호 모니터링, 실시간 시장 정보, 전략 테스터 (Strategy Tester) 워크플로, VPS 중심 운용을 하나의 연결된 인터페이스로 통합합니다. MT4 버전 | 전체 설명 및 스크린샷 | 구입 방법 | 설치 방법 | 로그 파일을 얻는 방법 | 테스트 및 최적화 방법 | Expforex의 모든
EA Auditor
Stephen J Martret
5 (4)
EA Auditor is an independent analysis tool for traders evaluating Expert Advisors and trading signals on MetaTrader 5. It audits backtest reports, reviews posted developer signals, and cross-verifies the two against each other to help traders assess strategies before committing capital. The MQL5 market offers a wide range of Expert Advisors from many developers, with varying approaches, quality, and transparency. EA Auditor provides a consistent, data-driven framework for reviewing them, answer
Timeless Charts
Samuel Manoel De Souza
5 (7)
Timeless Charts is an all-in-one trading utility for professional traders. It combines custom chart types such as Seconds Charts and Renko with advanced order flow analysis using Footprints , Clusters , Volume Profiles , VWAP studies, and anchored analysis tools for deeper market insight. Trading and position management are handled directly from the chart through an integrated trade management panel , while Market Replay and Virtual Accounts provide environments for practicing trading skills and
Footprint Chart Pro — Professional OrderFlow EA for MetaTrader 5 Version 6.34 | Professional tool for real traders | Institutional-Grade Visualization DEMO USERS - PLEASE SELECT EVERY TICK / REAL TICK WHEN TESTING AND YOU HAVE DOWNLOADED HISTORICAL DATA. IF YOU SEE A WAITING SCREEN AND IT IS NOT DOWNLOADING, IT MEANS YOU HAVE LOW HISTORICAL DATA. TRY 1 MIN AND 5 MIN FIRST ON 1 DAY DATA. ONE DAY DATA SHOULD BE THE NEWEST AND MOST CURRENT DATE. PLEASE WAIT UNTIL THE MARKET HAS ROLLED OVER PERIOD.
MT5 to Telegram Signal Provider 는 사용하기 쉽고 완전히 커스터마이즈 가능한 유틸리티로, 특정 신호를 Telegram의 채팅, 채널 또는 그룹으로 전송하고, 귀하의 계정을 신호 제공자 로 만듭니다. 경쟁 제품과 달리 DLL 임포트를 사용하지 않습니다. [ 데모 ] [ 매뉴얼 ] [ MT4 버전 ] [ 디스코드 버전 ] [ 텔레그램 채널 ]  New: [ Telegram To MT5 ] 설정 단계별 사용자 가이드 가 제공됩니다. 텔레그램 API에 대한 지식은 필요하지 않습니다; 개발자가 제공하는 모든 것이 필요합니다. 주요 특징 구독자에게 보낸 주문 상세 정보를 커스터마이즈할 수 있습니다. 예를 들어, 브론즈, 실버, 골드와 같은 계층 구독 모델을 만들 수 있습니다. 골드 구독에서는 모든 신호를 받습니다. id, 심볼, 또는 코멘트로 주문을 필터링할 수 있습니다. 주문이 실행된 차트의 스크린샷이 포함됩니다 보낸 스크린샷에 닫힌 주문을 그려 추가 검증을 합니다
================================================================================ POC BREAKOUT - V20.72. Full Professional Grade Toolkit ================================================================================ POC Breakout is a full MetaTrader 5 trading dashboard for discretionary traders who want breakout signals, Point of Control (POC) context, volume profiles, order flow, market structure, news, alerts, and advanced trade planning in one professional workspace. Attached directly to you
Unlimited Trade Copier Pro MT5 is a tool to copy trade remotely to multiple MT4, MT5 and cTrader accounts at different computers/locations over internet. This is an ideal solution for you if you are a signal provider and want to copy your trades to other receivers globally on your own rules. One provider can copy trades to multiple receivers and one receiver can get trade from multiple providers as well. The provider can even set the subscription expiry for each receiver, so that receiver will n
HINN Lazy Trader
ALGOFLOW OÜ
5 (1)
LIMITED SUMMER SALE -40% ! ONLY $470 insead of $790!  Maximum real discount! ONLY UNTIL 08/22 The core idea: using the user interface, you configure the parameters the chart must meet before entering a position (or positions), choose which entry models to use, and set the rules for when trading and planning should end. Lazy Trader  handles the rest: it  takes over all the routine chart watching and execution! full description  :: 3 key videos [1] ->  [2]   ->  [3] What can it do? - Understand
작동 데모 다운로드 Copy Cat More (카피캣) MT5 트레이드 카피어 (Trade Copier) 는 로컬 트레이드 카피어이자, 오늘날의 트레이딩 과제를 위해 설계된 완전한 리스크 관리 및 실행 프레임워크입니다. 프롭 펌 (prop firm) 챌린지부터 개인 포트폴리오 관리까지, 견고한 실행, 자본 보호, 유연한 설정, 고급 트레이드 처리의 조합으로 모든 상황에 적응합니다. 이 카피어는 마스터 (Master, 송신측) 와 슬레이브 (Slave, 수신측) 두 모드 모두에서 작동하며, 시장가 주문과 대기 주문, 트레이드 수정, 부분 청산, 상호 청산 (Close By) 작업을 실시간으로 동기화합니다. 데모 및 실거래 계좌, 트레이딩 또는 인베스터 로그인 모두와 호환되며, EA·터미널·VPS가 재시작되더라도 영구 트레이드 메모리 (Persistent Trade Memory) 시스템을 통해 복구를 보장합니다. 고유 ID로 여러 마스터와 슬레이브를 동시에 관리할 수 있으며, 브로커
Trade Dashboard MT5
Fatemeh Ameri
4.95 (131)
Trade Dashboard simplifies how you open, manage, and control your trades, with built-in lot size calculation. It allows you to execute trades, manage risk, and control positions directly on the chart, with tools such as partial close, breakeven, and trailing stop. Designed to reduce manual work and help you stay focused on your trading decisions. A demo version is available for testing. Detailed explanations of features are provided within the MQL5 platform. Installation instructions are include
MetaTrader 5용 트레이딩 패널 — 차트와 키보드에서 실행하는 프로페셔널 원클릭 트레이딩 활동적인 트레이더를 위해 설계된 고급 Trading Panel로, MetaTrader 기본 인터페이스보다 훨씬 빠르고 직관적으로 포지션과 주문을 열고, 관리하고, 종료할 수 있습니다. 이 패널은 포지션 관리, 대기 주문 제어, 총수익 관리, 체결 속도를 하나의 전문적인 작업 공간에 통합하고 싶은 트레이더를 위한 솔루션입니다. 이것은 단순한 보조 유틸리티가 아닙니다. MetaTrader 5를 위한 진정한 trading cockpit입니다. 차트에서 직접 거래하고, 키보드로 빠르게 명령을 실행하며, 자동 계산과 시각적 가이드를 통해 수동 트레이딩을 더 빠르고, 더 명확하고, 더 편리하게 만들어 줍니다.  이 패널을 사용하면 차트에서 단 한 번의 클릭으로 거래를 실행할 수 있으며, 표준 MetaTrader 컨트롤보다 최대 30배 빠르게 거래 작업을 수행할 수 있습니다. 새로운 프리미엄 버전
Telegram To MT5 Ultra
Mirel Daniel Gheonu
5 (2)
Telegram To MT5 — 시그널 카피어 텔레그램 채널의 트레이딩 콜을 실제 MT5 주문으로 바꿔 드립니다 — 자동으로, 원하는 만큼의 계좌에서, 리스크와 규칙을 완전히 당신의 통제 아래 둡니다. Telegram To MT5는 이미 텔레그램에서 팔로우하고 있는 VIP / 시그널 채널을 당신의 MetaTrader 5 터미널에 연결합니다. 무료 동반 데스크톱 앱이 메시지를 읽고(봇을 차단하는 채널에서도 가능), 이 EA가 당신의 계좌에서 이를 실행합니다 — 당신만의 리스크 설정, 심볼 매핑, 익절(TP) 처리, 세션 및 뉴스 필터를 적용합니다. 이것은 블랙박스 전략이 아니라 시그널 카피어입니다. 어떤 채널을 신뢰할지, 각 거래의 수량과 관리 방식을 당신이 결정합니다. 단계별 설정 및 동반 앱 설치 가이드 작동 방식 [당신의 텔레그램 채널] -> [동반 데스크톱 앱] -> [MT5 + 이 EA] -> 주문 동반 데스크톱 앱(무료, 포함)은 당신의 텔레그램 계정으로 로그인하여 선택한
EasyInsight AIO MT5
Alain Verleyen
4.92 (12)
EASY Insight AIO – 스마트하고 손쉬운 트레이딩을 위한 올인원 솔루션 개요 외환, 금, 암호화폐, 지수, 심지어 주식까지 — 전 시장을 몇 초 만에, 수동 차트 확인이나 복잡한 설치, 인디케이터 설정 없이 스캔할 수 있다고 상상해 보세요. EASY Insight AIO 는 AI 기반 트레이딩을 위한 궁극의 플러그 앤 플레이(Plug & Play) 데이터 내보내기 도구입니다. 단 하나의 깔끔한 CSV 파일로 전체 시장 스냅샷을 제공하며, ChatGPT, Claude, Gemini, Perplexity 등 다양한 AI 플랫폼에서 즉시 분석할 수 있습니다. 창 전환, 복잡함, 차트 오버레이는 더 이상 필요 없습니다. 자동으로 내보내지는 순수하고 구조화된 데이터 인사이트만으로, 반복적인 차트 감시 대신 데이터 기반의 스마트한 의사결정에 집중할 수 있습니다. 왜 EASY Insight AIO인가요? 진정한 올인원 • 별도의 설정, 인디케이터 설치, 차트 오버레이가 필요 없습
The product will copy all telegram signal to MT5 ( which you are member) , also it can work as remote copier.  Easy to set up, copy order instant, can work with almost signal formats, image signal,  s upport to translate other language to English Work with all type of channel or group, even channel have "Restrict Saving Content", work with  multi channel, multi MT5 Work as remote copier: with signal have ticket number, it will copy exactly via ticket number. Support to backtest signal. How to s
KT Equity Protector MT5
KEENBASE SOFTWARE SOLUTIONS
3.6 (5)
모든 MetaTrader 트레이더가 실행해 두어야 하지만, 아직 많은 사람이 사용하지 않는 단 하나의 EA. 대부분의 계좌는 전략이 틀려서 무너지는 것이 아닙니다. 좋지 않은 순간에 손실을 계속 방치하거나, 포지션을 더 키우거나, 주말까지 거래를 들고 가거나, 한 주 동안의 수익을 다시 시장에 돌려주거나, 단 한 번의 잘못된 클릭으로 prop firm의 일일 손실 한도를 잊어버리기 때문에 무너집니다. KT Equity Protector는 이런 일이 일어나지 않도록 막아주는 자동 계좌 보호 EA입니다. 차트 하나에만 설치하세요. 이해하기 쉬운 단계별 설정 마법사에서 일일 손실, 최대 드로다운, 수익 목표, equity 트레일링 스톱, 주말 전 청산 같은 규칙을 한 번만 설정하면 됩니다. 그 순간부터 EA는 전체 MetaTrader 계좌를 실시간으로 감시합니다. 모든 포지션. 모든 심볼. 모든 틱. 설정한 선이 넘어가는 즉시, EA는 사용자가 선택한 동작을 실행합니다. 알림, 손실 거래
Quant AI Agents
Ho Tuan Thang
5 (1)
Quant AI Agents are independent trading Expert Advisors. Instead of trading using a fixed strategy like other conventional EAs, Quant AI Agents   is a   multi-agent AI trading framework   that turns natural-language strategy prompts into live.  WANT THE SAME RESULTS AS MY LIVE SIGNAL?   Use the exact same brokers I do:   IC MARKETS , IC TRADING   .  Unlike the centralized stock market, Forex has no single, unified price feed.  Every broker sources liquidity from different providers, creating un
Grid Manual MT5
Alfiya Fazylova
4.73 (22)
"Grid Manual"은 주문 그리드 작업을 위한 거래 패널입니다. 이 유틸리티는 보편적이며 유연한 설정과 직관적인 인터페이스를 제공합니다. 그것은 손실을 평균화하는 방향뿐만 아니라 이익을 증가시키는 방향으로 주문 그리드와 함께 작동합니다. 거래자는 주문 그리드를 만들고 유지할 필요가 없으며 유틸리티에서 수행합니다. 거래자가 주문을 시작하는 것으로 충분하며 "Grid Manual"는 자동으로 그를 위한 주문 그리드를 생성하고 거래가 마감될 때까지 그와 동행할 것입니다. 전체 설명 및 데모 버전 여기 . 유틸리티의 주요 기능: 모바일 터미널을 포함하여 어떤 방식으로든 열린 주문과 함께 작동합니다. "제한" 및 "중지"의 두 가지 유형의 그리드와 함께 작동합니다. 고정 및 동적(ATR 표시기 기반)의 두 가지 유형의 그리드 간격 계산과 함께 작동합니다. 오픈 오더 그리드의 설정을 변경할 수 있습니다. 차트에서 각 주문 그리드의 손익분기점 수준을 표시합니다. 각 주문 그리드에 대한 이익
제작자의 제품 더 보기
1. Why did I develop this series of indicators I found that most traders need to use multiple time frame indicators. They usually switch time frame to see indicators. However, once the timeframe is switched, you cannot see the  corresponding relationship  between  the price in the smaller timeframe  and  the indicator in the larger timeframe . For example: if your price chart is in H1 timeframe, you can see H4, D1 and W1 indicators in H1 timeframe Chart. This is more helpful for you to find th
This product can be used to synchronize multiple Charts, and each Chart can be set to a different sync mode. With this product you can better view and manipulate charts: different time frames for a single Symbol, the same time frame for multiple Symbols... and more. PS: The link below is the FreeDemo product, you can use it on EURUSD/XUAUSD/USDCNH symbol: https://www.mql5.com/en/market/product/38557 Feature: Chart settings  can be synchronized, including : background, indentation, size, etc. M
Do you think it's a bit cumbersome when you need to switch symbols or timeframes with mouse click? 1. What is this? This is a program that can switch symbols and timeframes with direction keys. Fast switching, very convenient, no mouse click required. For traders, one symbol with multi-timeframe charts are usually added,  you can change symbol on those charts easily. For multi-currency traders, different symbol charts are usually added, you can also change those timeframes easily. I wrote this p
1. What is this         Rising volatility and falling volatility are not the same, whether it is academic research or actual testing has shown this point.         The original ATR indicator is calculated by putting up and down fluctuations together. This indicator is to calculate separately the upward volatility and the downward volatility, which can better help you study the market. 2. Indicator description          There are two modes for the calculation of this indicator, as shown in the fo
Have you ever take a long time to watch a Symbol when the network link is not good ? Have you ever wait for a long time when you switch chart between different Symbols or different TimeFrames ? If you do long-term backtesting , Have you ever to be downloaded datas for a long time ? Yes, If there is no data in the system, those will happen.  1. What is this: Download all the Symbol data in Market Watch to the system. PS: This is not outputting data to Files. This Link go to Demo version: https:/
I see that many tools in the market deal with Position and Order in the form of operation panels. Which is loaded into a Chart in the form of an EA. However, once the operator panel EA is loaded, no other EAs can be loaded. So, I wrote the one-click operation of Position and Order as a script, so you can load other EAs and easily complete one-click operation of Trade. 1. What is this: This is a one-click script to close position order. Now you can close position tickets at high speed, for examp

I see that many tools in the market deal with Position and Order in the form of operation panels. Which is loaded into a Chart in the form of an EA. However, once the operator panel EA is loaded, no other EAs can be loaded. So, I wrote the one-click operation of Position and Order as a script, so you can load other EAs and easily complete one-click operation of Trade. 1. What is this: This is a one-click script to delete the pending order . Now you can delete pending tickets at high speed, for
Do you think it's a bit cumbersome when you need to switch symbols or timeframes with mouse click? 1. What is this? This is a program that can switch symbols and timeframes with direction keys. Fast switching, very convenient, no mouse click required. For traders, one symbol with multi-timeframe charts are usually added,  you can change symbol on those charts  easily . For multi-currency traders, different symbol charts are usually added, you can also change those timeframes easily. I wrote thi
According to trading experience: Some symbols are easy to reverse on certain days, such as Monday, or afternoon, and so on. So comparing the current price with the corresponding historical moment price is valuable. If the price coordinate system uses a logarithmic price, you will get a lot of valuable information. 1. What is this? This program can convert the symbol price and add it to your Chart. You can compare it with your major chart. The DEMO version Link: https://www.mql5.com/en/market/pr
What is this: Violent trading: means sending a large number of orders to your brokerage server,  it can conduct a stress test of the trading. In this program you can run a variety of trading tests.  Now you can trade at high speed, For example 1000 orders in an instant. The Demo version's link:  https://www.mql5.com/en/market/product/38431/ Why to use: Whether manual trading or EA trading,  the status of the broker server is very important. So it is beneficial to conduct a trading stress test on
1. Why did I develop this series of indicators I found that most traders need to use multiple time frame indicators. They usually switch time frame to see indicators. However, once the timeframe is switched, you cannot see the  corresponding relationship  between  the price in the smaller timeframe  and  the indicator in the larger timeframe . For example: if your price chart is in H1 timeframe, you can see H4, D1 and W1 indicators in H1 timeframe Chart. This is more helpful for you to find th
필터:
globalkoinaka
31
globalkoinaka 2020.05.01 02:41 
 

사용자가 평가에 대한 코멘트를 남기지 않았습니다

[삭제] 2019.02.10 02:53 
 

사용자가 평가에 대한 코멘트를 남기지 않았습니다

리뷰 답변