Multi Chart Crosshairs MT5

5

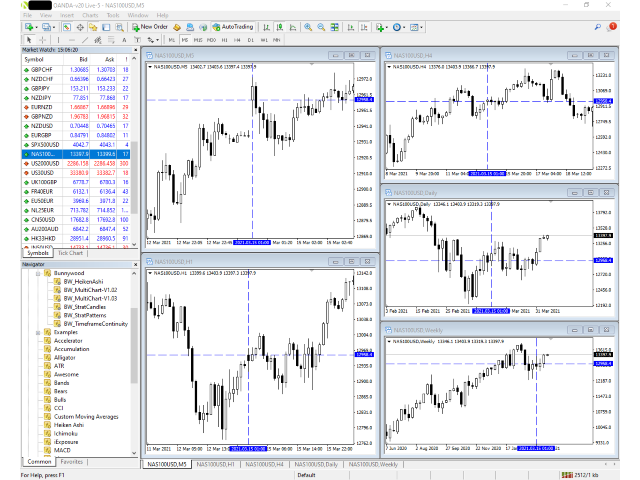
이 표시기는 다양한 시간 척도의 많은 차트를 더 빠르고 쉽게 검토할 수 있도록 설계되었습니다.

  • 여러 차트에서 시간 및 가격 추적
  • 한 차트의 심볼 변경 및 동일한 심볼의 다른 모든 차트도 변경됩니다.
  • 사용하기 쉽고 빠르게 마스터하기

표시기를 사용하면 동일한 기호에 열려 있는 다른 모든 차트에서 마우스 포인터가 현재 차트에 있는 가격과 시간을 식별할 수 있습니다. 이렇게 하면 일반적으로 동일한 위치를 식별하는 데 약간의 시간을 소비해야 하는 반면 여러 해도에 대한 정보를 빠르게 볼 수 있습니다.

열려 있는 모든 차트에서 시간만 추적하도록 선택할 수도 있습니다. 이를 통해 다이버전스 헌팅 시 쉽게 탐색할 수 있습니다.

한 차트에서 심볼을 변경하면 동일한 심볼의 다른 모든 차트가 해당 기간 설정을 유지하면서 새 심볼로 전환됩니다.

사용하는 방법

차트를 검토할 때 추세와 거래 수준을 식별하기 위해 여러 기간을 살펴보는 것을 좋아합니다. 나는 그것을 돕기 위해 이 도구를 만들었고 또한 장기간에 걸쳐 여러 차트를 살펴보는 시각적 백 테스트를 위해 만들었습니다.

이 도구는 마우스 포인터를 따라가는 십자선을 화면에 추가합니다. CTRL 또는 SHIFT 키를 누르면 활성화되므로 항상 있는 것은 아니지만 원할 때 있습니다.

활성화되면 추적하려는 모든 차트를 가리킬 수 있으며 동일한 기호가 있는 다른 차트에서 십자선은 해당 차트에서도 동일한 시간과 가격을 표시합니다. 다른 창의 차트는 시간/가격 조합이 디스플레이의 중심이 되도록 디스플레이를 자동으로 스크롤합니다.

ESC 키를 누를 때까지 보이는 십자선에 영향을 주지 않고 차트에 그리기 요소를 추가할 수 있습니다. ESC 키를 누르면 다시 필요할 때까지 십자선이 다시 숨겨집니다.

데모

사용 중인 지표를 보여주는 비디오를 검토하십시오.


저처럼 유용하게 사용하시길 바랍니다.

관심을 가져 주셔서 감사합니다!


리뷰 8
Michel
177
Michel 2024.01.15 18:46 
 

Works as promised. I only could not change the colour input for crosshair (on mac) but thats all.

Forexezek
48
Forexezek 2023.11.14 10:51 
 

Hello! I bought the indicator. Very good! However, when I'm not using it, it would be nice if MT5's built-in crosshairs would work again to press the middle mouse button. It's deleting this feature for some reason. Could you modify it like this? Please

Sorry, but I didn't see that you already corrected it and wrote an answer. Thank you very much!

Could there possibly be a setting to set the crosshairs in the background/foreground? 100% perfect indicator after the repair! You are a perfect seller!

nabil84
129
nabil84 2023.03.08 09:54 
 

The Best Tool to track time across multiple charts and Instruments ( As per now its the only one available on the Market for MT5 to get the job done) .Highly Recommended for Traders who want to track specific timing on different instrument.

추천 제품
MarketPredict Pro – 고급 다중 레이어 시장 분석 시스템   작동 방식 MarketPredict Pro는 6개의 독립적인 분석 레이어를 결합하여 다음 캔들을 고정밀로 예측합니다.   6‑레이어 분석 구조 Buyers/Sellers Pressure   – 매수/매도 세력의 강도 측정 Trend Strength   – SMA(20)을 이용한 추세 강도 계산 Volatility   – ATR 유사 14기간 변동성 모델 Market Pressure   – 최근 5개 캔들의 누적 시장 압력 Prediction Engine   – 다중 요인 기반 다음 캔들 예측 Real‑time Panel   – 실시간 시장 통계 패널   기술 알고리즘   압력 계산 모델 거래량, 방향성, 가격 움직임을 결합한 가중 압력 분석.   통계적 정확도 STRONG 신호:   82–87% NORMAL 신호:   73–78% SIDEWAYS / UNCERTAIN:  
RBreaker
Zhong Long Wu
RBreaker Gold Indicators는 금 선물을 위한 단기 데이 트레이딩 전략으로, 추세 추종과 데이 내 반전의 두 가지 거래 방식을 결합합니다. 추세 장에서 수익을 포착할 수 있을 뿐만 아니라, 시장이 반전될 때 적시에 이익을 확정하고 추세에 맞춰 반대 포지션을 잡을 수 있습니다. 이 전략은 미국 잡지 Futures Truth에서 15년 연속으로 가장 수익성 높은 트레이딩 전략 상위 10위 안에 선정되었습니다. 긴 라이프사이클을 자랑하며, 현재까지 국내외에서 널리 사용되고 연구되고 있습니다. 본 지표는 2026년 금 선물의 움직임을 반영하여 14일 ATR 지표를 기반으로 돌파 계수 A, 관찰 계수 B, 반전 계수 R을 보다 합리적인 값으로 정의했습니다. 매우 훌륭한 지표이며, 안정적인 연간 수익성을 달성했습니다. 강력히 추천합니다~ 위 지표는 변동성이 높은 상품에 적합하며, 매개변수는 금 선물, 주가 지수 선물 등에 적합합니다. 다른 상품이 필요한 경우 돌파 계수 A
RSI Currency Strength Meter is a powerful and elegant multi-currency indicator that measures the real-time relative strength of the 8 major currencies using RSI logic. By calculating the smoothed performance of each currency across its major pairs and applying the RSI formula, it delivers clean and responsive strength lines that make it easy to spot which currencies are truly strong or weak at any moment. This indicator is particularly useful for visualizing currency correlations and divergence
Step into the world of Forex trading with confidence, clarity, and precision using Gold Indicator a next-generation tool engineered to take your trading performance to the next level. Whether you’re a seasoned professional or just beginning your journey in the currency markets, Gold Indicator equips you with powerful insights and help you trade smarter, not harder. Built on the proven synergy of three advanced indicators, Gold Indicator focuses exclusively on medium and long-term trends elimina
Delta Profile Volume
Teresinha Moraes Correia
기술 설명 – MetaTrader 5용 Delta Profile Delta Profile 은 MetaTrader 5에서 정의된 캔들 범위 내의 거래량 흐름을 세부적으로 분석하기 위해 설계된 지표입니다. 이 도구는 각 가격 수준에서 양의 거래량(상승과 관련) 과 음의 거래량(하락과 관련) 간의 불균형을 구조화하고 시각화합니다. 이를 통해 사용자는 실제로 거래가 집중되는 가격 영역과 시장 불균형이 형성되는 구간을 명확하게 파악할 수 있습니다. 핵심 개념 지표는 가격 레벨 을 인식하고 이를 양의 거래량, 음의 거래량 및 순 델타(양-음 차이)로 분류합니다. 각 가격 레벨은 수평 막대 로 차트에 표시되며, 거래가 집중되는 구간을 직관적으로 보여줍니다. 사용자는 분석할 캔들의 개수 , 가격 반올림 정밀도 , 최대 표시 레벨 수 , 표시 옵션 등을 직접 설정할 수 있습니다. 주요 기능 가격 레벨 매핑 : 사용자가 지정한 자릿수에 맞게 가격을 반올림하여 거래량을 집계합니다. 순 델타 계산 : 양
Gann Time–Price Square Cycles (MT5) This indicator applies the concept of time–price balance introduced by W.D. Gann. It detects price swings on the chart and projects Quarter, Half, and Full cycle time intervals forward, marking them with vertical lines. The tool is designed to help traders study the relationship between swing size and elapsed time directly on MT5 charts. Functions Detects swing highs and lows based on pivot depth and minimum swing size. Projects Quarter, Half, and Full harmon
PipFinite Trend PRO MT5
Karlo Wilson Vendiola
4.84 (557)
Breakthrough Solution For Trend Trading And Filtering With All Important Features Built Inside One Tool! Trend PRO's smart algorithm detects the trend, filters out market noise and gives entry signals with exit levels. The new features with enhanced rules for statistical calculation improved the overall performance of this indicator. Important Information Revealed Maximize the potential of Trend Pro, please visit www.mql5.com/en/blogs/post/713938 The Powerful Expert Advisor Version Automatin
Quantum Currency Array Indicator for MT5
QUANTUM TRADING SOFTWARE LIMITED
This indicator has been developed to identify and display these trends quickly and easily, allowing you to see instantly, those currency pairs which are trending, and those which are not – and in all timeframes, with just one click. The 28 currency pairs are displayed as a fan as they sweep from strong to weak and back again, and this is why we call it the ‘currency array’. All 28 pairs are arrayed before you, giving an instant visual description of those pairs that are trending strongly, those
Your Trend Friend
Luigi Nunes Labigalini
5 (1)
The trend is your friend! Look at the color of the indicator and trade on that direction. It does not  repaint. After each candle is closed, that's the color of the trend. You can focus on shorter faster trends or major trends, just test what's most suitable for the symbol and timeframe you trade. Simply change the "Length" parameter and the indicator will automatically adapt. You can also change the color, thickness and style of the lines. Download and give it a try! There are big movements w
개요 Candle Timer Countdown Pro는 현재 캔들의 마감까지 남은 시간을 부드럽고 정확하게 카운트다운으로 표시하며, 원형 진행 아크를 통해 남은 시간을 직관적으로 보여줍니다. 서버 시간 보간(Server Time Interpolation) 기술을 사용하여 틱이 없는 구간에서도 멈춤 없이 부드럽게 작동합니다. M1부터 MN까지 모든 타임프레임을 지원합니다. 스캘핑(1분 차트)부터 스윙 트레이딩(H4 이상)까지, 캔들 마감 시간을 정확히 파악하면 진입 타이밍을 개선하고 성급한 결정을 방지할 수 있습니다. 주요 특징 틱 간 멈춤 없는 정확한 카운트다운 원형 진행 표시 (Ring 또는 Filled Pie) 6가지 표시 위치 선택 가능 3가지 색상 모드 (Manual / Candle Outline / Candle Body) 마감 직전 하이라이트 기능 연결 상태 감지 (Active / Inactive / Disconnected) 새 캔들 알림 (팝업, 이메일, 푸시) 모든 타임
Maximum Trend Arrows OT MT5
Mulweli Valdaz Makulana
STRICTLY FOR BOOM INDEX ONLY!!!!! Here I bring the Maximum Trend Arrows OT1.0 MT5 indicator. This indicator is made up of a combination of different trend indicators for entries and exits, for entries an orange arrow will paint on the chart below the current market and a red flag for closing of trades and it produces buy arrows only. When the orange arrow appears, it will appear along with it's sound to notify you. The 1H timeframe is recommended, don't use it anywhere else than on the 1H timefr
Noize Absorption Index
Ekaterina Saltykova
Noize Absorption Index - is the manual trading system that measures the difference of pressure between bears forces and bulls forces. Green line - is a noize free index that showing curent situation. Zero value of index shows totally choppy/flat market.Values above zero level shows how powerfull bullish wave is and values below zero measures bearish forces.Up arrow appears on bearish market when it's ready to reverse, dn arrow appears on weak bullish market, as a result of reverse expectation.
CosmiCLab FIBO
Kirils Subins
CosmiCLab SMC FIBO CosmiCLab SMC FIBO is a professional trading indicator designed for traders who use Smart Money Concepts (SMC), market structure analysis and Fibonacci retracement levels. The indicator automatically detects market swings and builds Fibonacci levels based on the latest impulse movement. It also identifies market structure changes such as BOS (Break of Structure) and CHOCH (Change of Character), helping traders understand the current market direction. CosmiCLab SMC FIBO also pr
Product Name: Smart Switch Dashboard STOP WASTING SECONDS. SECONDS COST MONEY. Are you losing trades because you're fumbling through the Market Watch? Is your workspace messy and slowing you down? In trading, Speed is everything. If you aren't organized, you are losing money to traders who are. Smart Switch Dashboard is not just a tool—it is your COMMAND CENTER . Designed for serious Scalpers and Day Traders who demand Speed, Precision, and Zero Lag. DOMINATE YOUR WORKFLOW 1. ULTRA-FAST SY
Support Resistance Pro Toolkit Donchian is a support and resistance indicator for MetaTrader 5 designed to highlight important market zones using a Donchian-based swing detection model. It draws clean support and resistance levels or zones directly on the chart, tracks broken structures, identifies sweep events, and provides a live dashboard with useful statistics. Pricing Launch Price : $33 Incremental Price Increase : The price will increase by $10 after every 10 purchases. Final Price : $69 T
Episode Health Monitor Episode Health Monitor is a trading utility for MetaTrader 5 designed to analyze the real-time condition of active trading positions directly on the chart. The tool evaluates the current “trading episode” - a group of open positions - and provides a structured view of risk, stability, and distance to potential failure. Instead of relying only on profit/loss or price movement, it helps identify whether the current position is stable, weakening, or approaching a critical st
Trading Utility for Forex Currency Pairs Only not for Gold  Functions Auto Lot Calculation based on Risk Auto stoploss  Auto TakeProfit Breakeven Auto Close Half % Close in percentage with respect to the PIPs Pending Orders BuyLimit Sell Limit with distances BuyStop Sell Stop    with distances Trading Informations Risk in percentage For Multiple trades Combine Takeprofit and Combine Stoplosses
Overview Mirror Signals Service EA (Text only)   is a powerful monitoring Expert Advisor that automatically sends   real-time Telegram notifications   for all important trade events on your MetaTrader 5 account. It is engineered specifically for   signal providers ,   trade-copier operators ,   auditors ,   educators , and   professional trading services   that require immediate, detailed, and reliable reporting. Everything from   entries, exits, SL/TP changes, comment changes, trailing sto
Price Position Indicator
Lamont Simone Reynecke
Price Position Indicator.... This indicator tells you exactly when to buy or sell in the market with alerts, it works on any time frame and with any market of your choice, it is highly accurate and is definitely worth the investment, this indicator performs well with the moving average indicator i also have for sale, be sure to check out my profile to see my products. it gives out buy and sell signals based on where the current price is, it follows the trend as well.
Deriv Boom sell
Yaovi Inoussa Atchou
Our BOOM SELL ALERT indicator is specifically engineered to   take candles on BOOM 1000 , BOOM 500 is tool is optimized for M1 (1-minute) timeframe, ensuring you receive timely and actionable insights.   The indicator is a combination of   many indicators. -        AO Oscillator -        Stochastic   HOW TO USE THIS INDICATOR To use well this indicator , it   need to use SCHAFF TREND RSX ( 5 MIN OR M5) IF SCHAFF trend RSX is GREEN and you have a signal then SELL when you have ENTRY and out with
Price Magnet — Price Density and Attraction Levels Indicator Price Magnet is a professional analytical tool designed to identify key support and resistance levels based on statistical Price Density. The indicator analyzes a specified historical period and detects price levels where the market spent the most time. These zones act as “magnets,” attracting price action or forming a structural base for potential reversals. Unlike traditional Volume Profile tools, Price Magnet focuses on price-time d
Trade Extender
Loncey Duwarkah
5 (1)
Autonomously executes trades, overseeing the entire process from initiation to completion.  Free support via chat, email and remote assistance Originally built for XAUUSD (Gold). Settings changes for other symbols Powerful rules management Enhanced positioning features Risk Management / Dynamic lot sizing Quick Setup Symbols : XAUUSD Investment for all: Our trading bot is crafted to serve traders of all investment levels, ensuring accessibility to the forex market even for those with limited fu
ALIEN Dashboard
Youssef Esseghaiar
ALIEN DASHBOARD FULL EDITION – Professional ICT & Precision Trading Dashboard for MT5 ( HYBRID ENGINE ) Overview The   Alien Dashboard Full Edition   is a comprehensive, all‑in‑one technical indicator for MetaTrader 5 that merges the most powerful concepts from Inner Circle Trader (ICT) methodology with advanced precision‑entry logic, multi‑timeframe analysis, and an intuitive on‑chart dashboard. Designed for serious traders who want to visualise institutional order flow, identify high‑probabili
Prizmal Logic
Vladimir Lekhovitser
3.5 (2)
실시간 거래 신호 거래 활동의 공개 실시간 모니터링: https://www.mql5.com/ko/signals/2353471 공식 정보 판매자 프로필 공식 채널 사용자 매뉴얼 설정 안내 및 사용 지침: 사용자 매뉴얼 열기 이 전문가 어드바이저는 규칙 기반 거래 전략에 기반하여 설계되었습니다. 이 전략은 시장에 지속적으로 노출되기보다는 특정 시장 조건을 식별하는 데 초점을 둡니다. 시스템은 가격 움직임, 변동성 특성 및 시간 요소를 분석합니다. 이 요소들은 현재 시장 환경이 거래 참여에 적합한지 판단하는 데 사용됩니다. 여러 사전 정의된 기준이 동시에 충족될 때만 거래가 실행됩니다. 조건이 충족되지 않으면 전문가 어드바이저는 비활성 상태를 유지합니다. 그 결과 거래 활동은 일정하지 않습니다. 거래가 전혀 발생하지 않는 기간이 있을 수 있습니다. 이는 포지션이 전혀 없는 하루 전체를 포함할 수 있습니다. 반대로 적절한 시장 국면에서는 비교적 짧은 시간에 여러 거
HMA Trend Professional MT5
Pavel Zamoshnikov
4.25 (4)
Improved version of the free HMA Trend indicator (for MetaTrader 4) with statistical analysis. HMA Trend is a trend indicator based on the Hull Moving Average (HMA) with two periods. HMA with a slow period identifies the trend, while HMA with a fast period determines the short-term movements and signals in the trend direction. The main differences from the free version: Ability to predict the probability of a trend reversal using analysis of history data. Plotting statistical charts for analyzi
Universal Trend
Maryna Shulzhenko
The Universal Trend indicator was created to detect trends in price movement and allows you to quickly determine not only the direction of the trend, but also understand the levels of interaction between buyers and sellers. The indicator works on all timeframes and currency pairs. The indicator gives fairly accurate signals and it is customary to use it both in trending and flat markets. It is advisable to use the indicator in combination with other tools for more reliable signals and making a
Riko Trend mt5
Nadiya Mirosh
The Riko Trend indicator is a revolutionary trend trading and filtering solution with all the important features of a trend tool built into one tool! The Riko Trend indicator is good for any trader, suitable for any trader for both forex and binary options. You don’t need to configure anything, everything is perfected by time and experience, it works great during a flat and in a trend. The Riko Trend indicator is a technical analysis tool for financial markets that reflects the current price f
Axiom Point
Tatiana Savkevych
Axiom Point — Precision Structural Breakout Indicator Axiom Point is a high-performance analytical indicator designed to identify high-probability reversal zones using price-action behaviour and adaptive balance filtering. The indicator applies a multi-layer analytical model to detect moments when price transitions beyond its normal equilibrium area, indicating a potential shift in market momentum. Unlike conventional trend-following tools, Axiom Point focuses on so-called points of no return —
Trade Assistant 38 in 1
Makarii Gubaydullin
4.91 (23)
다기능 도구: 로트 계산기, 그리드 주문, R/R 비율, 트레이드 관리자, 수급 구역, 가격 행동 등 데모 버전   |   사용자 설명서 트레이드 어시스턴트   는 전략 테스터에서 작동하지 않습니다 :   여기에서 데모 버전을 다운로드  하여 유틸리티 를 테스트하세요. 질문/개선 아이디어/버그 발견 시 연락주세요 MT4 버전이 필요하시면 여기 에서 이용 가능합니다 거래   프로세스 를 간소화, 가속화, 자동화하세요. 이   대시보드 로 표준 터미널 기능을 확장합니다. 트레이딩 패널은  모든 거래 상품에서 작동: 외환, 주식, 지수, 암호화폐 등. 1. 새 거래 개시 : 로트 / 위험 / RR 계산 : 수동 거래를 위한 위험 관리 로트 계산기 (위험 크기 기반 거래량 계산) 위험 계산기 (로트 크기 기반 위험 금액) 위험 대비 보상   비율 그리드 주문:  + 동적 간격 옵션, 로트 분할 옵션 주문 활성화 트리거, + 매수 스톱리밋 / 매도 스톱리밋 가상 SL, 가상 TP (숨김
Liquidity Oscillator
Paolo Scopazzo
3 (2)
A powerful oscillator that provide Buy and Sell signals by calculating the investor liquidity. The more liquidity the more buy possibilities. The less liquidity the more sell possibilities. Please download the demo and run a backtest! HOW IT WORKS: The oscillator will put buy and sell arrow on the chart in runtime only . Top value is 95 to 100 -> Investors are ready to buy and you should follow. Bottom value is 5 to 0 -> Investors are ready to sell and you should follow. Alert + sound will appe
이 제품의 구매자들이 또한 구매함
Neuro Poseidon MT5
Daria Rezueva
4.94 (17)
Neuro Poseidon is a new indicator by Daria Rezueva. It combines precise trading signals with adaptive TP/SL levels - creating best possible trades as a result! Message me and get  Neuro Poseidon Assistant  as a gift to automize your trading process! What makes it stand out? 1. Proven profitability on all assets and timeframes 2. Only confirmed BUY and SELL signals present on the chart 3. Adaptive TP & SL levels generated by the software for each trade 4. Easy to understand - suitable for al
SuperScalp Pro
Van Minh Nguyen
4.65 (26)
SuperScalp Pro – 고급 멀티 필터 스캘핑 지표 시스템 SuperScalp Pro는 클래식 Supertrend와 여러 지능형 확인 필터를 결합한 고급 스캘핑 지표로, 거래 기회를 식별하는 데 도움을 줍니다. M1부터 H4까지 다양한 시간대에서 효율적으로 작동하며, XAUUSD, BTCUSD 및 주요 Forex 통화쌍에 최적화되어 있습니다. 이 지표는 명확한 매수 및 매도 신호를 제공하며, ATR 기반으로 진입가, 손절가, 익절가를 자동 계산하여 보다 효과적인 리스크 관리를 지원합니다. Fibonacci Take Profit 기능은 중요한 가격 구간에서 더 빠르게 포지션을 청산할 수 있도록 하며, 해당 수준 도달 시 알림을 전송합니다. 기본 설정은 Fibonacci Take Profit이 활성화된 상태로 최적화되어 있으며, 보다 안정적이고 일관된 거래 경험에 중점을 둡니다. 차트에 적용하는 것만으로 즉시 사용할 수 있습니다. 고급 사용자를 위해 모든 파라미터는 자유롭게 사용
Divergence Bomber
Ihor Otkydach
4.9 (89)
이 지표를 구매하신 분께는 다음과 같은 혜택이 무료로 제공됩니다: 각 거래를 자동으로 관리하고, 손절/익절 수준을 설정하며, 전략 규칙에 따라 거래를 종료하는 전용 도우미 툴 "Bomber Utility" 다양한 자산에 맞게 지표를 설정할 수 있는 셋업 파일(Set Files) "최소 위험", "균형 잡힌 위험", "관망 전략" 모드로 설정 가능한 Bomber Utility의 셋업 파일 이 전략을 빠르게 설치, 설정, 시작할 수 있도록 돕는 단계별 영상 매뉴얼 주의: 위의 모든 보너스를 받기 위해서는 MQL5 개인 메시지 시스템을 통해 판매자에게 연락해 주세요. 독창적인 커스텀 지표인 “Divergence Bomber(다이버전스 봄버)”를 소개합니다. 이 지표는 MACD 다이버전스(괴리) 전략을 기반으로 한 올인원(All-in-One) 거래 시스템입니다. 이 기술 지표의 주요 목적은 가격과 MACD 지표 간의 다이버전스를 감지하고, **향후 가격이 어느 방향으로 움직일지를 알려주는
SMC Intraday Formula
Kareem Abbas
5 (12)
먼저 솔직하게 말하겠습니다. 어떤 인디케이터도 단독으로 당신을 수익성 있게 만들어주지 않습니다. 누군가 그렇게 말한다면, 그는 당신에게 꿈을 파는 것입니다. 완벽한 매수/매도 화살표를 보여주는 모든 인디케이터는 완벽하게 보이도록 만들 수 있습니다 — 단지 올바른 과거 구간을 확대하고 승리한 거래만 캡처하면 됩니다. 우리는 그렇게 하지 않습니다.  SMC Intraday Formula는 도구입니다. 시장 구조를 읽고, 가장 높은 확률의 가격 구간을 표시하며, 현재 스마트 머니의 흐름이 어떻게 보이는지 아주 단순한 언어로 보여줍니다. 최종 결정은 여전히 당신이 합니다. 실행도 당신이 합니다. 하지만 이제는 희망이 아니라 정확성으로 거래하게 됩니다. 우리는 이 인디케이터를 지난 약 3년 동안 골드(XAUUSD) 및 주요 외환 통화쌍의 데이 트레이딩 스캘핑에 사용해 왔습니다. M1, M5, M15, M30에서 우리의 핵심 도구입니다. 이 도구는 미래를 예측하려 하지 않습니다 — 지금 형성
Entry In The Zone and SMC Multi Timeframe is a real-time 2-in-1 market analysis tool that combines market structure analysis and a No Repaint BUY / SELL signal system into a single indicator, built on Smart Money Concepts (SMC) — a widely adopted framework used by professional traders to understand market structure. This indicator helps you see the market more clearly, make decisions based on structure rather than guesswork, and focus on high-probability zones where price is more likely to react
Power Candles MT5
Daniel Stein
5 (8)
Power Candles V3 - 자체 최적화 강도 지표 파워 캔들 V3는 적용된 모든 차트에서 통화 및 상품의 강세를 실행 가능한 거래 계획으로 전환합니다. 단순히 캔들에 색상을 입히는 대신, 백그라운드에서 실시간 자동 최적화를 수행하여 현재 보고 있는 종목에 대한 최적의 손절매, 익절 및 신호 임계값을 제공합니다. 한 번의 클릭으로 실시간 거래에 적용할 수 있으며, 진입점, 손절매 및 익절 선이 정확한 가격에 맞춰 차트에 표시되고, 방향과 함께 알림이 발령됩니다. 이 도구는 Stein Investments 에코시스템의 일부입니다. 18개 이상의 도구와 함께 당신의 1대1 AI 트레이딩 멘토 Max.  항상 대기 중, 모든 인디케이터를 깊이 있게 이해, 무언가를 차근차근 생각해보고 싶은 순간에 도움을 줍니다.  https://stein.investments 에서 만나보세요 매 종가 바마다 3,000회 이상의 트레이딩 시뮬레이션. 9가지 강도 상태. 2가지 전략을 병렬로 테스트.
SignalTech MT5
Yue Wang
5 (26)
SignalTech MT5 is an unique fully rule based trading system for EURUSD, USDCHF, USDJPY, AUDUSD, NZDUSD, EURJPY, AUDJPY, NZDJPY, CADJPY.  All the winning trades with chart setups are published on the comments page. 2026-05 4107 Pips (Until 05-29 NY Closed) 2026-04 2243 Pips 2026-03 2165 Pips 2026-02 2937 Pips 2026-01 2624 Pips 2025-12 1174 Pips It can generate signals with Buy/Sell Arrows and Pop-Up/Sound Alerts. Each signal has clear Entry and Stop Loss levels, which should be automatically flag
소개       Quantum Breakout PRO   , 브레이크아웃 존 거래 방식을 변화시키는 획기적인 MQL5 지표! 13년 이상의 거래 경험을 가진 숙련된 트레이더 팀이 개발한       퀀텀 브레이크아웃 PRO       혁신적이고 역동적인 브레이크아웃 존 전략으로 거래 여정을 새로운 차원으로 끌어올리도록 설계되었습니다. Quantum Breakout Indicator는 5개의 이익 목표 영역이 있는 브레이크아웃 영역의 신호 화살표와 브레이크아웃 상자를 기반으로 한 손절 제안을 제공합니다. 초보자 거래자와 전문 거래자 모두에게 적합합니다. Quantum EA 채널:       여기를 클릭하세요 중요한! 구매 후 설치 매뉴얼을 받으려면 개인 메시지를 보내주십시오. 추천: 기간: M15 통화쌍: GBPJPY, EURJPY, USDJPY,NZDUSD, XAUUSD 계정 유형: 스프레드가 매우 낮은 ECN, Raw 또는 Razor 브로커 시간: GMT +3 중개인 :
이 제품은 2026년 시장에 맞게 업데이트되었으며 최신 MT5 빌드에 최적화되었습니다. 가격 업데이트 안내: Smart Trend Trading System은 현재 $99 에 제공됩니다. 다음 30회 구매 후 가격은 $199 로 인상됩니다. 특별 혜택: Smart Trend Trading System 구매 후 저에게 개인 메시지를 보내시면 Smart Universal EA를 무료 로 받을 수 있으며, Smart Trend 신호를 자동 거래로 전환할 수 있습니다. Smart Trend Trading System은 리페인트 없음, 재그리기 없음, 지연 없음의 완전한 트레이딩 시스템으로, 더 깨끗한 신호, 더 나은 추세 방향, 그리고 더 체계적인 시장 거래 방식을 원하는 트레이더를 위해 제작되었습니다. Online course , manual and download presets . 이 시스템은 추세 감지, 반전 구간, Smart Cloud, 트레일링 스톱 로직, 지지와 저항, 캔들 색
Quantum TrendPulse
Bogdan Ion Puscasu
5 (25)
SuperTrend   ,   RSI   ,   Stochastic   의 힘을 하나의 포괄적인 지표로 결합하여 트레이딩 잠재력을 극대화하는 궁극의 트레이딩 도구   인 Quantum TrendPulse를   소개합니다. 정밀성과 효율성을 추구하는 트레이더를 위해 설계된 이 지표는 시장 추세, 모멘텀 변화, 최적의 진입 및 종료 지점을 자신 있게 식별하는 데 도움이 됩니다. 주요 특징: SuperTrend 통합:   주요 시장 추세를 쉽게 따라가고 수익성의 물결을 타세요. RSI 정밀도:   매수 과다 및 매도 과다 수준을 감지하여 시장 반전 시점을 파악하는 데 적합하며 SuperTrend 필터로 사용 가능 확률적 정확도:   변동성이 큰 시장에서 숨겨진 기회를 찾기 위해 확률적 진동   을 활용하고 SuperTrend의 필터로 사용 다중 시간대 분석:   M5부터 H1 또는 H4까지 다양한 시간대에 걸쳐 시장을 최신 상태로 유지하세요. 맞춤형 알림:   맞춤형 거래 조건이 충족되면
Azimuth Pro
Ottaviano De Cicco
5 (7)
Azimuth Pro V2: Synthetic Fractal Structure and Confirmed Entries for MT5 Overview Azimuth Pro is a multi-level swing structure indicator by Merkava Labs . Four nested swing layers, swing-anchored VWAP, ABC pattern detection, three-timeframe structural filtering, and closed-bar confirmed entries — one chart, one workflow from micro-swings to macro-cycles. This is not a blind signal product. It is a structure-first workflow for traders who care about location, context, and timing. V2 Launch Offe
FX Trend MT5 NG
Daniel Stein
5 (6)
FX Trend NG: 차세대 멀티 마켓 트렌드 인텔리전스 개요 FX Trend NG 는 다중 시간 프레임 기반의 전문 트렌드 분석 및 시장 모니터링 도구입니다. 몇 초 만에 전체 시장 구조를 파악할 수 있도록 설계되었습니다. 여러 차트를 일일이 전환할 필요 없이, 어떤 종목이 추세에 있는지, 어디에서 모멘텀이 약화되고 있는지, 그리고 어떤 시간 프레임이 서로 정렬되어 있는지 즉시 확인할 수 있습니다. 출시 기념 특별 혜택 – FX Trend NG 를 $30 (6개월) 또는 $80 평생 라이선스 로 이용할 수 있습니다. 이미 Stein Investments 고객이신가요? -> 메시지를 보내 전용 고객 그룹에 참여하세요. 설정이나 사용 방법이 필요하신가요? -> Stein Investments 공식 페이지 를 방문하세요. 1. FX Trend NG가 특별한 이유 3단계 추세 로직 – 단순한 Buy / Sell이 아닙니다 • 대부분의 지표는 Buy 또는 Sell 두 가지 상태만 제
Gann Made Easy MT5
Oleg Rodin
5 (5)
Gann Made Easy 는 mr.의 이론을 사용하여 최고의 거래 원칙을 기반으로 하는 전문적이고 사용하기 쉬운 Forex 거래 시스템입니다. W.D. 간. 이 표시기는 Stop Loss 및 Take Profit Levels를 포함하여 정확한 BUY 및 SELL 신호를 제공합니다. PUSH 알림을 사용하여 이동 중에도 거래할 수 있습니다. 구매 후 거래 방법 안내 및 유용한 추가 지표를 무료로 받으시려면 저에게 연락주세요! 아마도 Gann 거래 방법에 대해 이미 여러 번 들었을 것입니다. 일반적으로 Gann의 이론은 초보자 거래자뿐만 아니라 이미 거래 경험이 있는 사람들에게도 매우 복잡한 것입니다. Gann의 거래 방식은 이론적으로 적용하기 쉽지 않기 때문입니다. 나는 그 지식을 연마하고 Forex 지표에 최고의 원칙을 적용하기 위해 몇 년을 보냈습니다. 표시기는 적용하기가 매우 쉽습니다. 차트에 첨부하고 간단한 거래 권장 사항을 따르기만 하면 됩니다. 지표는 지속적으로 시장 분석
M30/H1/H4 스윙 버전 출시 큰 움직임을 잡고 싶으신가요? Gold Signal Swing Pro (M30/H1/H4). 목표: 거래당 $20-$80+. https://www.mql5.com/en/market/product/177643 KURAMA GOLD SIGNAL PRO (MT5) — 7층 필터 탑재 XAUUSD 완벽 트레이딩 시스템 리페인트 없음. 리드로우 없음. 지연 없음. 모든 신호는 확정 후 변하지 않습니다. 구매자 한정 혜택: 매수 라이선스 구매자에게 AI Zone Radar ($59 상당) + PDF 매뉴얼을 무료 제공합니다. 구매 후 MQL5에서 메시지를 보내주세요. AI Zone Radar: https://www.mql5.com/en/market/product/175834 실제 골드 트레이더 커뮤니티에서 사용되며, 정확도와 사용 편의성으로 높은 평가를 받고 있습니다.
RelicusRoad Pro MT5
Relicus LLC
4.96 (24)
RelicusRoad Pro: 퀀트 시장 운영 체제 70% 할인 평생 이용권 (한정 시간) - 2,000명 이상의 트레이더와 함께하세요 왜 대부분의 트레이더는 "완벽한" 지표를 가지고도 실패할까요? 진공 상태에서 단일 개념 만으로 거래하기 때문입니다. 문맥 없는 신호는 도박입니다. 지속적인 승리를 위해서는 컨플루언스(중첩) 가 필요합니다. RelicusRoad Pro는 단순한 화살표 지표가 아닙니다. 완전한 퀀트 시장 생태계 입니다. 독점적인 변동성 모델링을 사용하여 가격이 이동하는 "공정 가치 로드"를 매핑하고, 단순 노이즈와 실제 구조적 돌파를 구분합니다. 추측은 그만두세요. 기관급 로드 로직으로 거래를 시작하세요. 핵심 엔진: "Road" 알고리즘 시스템의 중심에는 시장 상황에 실시간으로 적응하는 동적 변동성 채널인 Road Algo 가 있습니다. 세이프 라인(평형) 과 가격이 수학적으로 반전될 가능성이 높은 확장 레벨 을 투영합니다. Simple Road: 일반적인 시장을 위
Trend Catcher ind mt5
Ramil Minniakhmetov
5 (4)
트렌드 캐처 인디케이터 트렌드 캐처 인디케이터는 개발자가 자체 개발한 맞춤형 적응형 트렌드 분석 지표들을 조합하여 시장 가격 움직임을 분석합니다. 단기적인 노이즈를 제거하고 근본적인 모멘텀 강도, 변동성 확대, 가격 구조 움직임에 집중하여 진정한 시장 방향을 파악합니다. 또한 이동 평균, RSI, 변동성 필터와 같은 맞춤형 지표들을 활용하여 가격을 평활화하고 트렌드를 필터링합니다. 실제 운영 모니터링 및 기타 제품은 다음 링크에서 확인하실 수 있습니다:   https://www.mql5.com/en/users/mechanic/seller 텔레그램에서는 EA나 설정 파일을 판매하지 않습니다. 사기이니 주의하세요. 모든 설정 파일은 블로그에서 무료로 제공됩니다. 중요! 구매 후 즉시 연락 주시면 사용 방법 및 보너스를 드립니다!
ARIPoint
Temirlan Kdyrkhan
1 (1)
ARIPoint is a powerful trading companion designed to generate high-probability entry signals with dynamic TP/SL/DP levels based on volatility. Built-in performance tracking shows win/loss stats, PP1/PP2 hits, and success rates all updated live. Key Features: Buy/Sell signals with adaptive volatility bands Real-time TP/SL/DP levels based on ATR Built-in MA Filter with optional ATR/StdDev volatility Performance stats panel (Success, Profit/Loss, PP1/PP2) Alerts via popup, sound, push, or email Cu
Crystal Heikin Ashi Signals
Muhammad Jawad Shabir
5 (2)
Crystal Heikin Ashi Signals - Professional Trend & Signal Detection Indicator Advanced Heikin Ashi Visualization with Intelligent Signal System for Manual & Automated Trading Final Price: $149 ---------> Price goes up $10 after every 10 sales . Limited slots available — act fast . Overview Crystal Heikin Ashi Signals is a professional-grade MetaTrader 5 indicator that combines pure Heikin Ashi candle visualization with an advanced momentum-shift detection system. Designed for both manual traders
Atomic Analyst MT5
Issam Kassas
4.24 (34)
이 제품은 2026년 시장에 맞게 업데이트되었으며 최신 MT5 빌드에 최적화되었습니다. 가격 업데이트 안내: Atomic Analyst는 현재 $99 에 제공됩니다. 다음 30회 구매 후 가격은 $199 로 인상됩니다. 특별 혜택: Atomic Analyst 구매 후 저에게 개인 메시지를 보내시면 Smart Universal EA를 무료 로 받을 수 있으며, Atomic Analyst 신호를 자동 거래로 전환할 수 있습니다. Atomic Analyst는 리페인트 없음, 재그리기 없음, 지연 없음의 Price Action 거래 인디케이터로, 수동 거래, 신호 명확성, EA 자동화를 위해 설계되었습니다. User manual: settings, inputs and strategy. 가격 움직임, 강도, 모멘텀, 다중 시간대 방향 및 고급 필터를 분석하여 트레이더가 노이즈를 줄이고 약한 세팅을 피하며 더 체계적인 거래 결정을 내릴 수 있도록 돕습니다. 이 인디케이터는 복잡한 시장 계산
Reversion King Indicator
Eugen-alexandru Zibileanu
5 (4)
새로운 왕의 등장 - 인디케이터 + 주문 관리 표시(TP1 + TP2 + TP3) + 선택형 텔레그램 시그널 전송 기능 포함 (무료) (완전한 트레이딩 및 시그널 시스템) 골드를 위한 최고의 EA: Gold Slayer 이 인디케이터는 고급 전략, 사용자 지정 가능한 주문 관리 시스템, 그리고 엔벨로프 확장을 결합한 평균 회귀(mean reversion) 시스템을 포함하고 있습니다. 또한 RSI와 같은 여러 지능형 확인 필터를 통해 높은 확률의 반전 진입 구간을 포착하여 BUY 및 SELL 시그널을 제공합니다. 단순히 거래 방법만 배우는 것이 아니라, 여러 포지션을 효과적으로 관리하고 이전에 수익 중인 오픈 포지션으로 손실 거래를 커버하는 방법까지 익힐 수 있습니다. M5 전용으로 설계 및 최적화되었으며, 유동성이 풍부해 시그널이 더 깔끔하고 신뢰도 높은 BTCUSD와 XAUUSD에서 뛰어난 성능을 발휘합니다. 이 인디케이터는 ATR 기반으로 자동 계산된 진입가, 손절가, 익절가와
Market Structure Order Block Dashboard MT5는 시장 구조와 주요 가격 반응 구역을 차트에서 직접 읽고자 하는 트레이더를 위해 설계된 MT5 지표입니다. BOS, ChoCH, 오더 블록, Fair Value Gap (FVG), 유동성, Kill Zones, Volume Profile 그리고 빠른 분석을 위한 콤팩트한 대시보드를 결합합니다. 이 지표는 시장 구조, ICT 및 Smart Money 개념을 의사결정 프레임워크로 사용하는 트레이더를 대상으로 합니다. 추세 지속, 가능한 반전, 가격 불균형, 유동성 타겟 및 관심 구역을 보다 체계적으로 식별하는 데 도움을 줄 수 있습니다. 구매자를 위한 포함 리소스 구매 후 MQL5 개인 메시지로 요청하시면 완전한 PDF 사용 설명서와 파라미터 설정 팁을 제공해 드립니다. MQL5 개인 메시지를 통한 직접 기술 지원. 1.20 버전은 두 가지 주요 추가 기능을 제공합니다: Pending BOS / Pending
Smart Structure Concepts MT5
Cristhian Alexander Gaibor Cuasquer
5 (1)
이것은 영역을 그리고 당신이 추측하게 만드는 또 다른 구조 지표가 아닙니다. Smart Structure Concepts는 당신을 위해 시장을 읽습니다 — XAUUSD(금), 외환, 지수, 암호화폐 및 기타 모든 시장 에서 Smart Money Concepts (SMC / ICT) 구조를 실시간으로 표시합니다. 각 영역을 설정하기 위해 입력값에 들어갈 필요 없습니다: 차트의 인터랙티브 대시보드 패널 로, 단 한 번의 클릭으로 표시, 숨기기 또는 조정을 결정할 수 있습니다 — 속성을 열거나 지표를 다시 시작할 필요 없이. 이 도구는 MetaTrader 5용 성장하는 지표 및 패널 세트의 일부입니다 — 모두 11개 언어의 교육 툴팁과 모든 차트에 내장된 시각적 멘토를 갖추고 있습니다. 각 도구는 당신이 거래하는 동안 가르칩니다: 어떤 영역, 신호 또는 레벨에 마우스를 올리면 설명이 차트에 직접 나타납니다. 블랙박스 없음, 맹목적인 주문 없음. 거래하면서 배웁니다. 전체 라인업을 여기서
Trend Forecaster
Alexey Minkov
5 (7)
Trend Forecaster – Since 2023. The Trend Forecaster indicator utilizes a unique proprietary algorithm to determine entry points for a breakout trading strategy. The indicator identifies price clusters, analyzes price movement near levels, and provides a signal when the price breaks through a level. The Trend Forecaster indicator is suitable for all financial assets, including currencies (Forex), metals, stocks, indices, and cryptocurrencies. You can also adjust the indicator to work on any time
Stratos Pali mt5
Michela Russo
4.5 (8)
Stratos Pali Indicator is a revolutionary tool designed to enhance your trading strategy by accurately identifying market trends. This sophisticated indicator uses a unique algorithm to generate a complete histogram, which records when the trend is Long or Short. When a trend reversal occurs, an arrow appears, indicating the new direction of the trend. Important Information Revealed Leave a review and contact me via mql5 message to receive My Top 5 set files for Stratos Pali at no cost ! Down
Trend Screener Pro MT5
STE S.S.COMPANY
4.85 (104)
트렌드 표시기, 트렌드 트레이딩 및 필터링을 위한 획기적인 고유 솔루션, 하나의 도구 안에 내장된 모든 중요한 트렌드 기능! Forex, 상품, 암호 화폐, 지수 및 주식과 같은 모든 기호/도구에 사용할 수 있는 100% 다시 칠하지 않는 다중 시간 프레임 및 다중 통화 표시기입니다. Trend Screener는 차트에 점이 있는 화살표 추세 신호를 제공하는 효율적인 지표 추세 추종 지표입니다. 추세 분석기 표시기에서 사용할 수 있는 기능: 1. 트렌드 스캐너. 2. 최대 이익 분석이 있는 추세선. 3. 추세 통화 강도 측정기. 4. 경고가 있는 추세 반전 점. 5. 경고가 있는 강력한 추세 점. 6. 추세 화살표 Trend Screener Indicator가 있는 일일 분석 예, 일일 신호 성능...등은 여기에서 찾을 수 있습니다. 여기를 클릭하십시오. LIMITED TIME OFFER : Trend Screener Indicator는 50$ 및 평생 동안만 사용할 수 있습니다.
이 제품은 2026년 시장에 맞게 업데이트되었으며 최신 MT5 빌드에 최적화되었습니다. 가격 업데이트 안내: Smart Price Action Concepts는 현재 $200 에 제공됩니다. 다음 30회 구매 후 가격은 $299 로 인상됩니다. 특별 혜택: 구매 후 저에게 개인 메시지를 보내시면 무료 보너스 + 선물 을 받을 수 있습니다. 먼저, 이 트레이딩 도구는 리페인트 없음, 재그리기 없음, 지연 없음의 인디케이터이므로 전문적인 트레이딩에 적합하다는 점을 강조하고 싶습니다. Online course , and manual Smart Price Action Concepts Indicator는 초보자와 경험 많은 트레이더 모두에게 매우 강력한 도구입니다. 20개 이상의 유용한 인디케이터를 하나로 결합하고, Inner Circle Trader Analysis와 Smart Money Concepts Trading Strategies 같은 고급 트레이딩 아이디어를 통합합니다. 이 인디
PZ Swing Trading MT5
PZ TRADING SLU
5 (5)
Protect against whipsaws: revolutionize your swing trading approach Swing Trading is the first indicator designed to detect swings in the direction of the trend and possible reversal swings. It uses the baseline swing trading approach, widely described in trading literature. The indicator studies several price and time vectors to track the aggregate trend direction and detects situations in which the market is oversold or overbought and ready to correct. [ Installation Guide | Update Guide | Tro
PZ Trend Trading MT5
PZ TRADING SLU
3.8 (5)
Capture every opportunity: your go-to indicator for profitable trend trading Trend Trading is an indicator designed to profit as much as possible from trends taking place in the market, by timing pullbacks and breakouts. It finds trading opportunities by analyzing what the price is doing during established trends. [ Installation Guide | Update Guide | Troubleshooting | FAQ | All Products ] Trade financial markets with confidence and efficiency Profit from established trends without getting whips
Btmm state engine pro
Garry James Goodchild
5 (5)
BTMM State Engine Pro is a MetaTrader 5 indicator for traders who use the Beat The Market Maker approach: Asian session context, kill zone timing, level progression, peak formation detection, and a multi-pair scanner from a single chart. It combines cycle state logic with a built-in scanner dashboard so you do not need the same tool on many charts at once. What it does Draws the Asian session range; session times can follow broker server offset or be set in inputs. Tracks level progression (L
Meridian Pro
Ottaviano De Cicco
5 (2)
Meridian Pro 2.00: Professional Multi-Timeframe Trend Matrix for MT5 Meridian Pro 2.00 is a professional adaptive trend matrix for MetaTrader 5. It combines the original Meridian trend engine, a clean chart ribbon, closed-bar signal arrows, an 8-timeframe dashboard, Fuel momentum, weighted consensus, synthetic HTF processing and chart-native higher-timeframe context lines. The goal is simple: read current trend, multi-timeframe structure, strength, momentum and EA-ready state from one discipline
제작자의 제품 더 보기
Multi Chart Crosshairs
Robert Gerald Wood
5 (1)
This indicator is designed to make reviews of many charts on different timescales quicker, and easier to do. Track Time and Price across multiple charts Change Symbol on one chart and all other charts of the same symbol will be changed too. Easy to use, quick to master The indicator allows you to identify the price and time where the mouse pointer is on the current chart, across all other charts open on the same Symbol. This allows you to quickly see information on multiple charts whereas normal
Chart Drawing Cloner
Robert Gerald Wood
5 (2)
이 스크립트를 사용하면 추세선, 피보나치 되돌림 등과 같은 모든 유형의 그리기 개체를 하나 이상의 다른 차트에 복사할 수 있습니다. 기본적으로 스크립트는 현재 차트, 즉 스크립트가 적용된 차트의 모든 개체를 현재 로드된 동일한 심볼의 다른 차트에 복사합니다. 설정 목적지 시간 프레임 PERIOD_CURRENT 이외의 값으로 설정하면 스크립트가 적용된 차트와 동일한 심볼의 열린 차트에 객체를 복사합니다. 값을 특정 기간(예: PERIOD_D1)으로 설정하면 동일한 기호 AND 기간의 차트만 업데이트됩니다. CopyObjectsOfType 이것을 복사하려는 특정 유형의 개체로 설정할 수 있습니다. 그러면 해당 유형의 개체만 다른 차트에 복사됩니다. CopyIndicatorWindowObjects True로 설정하면 표시기 창의 개체도 복사됩니다. 이는 소스 차트와 동일한 지표를 동일한 순서로 갖는 두 번째 차트에 의존합니다. 마음의 내용에 차트 사이에 개체를 복제하십시오!
FREE
This script allows you to toggle the "Show Trade Levels" option, but for the current chart only. Normally, you can only change the setting using the Options -> Chart menu for ALL charts, but this script allows you to do it for a SINGLE chart. I'm using it when I take screenshots, because most of the time I'm not trying to show the trades, just some functionality of one of my other tools. Iif you need that functionality, then this script is very helpful! If the script helps you, please let me k
FREE
나는 Rob Smith의 TheStrat에 대해 배우는 동안 이 간단한 표시기를 만들었고 그것이 매우 유용하다고 생각하여 여러분과 공유해야겠다고 생각했습니다. 유용하다고 생각되면 MQL5에 게시한 다른 지표를 살펴보십시오. 이 지표는 차트에서 더 높은 기간에서 선택한 가격 수준을 보여주는 단일 선을 그립니다. 설정을 사용하면 표시되는 기간을 완전히 제어할 수 있지만   기본적으로 한 단계 위로 스케일을 이동하여 더 높은 기간 자체를 계산합니다. 예를 들어 H1 차트를 열면 H4 차트의 데이터가 표시됩니다. 설정 TrackTimeframe 가격 수준을 그릴 기간을 선택합니다. 기본 설정인 현재로 두면 적절한 기간이 선택됩니다. 선이 항상 위쪽으로 조정되므로 차트를 검토하고 기간 사이를 변경하는 경우 매우 유용합니다. 트랙값 아래 표준 가격 값에서 하나를 선택할 수 있습니다. 기본값은 시가입니다. PRICE_CLOSE 종가 PRICE_OPEN 시가 가격_높음 해당 기간의 최대 가격 P
FREE
A simple script that can delete all the drawing objects on a chart, or just the objects of a specific type. Settings: DeleteObjectsOfType By default the value will be blank which means ALL drawing objects on the chart will be deleted. If you only wish to delete specific types of drawing object, change this setting to the type of object to delete. For example, Fibonacci Retracement, Text, Label or Trend Line. Please see the demonstration video for more information.
FREE
TheStrat Patterns
Robert Gerald Wood
This indicator will draw patterns based on Rob Smith's The Strat as they emerge in real time on your chart. As price evolves, TheStrat offers 18 distinct price action patterns that can help you get good entries in the market. Each pattern involves two or three candles, and this indicator will draw a bounding box around the candles and name the pattern. The indicator also shows when a potential setup is forming, known by stratters as an Actionable signal. Candles Each candle is defined by its
TheStrat Levels
Robert Gerald Wood
This indicator draws the prior Highs and Lows for multiple timeframes, and can display potential Take Profit and Stop Loss levels. In Rob Smith's # The Strat   terms,   these are potential entry points, or alternatively potential targets for open positions. I like to use them in both ways. On a lower timeframe, say 5 minutes to get a good entry on a daily or weekly level, and then as a potential target. Very small stops required giving an excellent risk/reward ratio. Please watch the DEMO video
TheStrat Candles
Robert Gerald Wood
5 (1)
이 표시기는 다음을 기준으로 각 캔들 위 또는 아래에 레이블을 그립니다.       롭 스미스       더 스트랫       차트에서 시간이 지남에 따라 발전합니다. 가격이 변화함에 따라 캔들은 세 가지 상태 사이를 전환할 수 있습니다. 캔들이 처음 시가를 형성할 때 이전 캔들의 고저점 내에 완전히 위치하면 유형 1로 시작합니다. 시간이 지남에 따라 이전 캔들의 고점이나 저점을 돌파하면 유형 2, 그리고 가격 움직임이 변동적이고 방향성이 없다면 이전 양초의 반대편을 깨고 유형 3이 될 수 있습니다. 양초 각 양초는 이전 양초와의 관계로 정의됩니다. 유형 1 - 내부 캔들   - 캔들이 완전히 이전 캔들의 고점과 저점 내에 있습니다. 내부 양초는 시장이 우유부단한 지점에 있음을 보여줍니다. 유형 2 - 추세 양초   - 양초가 이전 양초의 고점 또는 저점 위나 아래로 확장되지만 둘 다는 아닙니다. 유형 3 - 외부 캔들   - 캔들이 이전 캔들의 고가와 저가를 모두 깨뜨렸
TheStrat FTFC
Robert Gerald Wood
FTFC는 Rob Smith의   The Strat   에서 정의한 전체 시간 프레임 연속성을 나타냅니다. 이 지표는 분기별, 월별, 주별, 일별 또는 시간별 시가 수준 중 가장 높은 값 중 하나와 해당 값 중 가장 낮은 값 중 두 번째로 차트에 두 개의 선을 그립니다. 이것은 거래가 한 방향으로 매우 강하게 될 가능성이 높은 위 또는 아래의 채널을 제공합니다. 라인 사이에서 가격 조치는 더 고르지 않으며 더 넓은 스톱을 사용할 수 있습니다. 고점과 저점 사이의 중간 지점을 표시하기 위해 세 번째 파선도 그려집니다. 시장이 특정 방향으로 가격을 밀고자 하기 때문에 지지나 저항을 찾기에 좋은 경우가 많습니다. 색상을 NONE으로 설정하여 선택하면 이 선을 끌 수 있습니다. 설정 분기별 수준 포함 일부 사람들이 무시하는 것을 선호하므로 분기별 시가를 계산에 포함하도록 선택할 수 있습니다. IncludeCurrentTimeframeOpen true인 경우 현재 표시된 기간이 H1, D1
Round Price Levels
Robert Gerald Wood
시장은 어림수를 정말 좋아하며 시장이 하락할 때 지지선 역할을 하거나 가격이 상승할 때 저항선 역할을 하는 경우가 많습니다. 이 지표는 라운드 값에서 가격 수준을 그리도록 설계되었습니다. 이 작업은 자동으로 수행되지만 이를 재정의하고 보고 싶은 수준을 결정할 수도 있습니다. 라운드 레벨은 10단계만큼 간단할 수 있으므로 10, 20, 30 등 또는 Forex에서 작업하는 경우 0.1 또는 0.01에서 변경 사항을 보고 싶을 수 있습니다. 표시기는 각각 다른 형식을 사용하여 Major 및 Minor라는 두 클래스의 라인을 그립니다. 이를 통해 레벨의 서로 다른 두 가지 변화 사이의 변화를 동시에 볼 수 있습니다. 알림 이 표시기에는 가격이 구성 가능한 거리 내에 있을 때 메이저, 마이너 또는 두 가격 수준에서 경보를 울리는 기능이 포함됩니다. 자동 설정 기본적으로 지표는 메이저 및 마이너 가격 모두에 대해 적절한 수준을 결정합니다. 언제든지 화면에 표시할 줄 수를 제어하는 구성 가
TheStrat Monitor
Robert Gerald Wood
3.67 (3)
If you've not already learnt about The Strat trading strategy , go google it now. I promise it won't be a waste of your time, and you will likely learn some new tricks whether you use it or not. OK, so now you know what TheStrat is, you will be able to understand what this indicator can do for you. Key Features In short, the Indicator will: Show Timeframe Continuity for all supported timeframes Supports two timeset views, Day trader and Swing trader Show when Full Timeframe Continuity is in pla
TheStrat TFC Monitor
Robert Gerald Wood
The Strat를   사용하여 거래할 때 여러 시간대를 주시하는 것이 중요합니다. 이 표시기는 각 기간에 대한 현재 캔들의 일일, 주간, 월간 및 분기별 상태를 표시합니다. 원 아이콘은 해당 기간의 캔들이 현재 내부 또는 TheStrat 용어로 유형 1임을 나타냅니다. 인사이드 데이 양초가 가격 움직임을 통합하고 있으며 우리는 범위의 돌파를 찾고 있습니다. 위 또는 아래를 가리키는 삼각형 아이콘은 추세 양초 또는 TheStrat 용어의 유형 2입니다. 추세 양초는 강세 또는 약세일 수 있으며, 이는 이전 양초 범위를 벗어나 현재 한 방향으로 추세를 보이고 있음을 나타냅니다. 사각형 아이콘은 아웃사이드 캔들 또는 Strat 용어로 Type 3입니다. 이것은 두 가지를 나타냅니다. 하나는 가격이 해당 기간에 대한 방향에 대해 결정되지 않았고 상당히 고르지 못할 가능성이 높으며, 두 번째는 더 낮은 기간에 짧은 반전을 거래할 수 있는 좋은 기회가 있을 가능성이 있다는 것입니다. 사각형은
Active Pivot Levels
Robert Gerald Wood
5 (1)
피벗 수준은 모든 시장에서 인정되는 잘 확립된 기술 수준입니다. 이 표시기는 모든 기호에 대해 현재 분기별, 월별, 주별, 일별 및 4시간별 피벗을 차트에 그립니다. 또한 각 기간에 대한 지원 및 저항 수준을 표시하고 수준 1에서 4까지 표시할 항목을 선택할 수 있습니다.     다음에서 피벗 유형을 선택합니다. 기준 도당 데마크 우디 피보나치 DeMark 피벗에는 원래 사양에 따라 단일 지원 및 저항 수준이 있습니다. 표시기 벽은 선이 가격에 닿은 경우 선이 그려지는 방식을 변경합니다. 이것은 매우 도움이 될 수 있으며 라인 지원 또는 저항의 강도는 일단 만지면 상당히 감소합니다. 각 기간에 대해 예측 피벗 수준을 표시하도록 선택할 수 있습니다. 이것은 일반 피벗과 동일한 계산을 사용하지만 현재 불완전한 기간에서 작동합니다. 따라서 가격이 이미 범위의 대부분을 커버하는 해당 기간이 끝날 무렵에 가장 잘 사용됩니다. 설정 모든 설정에 대한 자세한 내용은 별도의 블로그 게시물에서 확
ATR Extremes
Robert Gerald Wood
ATR(Average True Range)은 설정된 기간 동안 가격의 움직임을 측정하는 일반적으로 사용되는 지표입니다. 그러나 그것이 주는 가치는 어떤 종류의 경계에서도 정의되지 않기 때문에 손절매나 이익실현 계산 이외의 다른 용도로 사용하는 것은 거의 불가능합니다. 이 표시기는 표준 ATR 표시기이지만 극한값을 볼 수 있도록 백분위수 구분을 도입했습니다. 백분위수와 중앙값 분할 중에서 선택할 수 있습니다. 백분위수 수준 백분위수 수준은 1%, 5%, 20%, 50%, 80%, 95%, 99%로 표시되며 가격이 다른 모든 값과 관련된 위치를 보여줍니다. 예를 들어, 5% 수준은 선 아래에서 ATR 판독값의 5%만이 그렇게 낮아진다고 말하고 99%는 그 수준보다 높은 ATR 값 중 1%만이 그렇게 높다고 말합니다. 80% 이상에서는 새로운 거래에 대해 포지션 크기를 낮추기 시작할 수 있으며 95% 이상은 모멘텀이 바뀌기 전에 이익을 취하기에 좋은 시기일 수 있습니다. 분할
Range Exhaustion
Robert Gerald Wood
범위 소진은 가격이 현재 기간의 예상 범위를 충족하거나 초과할 때 발생합니다. 이 수준에서 가격은 기간 초반에 비해 모멘텀을 잃기 시작하므로 새로운 포지션을 취하지 않도록 하는 것이 좋습니다. 이 지표는 일별, 주별 및 월별 기간에 대한 수준을 표시하여 차트에서 이러한 일이 발생할 가능성이 있는 위치를 보여줍니다. 이러한 고갈 수준을 초과하는 가격을 보면 움직임의 모멘텀이 매우 강하고 더 높은 기간 수준으로 향하고 있음을 알 수 있습니다. 지표는 기본 설정에 따라 ATR(Average True Range) 또는 ADR(Average Range) 계산을 사용할 수 있습니다. 기본적으로 우리는 Forex 차트에서 더 잘 작동하는 ATR을 사용하지만 ADR은 주식 기반 지수 및 기호에서 우위를 점합니다. 표시기에는 아래에 설명된 여러 그리기 모드가 있어 필요에 맞게 조정할 수 있습니다. 설정 계산 모드 레벨 계산을 위해 ATR(AverageTrueRange) 또는 ADR(AverageD
TheStrat Candles MT5
Robert Gerald Wood
This indicator will draw a label above or below each candle based on   Rob Smith's   The Strat   as they develop over time on your chart. As price evolves, a candle can switch between three states. When the candle first opens, if it sits completely within the previous candles high and low, then it will start as a Type 1. As time moves on, if it breaks either the high or low of the previous candle, it will be come a type 2, and should the price action be volatile and directionless, it may then
TheStrat Levels MT5
Robert Gerald Wood
5 (1)
This indicator draws the prior Highs and Lows for multiple timeframes, and can display potential Take Profit and Stop Loss levels. In Rob Smith's # The Strat  terms, these are potential entry points, or alternatively potential targets for open positions. I like to use them in both ways. On a lower timeframe, say 5 minutes to get a good entry on a daily or weekly level, and then as a potential target. Very small stops required giving an excellent risk/reward ratio. Key Features  - Levels from Hou
TheStrat FTFC MT5
Robert Gerald Wood
FTFC는 Rob Smith의   The Strat   에서 정의한 전체 시간 프레임 연속성을 나타냅니다. 이 지표는 분기별, 월별, 주별, 일별 또는 시간별 시가 수준 중 가장 높은 값 중 하나와 해당 값 중 가장 낮은 값 중 두 번째로 차트에 두 개의 선을 그립니다. 이것은 거래가 한 방향으로 매우 강하게 될 가능성이 높은 위 또는 아래의 채널을 제공합니다. 라인 사이에서 가격 조치는 더 고르지 않으며 더 넓은 스톱을 사용할 수 있습니다. 최고점과 최저점 사이의 중간 지점을 표시하기 위해 세 번째 점선도 그려집니다. 시장이 특정 방향으로 가격을 밀고자 하기 때문에 지지나 저항을 찾기에 좋은 경우가 많습니다. 색상을 NONE으로 설정하여 선택하면 이 선을 끌 수 있습니다. 설정 분기별 수준 포함 일부 사람들이 무시하는 것을 선호하므로 분기별 시가를 계산에 포함하도록 선택할 수 있습니다. IncludeCurrentTimeframeOpen true인 경우 현재 표시된 기간이 H1,
TheStrat Patterns MT5
Robert Gerald Wood
This indicator will draw patterns based on   Rob Smith's   The Strat   as they emerge in real time on your chart. As price evolves,   TheStrat   offers 18 distinct price action patterns that can help you get good entries in the market. Each pattern involves two or three candles, and this indicator will draw a bounding box around the candles and name the pattern. The indicator also shows when a potential setup is forming, known by stratters as an Actionable signal. Candles Each candle is defin
TheStrat Monitor MT5
Robert Gerald Wood
5 (1)
Strat 거래 전략   에 대해 아직 배우지 않았다면 지금 Google로 이동하십시오. 나는 그것이 당신의 시간 낭비가 아닐 것이라고 약속하며, 당신이 그것을 사용하든 안 하든 몇 가지 새로운 요령을 배우게 될 것입니다. 자, 이제 TheStrat이 무엇인지 알았으니 이 지표가 당신을 위해 무엇을 할 수 있는지 이해할 수 있을 것입니다. 주요 특징들 즉, 지표는 다음을 수행합니다. 지원되는 모든 기간에 대한 기간 연속성 표시 Day trader와 Swing trader의 두 가지 시간 설정 보기를 지원합니다. 연속된 4개의 기간에 대해 전체 기간 연속성이 있는 경우 표시 각 기간에 대한 현재 캔들 상태 표시 모든 시간대에 현재 패턴이 있는 경우 표시 In-force 및 Actionable 패턴을 모두 표시합니다. 5초마다 업데이트(1초부터 설정 가능) 패널을 클릭하여 선택한 종목 및 기간에 대한 차트를 열 수 있습니다. 차트를 여는 데 사용할 차트 템플릿을 선택할 수 있습니다.
TheStrat TFC Monitor MT5
Robert Gerald Wood
5 (1)
The Strat를   사용하여 거래할 때 여러 시간대를 주시하는 것이 중요합니다. 이 표시기는 각 기간에 대한 현재 캔들의 일일, 주간, 월간 및 분기별 상태를 표시합니다. 원 아이콘은 해당 기간의 캔들이 현재 내부 또는 TheStrat 용어로 유형 1임을 나타냅니다. 인사이드 데이 양초가 가격 움직임을 통합하고 있으며 우리는 범위의 돌파를 찾고 있습니다. 위 또는 아래를 가리키는 삼각형 아이콘은 추세 양초 또는 TheStrat 용어의 유형 2입니다. 추세 양초는 강세 또는 약세일 수 있으며, 이는 이전 양초 범위를 벗어나 현재 한 방향으로 추세를 보이고 있음을 나타냅니다. 사각형 아이콘은 아웃사이드 캔들 또는 Strat 용어로 Type 3입니다. 이것은 두 가지를 나타냅니다. 하나는 가격이 해당 기간에 대한 방향에 대해 결정되지 않았고 상당히 고르지 못할 가능성이 높으며, 두 번째는 더 낮은 기간에 짧은 반전을 거래할 수 있는 좋은 기회가 있을 가능성이 있다는 것입니다. 사각형은
피벗 수준은 모든 시장에서 인정되는 잘 확립된 기술 수준입니다. 이 표시기는 모든 기호에 대해 현재 분기별, 월별, 주별, 일별 및 4시간별 피벗을 차트에 그립니다. 또한 각 기간에 대한 지원 및 저항 수준을 표시하고 수준 1에서 4까지 표시할 항목을 선택할 수 있습니다.     다음에서 피벗 유형을 선택합니다. 기준 도당 데마크 우디 피보나치 DeMark 피벗에는 원래 사양에 따라 단일 지원 및 저항 수준이 있습니다. 표시기 벽은 선이 가격에 닿은 경우 선이 그려지는 방식을 변경합니다. 이것은 매우 도움이 될 수 있으며 라인 지원 또는 저항의 강도는 일단 만지면 상당히 감소합니다. 각 기간에 대해 예측 피벗 수준을 표시하도록 선택할 수 있습니다. 이것은 일반 피벗과 동일한 계산을 사용하지만 현재 불완전한 기간에서 작동합니다. 따라서 가격이 이미 범위의 대부분을 커버하는 해당 기간이 끝날 무렵에 가장 잘 사용됩니다. 설정 모든 설정에 대한 자세한 내용은 별도의 블로그 게시물에서 확
Round Price Levels MT5
Robert Gerald Wood
시장은 어림수를 정말 좋아하며 시장이 하락할 때 지지선 역할을 하거나 가격이 상승할 때 저항선 역할을 하는 경우가 많습니다. 이 지표는 라운드 값에서 가격 수준을 그리도록 설계되었습니다. 이 작업은 자동으로 수행되지만 이를 재정의하고 보고 싶은 수준을 결정할 수도 있습니다. 라운드 레벨은 10단계만큼 간단할 수 있으므로 10, 20, 30 등 또는 Forex에서 작업하는 경우 0.1 또는 0.01에서 변경 사항을 보고 싶을 수 있습니다. 표시기는 각각 다른 형식을 사용하여 Major 및 Minor라는 두 클래스의 라인을 그립니다. 이를 통해 레벨의 서로 다른 두 가지 변화 사이의 변화를 동시에 볼 수 있습니다. 알림 이 표시기에는 가격이 구성 가능한 거리 내에 있을 때 메이저, 마이너 또는 두 가격 수준에서 경보를 울리는 기능이 포함됩니다. 자동 설정 기본적으로 지표는 메이저 및 마이너 가격 모두에 대해 적절한 수준을 결정합니다. 언제든지 화면에 표시할 줄 수를 제어하는 구성 가능한
ATR Extremes MT5
Robert Gerald Wood
ATR(Average True Range)은 일정 기간 동안 가격 변동량을 측정하는 데 일반적으로 사용되는 지표입니다. 그러나 그것이 제공하는 가치는 어떤 종류의 경계 내에서 정의되지 않으므로 손절매 또는 이익실현 계산 이외의 용도로 사용하는 것은 거의 불가능합니다. 이 지표는 표준 ATR 지표이지만 극단을 볼 수 있도록 백분위수 경계를 도입했습니다. 백분위수와 분할 중앙값이라고 하는 것 중에서 선택할 수 있습니다. 백분위수 수준 백분위수 수준은 1%, 5%, 20%, 50%, 80%, 95%, 99%로 표시되며 다른 모든 값과 관련하여 가격이 어디에 있는지 보여줍니다. 예를 들어, 5% 수준은 선 아래에서 ATR 판독값의 5%만 그만큼 낮아지고 99%는 해당 수준 위의 ATR 값 중 1%만 그만큼 높아진다는 의미입니다. 80% 이상에서는 새로운 거래를 위해 포지션 크기를 낮추기 시작할 수 있으며 95% 이상에서는 모멘텀이 바뀌기 전에 이익을 얻을 수 있는 좋은 시간일 수 있습니다.
Range Exhaustion MT5
Robert Gerald Wood
범위 소진은 가격이 현재 기간의 예상 범위를 충족하거나 초과할 때 발생합니다. 이 수준에서 가격은 기간 초반에 비해 모멘텀을 잃기 시작하므로 새로운 포지션을 취하지 않도록 하는 것이 좋습니다. 이 지표는 일별, 주별 및 월별 기간에 대한 수준을 표시하여 차트에서 이러한 일이 발생할 가능성이 있는 위치를 보여줍니다. 이러한 고갈 수준을 초과하는 가격을 보면 움직임의 모멘텀이 매우 강하고 더 높은 기간 수준으로 향하고 있음을 알 수 있습니다. 지표는 기본 설정에 따라 ATR(Average True Range) 또는 ADR(Average Range) 계산을 사용할 수 있습니다. 기본적으로 우리는 Forex 차트에서 더 잘 작동하는 ATR을 사용하지만 ADR은 주식 기반 지수 및 기호에서 우위를 점합니다. 표시기에는 아래에 설명된 여러 그리기 모드가 있어 필요에 맞게 조정할 수 있습니다. 설정 계산 모드 레벨 계산을 위해 ATR(AverageTrueRange) 또는 ADR(AverageD
필터:
damirAli
21
damirAli 2025.06.18 18:52 
 

사용자가 평가에 대한 코멘트를 남기지 않았습니다

Michel
177
Michel 2024.01.15 18:46 
 

Works as promised. I only could not change the colour input for crosshair (on mac) but thats all.

Forexezek
48
Forexezek 2023.11.14 10:51 
 

Hello! I bought the indicator. Very good! However, when I'm not using it, it would be nice if MT5's built-in crosshairs would work again to press the middle mouse button. It's deleting this feature for some reason. Could you modify it like this? Please

Sorry, but I didn't see that you already corrected it and wrote an answer. Thank you very much!

Could there possibly be a setting to set the crosshairs in the background/foreground? 100% perfect indicator after the repair! You are a perfect seller!

Robert Gerald Wood
5003
개발자의 답변 Robert Gerald Wood 2023.11.16 14:55
Hello, many thanks for the review, and thank you for spotting the bug. I have just published a fix and you should be able to download the new version now.
The ability to configure the crosshairs as in the background is also available now.
Igazi
151
Igazi 2023.05.26 19:05 
 

사용자가 평가에 대한 코멘트를 남기지 않았습니다

nabil84
129
nabil84 2023.03.08 09:54 
 

The Best Tool to track time across multiple charts and Instruments ( As per now its the only one available on the Market for MT5 to get the job done) .Highly Recommended for Traders who want to track specific timing on different instrument.

hvralpha
61
hvralpha 2022.07.03 16:42 
 

사용자가 평가에 대한 코멘트를 남기지 않았습니다

Robert Gerald Wood
5003
개발자의 답변 Robert Gerald Wood 2022.07.04 11:35
So glad you're happy, thank you for the review :)
Mike Louw
300
Mike Louw 2022.06.30 16:04 
 

사용자가 평가에 대한 코멘트를 남기지 않았습니다

Robert Gerald Wood
5003
개발자의 답변 Robert Gerald Wood 2022.06.30 16:55
Thanks for the review, glad you are happy with it 😊
Get Fit
64
Get Fit 2021.07.22 00:14 
 

I love this indicator. Great for how I trade using multiple time frame analysis. Great indicator. Thank you so much!!!!!

Robert Gerald Wood
5003
개발자의 답변 Robert Gerald Wood 2022.04.01 11:59
Thank you!
리뷰 답변