TheStrat Patterns MT5
- 지표
-
Robert Gerald Wood
 25년 이상 경력의 전문 소프트웨어 개발자, 이제 나만을 위한 도구를 만들고 더 많은 커뮤니티와 공유합니다.
내 제품에 대한 자세한 내용은 https://www.bunnywood.co.uk를 방문하십시오. - 버전: 1.40
- 업데이트됨: 28 7월 2021
- 활성화: 10
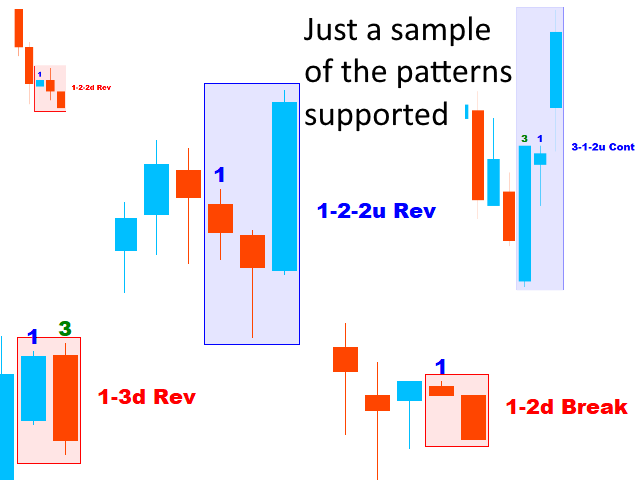
This indicator will draw patterns based on Rob Smith's The Strat as they emerge in real time on your chart.
As price evolves, TheStrat offers 18 distinct price action patterns that can help you get good entries in the market. Each pattern involves two or three candles, and this indicator will draw a bounding box around the candles and name the pattern.
The indicator also shows when a potential setup is forming, known by stratters as an Actionable signal.
Candles
Each candle is defined by its relationship to the previous candle.
Type 1 - Inside candle- The candle is entirely within the high and low of the previous candle. An inside candle shows the market is at a point of indecision.
Type 2 - Trending candle- The candle extends above or below either the High or low, but not both, of the previous candle.
Type 3 - Outside candle- The candle has broken both the high and low of the previous candle. An outside candle shows price is broadening, producing higher highs and lower lows on a lower timeframe.
Patterns
This indicator supports and displays the following patterns, see the comments section for a visual description:
ACTIONABLE
- 1-2-1 - Potential reversal into a 1-2-2
- 2-1-1 - Potential reversal or continuation into a 2-1-2
- 3-1-1 - Potential reversal into a 3-1-2
- 3-2-1 - Potential reversal into a 3-2-2
IN-FORCE
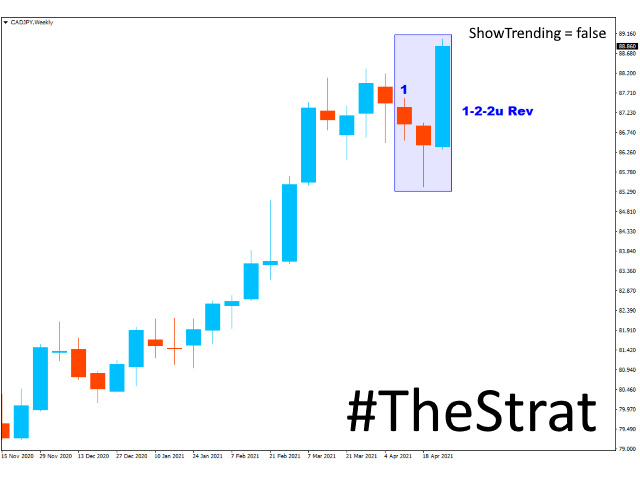
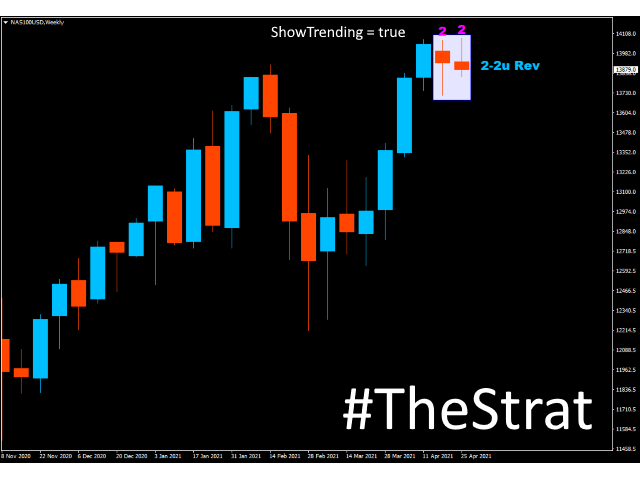
- 2-1-2u Continuation
- 2-1-2d Continuation
- 2-1-2u Reversal
- 2-1-2d Reversal
- 3-1-2u Reversal
- 3-1-2d Reversal
- 3-2-2u Reversal
- 3-2-2d Reversal
- 1-2-2d Reversal
- 1-2-2d Reversal
- 1-3u Reversal
- 1-3d Reversal
- 2-2u Reversal
- 2-2d Reversal
- 2-2u Continuation
- 2-2d Continuation
- 1-2u Breakout
- 1-2d Breakout
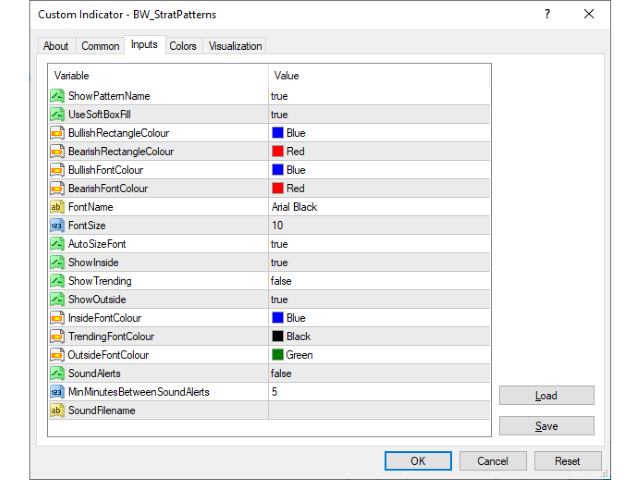
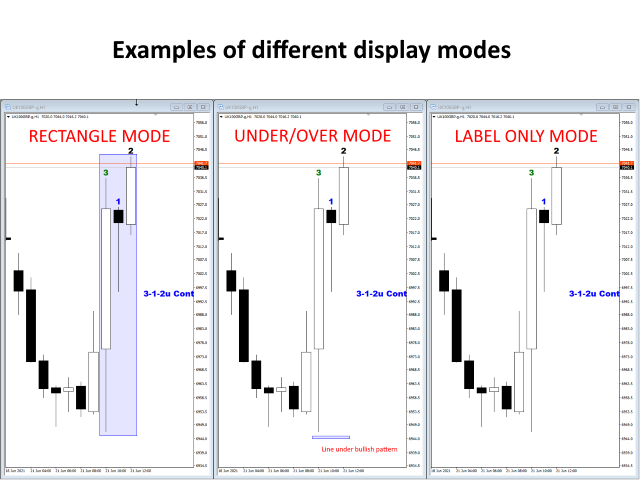
SETTINGS
Settings are available to allow you to customise the display to suit your own preferences.
We have published a document that describes the configuration settings here: https://www.mql5.com/en/blogs/post/746389
Please take the time to download the free Demo and try it out!