Active Pivot Levels MT5
- 지표
-
Robert Gerald Wood
 25년 이상 경력의 전문 소프트웨어 개발자, 이제 나만을 위한 도구를 만들고 더 많은 커뮤니티와 공유합니다.
내 제품에 대한 자세한 내용은 https://www.bunnywood.co.uk를 방문하십시오. - 버전: 1.30
- 업데이트됨: 4 11월 2021
- 활성화: 10
피벗 수준은 모든 시장에서 인정되는 잘 확립된 기술 수준입니다.
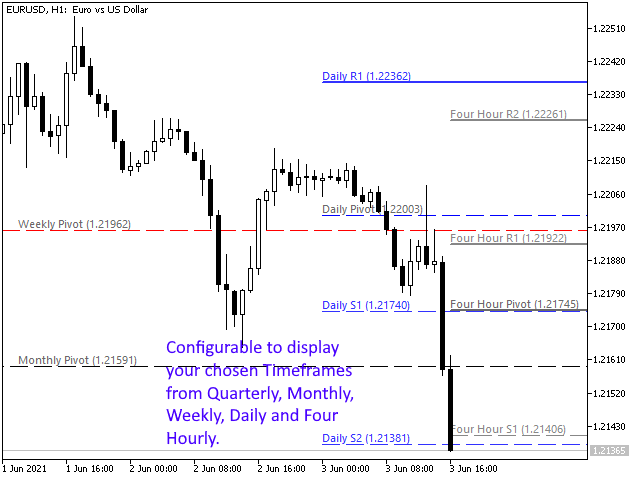
이 표시기는 모든 기호에 대해 현재 분기별, 월별, 주별, 일별 및 4시간별 피벗을 차트에 그립니다. 또한 각 기간에 대한 지원 및 저항 수준을 표시하고 수준 1에서 4까지 표시할 항목을 선택할 수 있습니다.
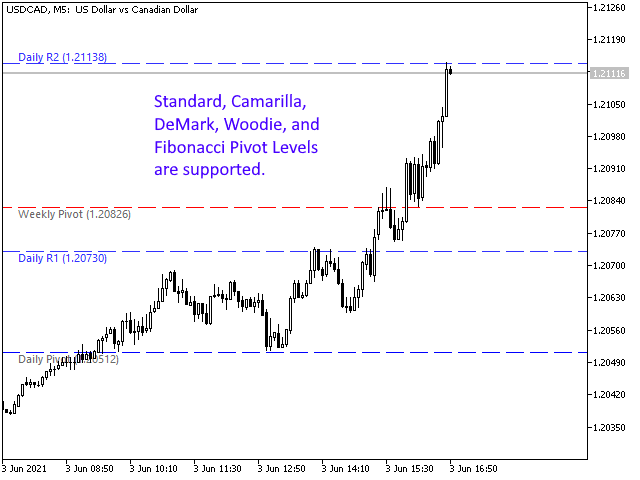
다음에서 피벗 유형을 선택합니다.
- 기준
- 도당
- 데마크
- 우디
- 피보나치
DeMark 피벗에는 원래 사양에 따라 단일 지원 및 저항 수준이 있습니다.
표시기 벽은 선이 가격에 닿은 경우 선이 그려지는 방식을 변경합니다. 이것은 매우 도움이 될 수 있으며 라인 지원 또는 저항의 강도는 일단 만지면 상당히 감소합니다.
각 기간에 대해 예측 피벗 수준을 표시하도록 선택할 수 있습니다. 이것은 일반 피벗과 동일한 계산을 사용하지만 현재 불완전한 기간에서 작동합니다. 따라서 가격이 이미 범위의 대부분을 커버하는 해당 기간이 끝날 무렵에 가장 잘 사용됩니다.
설정
모든 설정에 대한 자세한 내용은 별도의 블로그 게시물에서 확인할 수 있습니다.
https://www.mql5.com/en/blogs/post/746511
이것은 매우 구성 가능한 지표이므로 원하는 대로 작동시킬 수 있습니다.