Higher Timeframe Price Line

나는 Rob Smith의 TheStrat에 대해 배우는 동안 이 간단한 표시기를 만들었고 그것이 매우 유용하다고 생각하여 여러분과 공유해야겠다고 생각했습니다. 유용하다고 생각되면 MQL5에 게시한 다른 지표를 살펴보십시오.

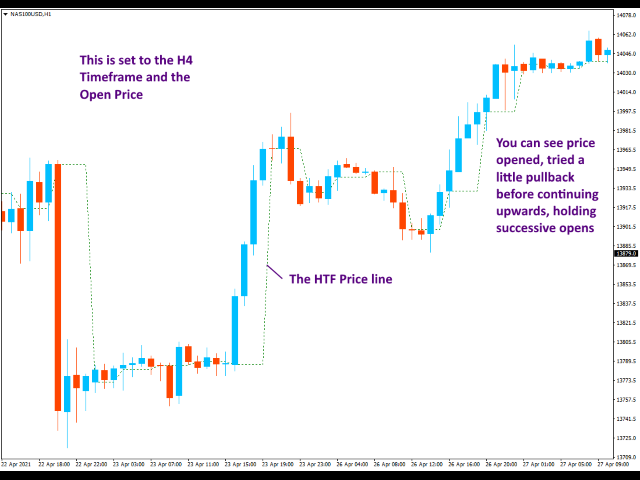
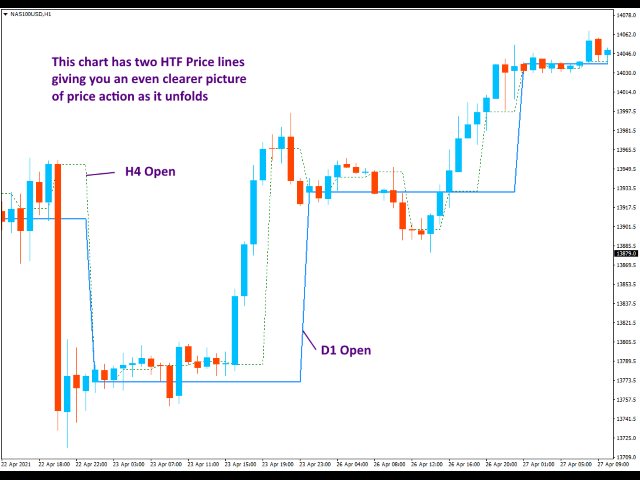
이 지표는 차트에서 더 높은 기간에서 선택한 가격 수준을 보여주는 단일 선을 그립니다.

설정을 사용하면 표시되는 기간을 완전히 제어할 수 있지만 기본적으로 한 단계 위로 스케일을 이동하여 더 높은 기간 자체를 계산합니다. 예를 들어 H1 차트를 열면 H4 차트의 데이터가 표시됩니다.


설정

TrackTimeframe

가격 수준을 그릴 기간을 선택합니다. 기본 설정인 현재로 두면 적절한 기간이 선택됩니다. 선이 항상 위쪽으로 조정되므로 차트를 검토하고 기간 사이를 변경하는 경우 매우 유용합니다.

트랙값

아래 표준 가격 값에서 하나를 선택할 수 있습니다. 기본값은 시가입니다.

PRICE_CLOSE

종가

PRICE_OPEN

시가

가격_높음

해당 기간의 최대 가격

PRICE_LOW

해당 기간의 최저 가격

PRICE_MEDIAN

중간 가격, (고가 + 저가)/2

PRICE_TYPICAL

일반적인 가격, (고가 + 저가 + 종가)/3

PRICE_WEIGHTED

가중 종가, (고가 + 저가 + 종가 + 종가)/4


추천 제품
Necessary for traders: tools and indicators Waves automatically calculate indicators, channel trend trading Perfect trend-wave automatic calculation channel calculation , MT4 Perfect trend-wave automatic calculation channel calculation , MT5 Local Trading copying Easy And Fast Copy , MT4 Easy And Fast Copy , MT5 Local Trading copying For DEMO Easy And Fast Copy , MT4 DEMO Easy And Fast Copy , MT5 DEMO The homeopathic indicator is also called the CCI indicator. The CCI indicator was proposed
FREE
Free automatic fibonacci
Tonny Obare
4.67 (49)
Free automatic Fibonacci is an indicator that automatically plots a Fibonacci retracement based on the number of bars you select on the BarsToScan setting in the indicator. The Fibonacci is automatically updated in real time as new highest and lowest values appears amongst the selected bars. You can select which level values to be displayed in the indicator settings. You can also select the color of the levels thus enabling the trader to be able to attach the indicator several times with differe
FREE
PZ Penta O MT4
PZ TRADING SLU
2.33 (3)
The Penta-O is a 6-point retracement harmonacci pattern which usually precedes big market movements. Penta-O patterns can expand and repaint quite a bit. To make things easier this indicator implements a twist: it waits for a donchian breakout in the right direction before signaling the trade. The end result is an otherwise repainting indicator with a very reliable trading signal. The donchian breakout period is entered as an input. [ Installation Guide | Update Guide | Troubleshooting | FAQ | A
FREE
AdvanceZigZag
Gholamreza Mohammad Mojaveri
5 (1)
AdvaneZigZag Indicator Are you tired of the limitations of the traditional ZigZag indicator? Meet AdvaneZigZag, the ultimate tool to simplify your market structure analysis and enhance your trading strategies. Designed with flexibility and precision in mind, AdvaneZigZag brings you advanced features to navigate the market with confidence. Key Features: 1. Enhanced Flexibility:    - While maintaining the familiar simplicity of the conventional ZigZag indicator, AdvaneZigZag offers superior a
FREE
Virtual Targets
Hoang Van Dien
3.83 (6)
This indicator is very useful for day traders or short term traders. No need to calculate the number of pips manually, just look at the chart and you will see the Virtual Take Profit / Virtual Stop Loss target line and evaluate whether the entry point is feasible to reach the intended target or not. Enter the intended Take Profit / Stop Loss pips for your trade. The indicator will display Virtual Take Profit / Virtual Stop Loss lines for you to easily see if the target is feasible or not.
FREE
Triple RSI
Pablo Leonardo Spata
1 (1)
LOOK AT THE FOLLOWING STRATEGY WITH THIS INDICATOR. Triple RSI is a tool that uses the classic Relative Strength Indicator, but in several timeframes to find market reversals.    1.  ️ Idea behind the indicator and its strategy: In Trading, be it Forex or any other asset, the ideal is to keep it simple, the simpler the better . The triple RSI strategy is one of the simple strategies that seek market returns. In our experience, where there is more money to always be won, is in the marke
FREE
Super Auto Fibonacci
Muhammed Emin Ugur
Discover the power of precision and efficiency in your trading with the " Super Auto Fibonacci " MT4 indicator. This cutting-edge tool is meticulously designed to enhance your technical analysis, providing you with invaluable insights to make informed trading decisions. Key Features: Automated Fibonacci Analysis: Say goodbye to the hassle of manual Fibonacci retracement and extension drawing. "Super Auto Fibonacci" instantly identifies and plots Fibonacci levels on your MT4 chart, saving you tim
FREE
Follow The Line
Oliver Gideon Amofa Appiah
3.94 (16)
FOLLOW THE LINE GET THE FULL VERSION HERE: https://www.mql5.com/en/market/product/36024 This indicator obeys the popular maxim that: "THE TREND IS YOUR FRIEND" It paints a GREEN line for BUY and also paints a RED line for SELL.  It gives alarms and alerts of all kinds. IT DOES NOT REPAINT and can be used for all currency pairs and timeframes. Yes, as easy and simple as that. Even a newbie can use it to make great and reliable trades. NB: For best results, get my other premium indicators for more
FREE
High Low Open Close MT4
Alexandre Borela
4.81 (21)
이 프로젝트를 좋아한다면 5 스타 리뷰를 남겨주세요. 이 지표는 열리고, 높은, 낮은 및 마감 가격을 지정합니다. 기간과 그것은 특정한 시간대를 위해 조정될 수 있습니다. 이들은 많은 기관 및 전문가에 의해 보는 중요한 수준입니다 상인은 당신이 더 많은 것일 수있는 장소를 알고 도움이 될 수 있습니다 이름 * 사용 가능한 기간: 이전 날. 이전 주. 지난 달. 이전 분기. 이전 연도. 또는: 현재 날. 현재 주. 현재 달. 현재 분기. 현재 년.
FREE
Email Drawdown Alert
Roman Starostin
5 (12)
Free informative Indicator-helper. It'll be usefull for traders who trade many symbols or using grid systems (Averaging or Martingale). Indicator counts drawdown as percent and currency separate. It has a number of settings: Count deposite drawdown according equity value and send e-mail or notifications to user if DD more than set; Sending e-mail when max open orders reached; Shows price and remaining pips amount before MarginCall on current chart and Account generally; Display summary trade lot
FREE
Auto Supply and Demand Oscillator is an indicator for MetaTrader 4 and MetaTrader 5 that detects supply and demand zones automatically and displays them as a single oscillator value at the bottom of the chart, instead of drawing rectangles directly on price. Concept Supply zones are price areas where strong selling created a sharp downward move away from a balance area. Demand zones are price areas where strong buying created a sharp upward move. Traditional implementations draw boxes on the
FREE
Features: 1- Get OB/OS Levels from Golden MA Levels 2- Wait for Buy/Sell Start Level Cross 3- Optional: Should price cross Mid Level in earlier bars 4- Optional: Crossing bar High/Medium Volume 5- Optional: MA Stacked to check up/down trend for current TF 6- Optional: NRTR higher timeframes aligned Check Detailed blog post explained: https://www.mql5.com/en/blogs/post/758457 Levels with Buffers available here: Golden MA Levels Indicator: https://www.mql5.com/en/market/product/119515 Note: Arr
FREE
OrderBlock TS Roman
Vladislav Vlastovskii
3.8 (5)
Индикатор строит блоки заказов (БЗ) по торговой системе (ТС) Романа. Поиск блоков осуществляется одновременно на двух таймфремах: текущем и старшем (определяемым в настройках). Для оптимизации и игнорирования устаревших блоков в настройках задается ограничение количества дней в пределах которых осуществляется поиск блоков. Блоки строятся по правилам ТС состоящем из трех шагов: какую свечу вынесли (что?); какой свечой вынесли (чем?); правило отрисовки (как?).
FREE
피봇 포인트 Fibo RSJ는 피보나치 비율을 사용하여 당일의 지지선과 저항선을 추적하는 지표입니다. 이 멋진 지표는 피보나치 비율을 사용하여 피벗 포인트를 통해 최대 7단계의 지지와 저항을 생성합니다. 가격이 작업의 가능한 진입/종료 지점을 인식할 수 있는 이 지원 및 저항의 각 수준을 어떻게 존중하는지 환상적입니다. 특징 최대 7단계 지원 및 7단계 저항 레벨의 색상을 개별적으로 설정 입력 피벗 유형 피벗 피보 RSJ1 = 피보 비율 1 계산 피벗 피보 RSJ2 = 피보 비율 2 계산 피벗 Fibo RSJ3 = Fibo 비율 3 계산 피벗 피보 클래식 = 클래식 피벗 계산 최소 피벗 수준 피벗 3 레벨 피벗 4 레벨 피벗 5 레벨 6단계 피벗 피벗 7 레벨 여전히 질문이 있는 경우 다이렉트 메시지로 저에게 연락하십시오: https://www.mql5.com/ko/users/robsjunqueira/
FREE
Check my paid tools they work great and I share Ea's based on them for free please r ate The Dual Timeframe RSI (Relative Strength Index) indicator is a novel trading tool that allows traders to monitor RSI readings from two different timeframes on a single chart. This dual perspective enables traders to identify potential trend confirmations and divergences more effectively. For instance, a trader might use a 1-hour RSI alongside a daily RSI to ensure that short-term trades align with the broa
FREE
Индикатор "Buy Sell zones x2" основан на принципе "остановка/разворот после сильного движения". Поэтому, как только обнаруживается сильное безоткатное движение, сразу после остановки - рисуется зона покупок/продаж. Зоны отрабатывают красиво. Или цена ретестит зону и улетает в космос, или пробивает зону насквозь и зона отрабатывается с другой стороны так же красиво.  Работает на всех таймфреймах. Лучше всего выглядит и отрабатывает на Н1.    Может использоваться как: индикатор зон, где лучше вс
FREE
KT Drawing Tool
Zhao Bing Wang
KT Drawing Tool - Pro Magnetic Snapping & MTF Auto-Coloring Stop struggling with manual alignment! Experience the ultimate precision for Price Action trading. The KT Drawing Tool is a professional assistant designed to replace the native MT4 drawing objects. It solves the common pain point of "imprecise levels" by automatically snapping your lines to the exact market prices. Whether you are trading Smart Money Concepts (SMC) , ICT , or classic Support & Resistance , this tool will significantly
FREE
Kombajn Signal
Mariusz Piotr Rodacki
The indicator still has a few bugs but is ready for testing. This is my first indicator that determines entry and exit points. The entry point is based on breaking the peaks determined by a channel indicating highs and lows (invisible channels). TP1 is a probable target at which most positions can be closed. The channel determining the opening and closing of positions is based on different assumptions. The red stop loss line is determined based on lows and highs. The stop loss can be adjusted a
FREE
SX Supply Demand Zones accurately identifies and draws high-probability Supply and Demand zones using a sophisticated algorithm. Unlike traditional indicators that clutter your chart, this indicator is designed with a focus on performance and a clean user experience. New Unique Feature: Interactive Legend System What truly sets this indicator apart from everything else is the Interactive Control Legend. You have a professional dashboard directly on your chart that allows you to: Show/Hide: Ins
FREE
Head and Shoulders Pattern Indicator - Your Key to Recognizing Trend Reversals Unlock the power of pattern recognition with the "Head and Shoulders Pattern Indicator." This cutting-edge tool, designed for MetaTrader, is your trusted ally in identifying one of the most powerful chart patterns in technical analysis. Whether you're a novice or an experienced trader, this indicator simplifies the process of spotting the Head and Shoulders pattern, allowing you to make informed trading decisions. Key
FREE
Market Profile 3
Hussien Abdeltwab Hussien Ryad
3 (2)
Market Profile 3 MetaTrader 4 indicator  — is a classic Market Profile implementation that can show the price density over time, outlining the most important price levels, value area, and control value of a given trading session. This indicator can be attached to timeframes between M1 and D1 and will show the Market Profile for daily, weekly, monthly, or even intraday sessions. Lower timeframes offer higher precision. Higher timeframes are recommended for better visibility. It is also possible t
FREE
Persian Ichimoku: The Next Generation of Fibonacci-Enhanced Trading Elevate your Ichimoku strategy with the most advanced and customizable Ichimoku indicator on the Market. The Persian Ichimoku is not just another Ichimoku cloner; it is a professional-grade trading powerhouse designed for traders who demand precision, flexibility, and deeper market insights. By merging classic Ichimoku Kinko Hyo logic with Fibonacci ratios and the innovative Quality Line , this tool redefines trend analysis. ###
Market Shift and FVG
Cruz Molina William Alberto
5 (2)
MT4 시장 구조 변화 및 공정 가치 갭(FVG) 지표 이 MT4 지표는 시장 구조 변화와 공정 가치 갭(FVG)을 식별하여 트레이더에게 잠재적인 거래 기회를 제공합니다. 모바일 알림을 통해 이러한 이벤트를 사용자에게 경고하여 변화하는 시장 상황에 신속하게 대응할 수 있도록 합니다. 주요 특징: 시장 구조 변화 감지: 스윙 고점/저점 돌파와 평균 대비 유의미한 캔들 몸통 크기를 기반으로 강세 및 약세 시장 구조 변화를 식별합니다. 차트의 위/아래 화살표로 시각화됩니다. 공정 가치 갭(FVG) 식별: 최근 3개 캔들의 가격 움직임을 기반으로 강세 및 약세 FVG를 감지합니다. FVG는 차트에서 색칠된 사각형으로 강조 표시됩니다. 모바일 알림: 시장 구조 변화와 FVG 형성 모두에 대한 실시간 모바일 알림을 수신하여 잠재적인 거래 설정을 놓치지 않도록 합니다. 사용자 정의 가능한 매개변수: 관찰 기간 (Lookback Period): 스윙 고점/저점 계산을 위한 관찰 기간을 조정하여
FREE
Wave Reversal Indicator
Vitalyi Belyh
4 (2)
Wave Reversal Indicator - determines the direction of trend waves and price reversals. The indicator shows wave movements and trend directions. It gives recommendations where to follow the trader, helps to follow the trading strategy. It is an addition to an intraday or medium-term strategy. Almost all parameters are selected for each time frame and are changed automatically, the only parameter for manual adjustment is the wavelength. Works on various trading instruments and timeframes, recomme
FREE
ENGLISH DESCRIPTION (MQL5 Standard Optimized) Product Name: TempestLightning – Elliott Wave Pro (MT4) [Subtitle: ZigZag Wave 3 Hunter | Market Health Monitor | USD Risk Logic] Introduction TempestLightning is a professional trading system designed to automate the complex Elliott Wave theory. Instead of guessing wave counts, this EA uses a precision ZigZag algorithm to identify the classic 1-2-3 structure and targets the highly profitable Wave 3 impulse. Stacked with a multi-factor filter engine
FREE
Traditional MACD MT4
Daniel Lewis
4.58 (55)
MACD indicator in MetaTrader 4/5 looks different than MACD does in most other charting software. That is because the MetaTrader 4/5 version of MACD displays the MACD line as a histogram when it is traditionally displayed as a line. Additionally, the MetaTrader 4/5 version computes the Signal line using an SMA, while according to MACD definition it is supposed to be an EMA. The MetaTrader 4/5 version also does not compute a true MACD Histogram (the difference between the MACD/Signal lines). This
FREE
Extremum Reverse Bar
Yurij Izyumov
2.8 (5)
This indicator has been created for finding the probable reversal points of the symbol price. A small candlestick reversal pattern is used it its operation in conjunction with a filter of extremums. The indicator is not redrawn! If the extremum filter is disabled, the indicator shows all points that have a pattern. If the extremum filter is enabled, the condition works – if the history Previous bars 1 candles back contains higher candles and they are farther than the Previous bars 2 candle, such
FREE
Simple RSI Forex Trading Strategy
Victor Manuel Valderrama Zamora
4 (1)
Diversify the risk in your trading account by combining our Expert Advisors. Build your own custom trading system here:   Simple Forex Trading Strategies The expert advisor opens trades when RSI indicator enter in oversold or overbought areas. The Stop Loss, Take Profit, and Trailing Stop are calculated based on the ATR indicator. The recommended currency pair is EURGBP and the recommended timeframe to operate and to do backtests is H4. This Expert Advisor can be profitable in any TimeFrame an
FREE
Railway Tracks Pattern — Reversal Pattern Indicator Railway Tracks Pattern is an indicator that automatically detects a powerful two-candle reversal pattern on the chart. It looks for two candles with opposite directions (bullish and bearish), similar in size, and with minimal wicks — a clear sign of momentum shift. How it works: The first candle is strong and directional. The second candle moves in the opposite direction and is of similar size. Both candles have small shadows (wicks). The
FREE
QuantumAlert Stoch Navigator is a free indicator available for MT4/MT5 platforms, its work is to provide "alerts" when the market is inside "overbought and oversold" regions in the form of "buy or sell" signals. This indicator comes with many customization options mentioned in the parameter section below, user can customise these parameters as needful. Join our   MQL5 group , where we share important news and updates. You are also welcome to join our private channel as well, contact me for the p
FREE
이 제품의 구매자들이 또한 구매함
Gann Made Easy
Oleg Rodin
4.83 (162)
Gann Made Easy 는 mr.의 이론을 사용하여 최고의 거래 원칙을 기반으로 하는 전문적이고 사용하기 쉬운 Forex 거래 시스템입니다. W.D. 간. 이 표시기는 Stop Loss 및 Take Profit Levels를 포함하여 정확한 BUY 및 SELL 신호를 제공합니다. PUSH 알림을 사용하여 이동 중에도 거래할 수 있습니다. 구매 후 거래 방법 안내 및 유용한 추가 지표를 무료로 받으시려면 저에게 연락주세요! 아마도 Gann 거래 방법에 대해 이미 여러 번 들었을 것입니다. 일반적으로 Gann의 이론은 초보자 거래자뿐만 아니라 이미 거래 경험이 있는 사람들에게도 매우 복잡한 것입니다. Gann의 거래 방식은 이론적으로 적용하기 쉽지 않기 때문입니다. 나는 그 지식을 연마하고 Forex 지표에 최고의 원칙을 적용하기 위해 몇 년을 보냈습니다. 표시기는 적용하기가 매우 쉽습니다. 차트에 첨부하고 간단한 거래 권장 사항을 따르기만 하면 됩니다. 지표는 지속적으로 시장 분석
M1 Sniper
Oleg Rodin
5 (22)
M1 SNIPER 는 사용하기 쉬운 거래 지표 시스템입니다. M1 시간대에 맞춰 설계된 화살표 지표입니다. 이 지표는 M1 시간대 스캘핑을 위한 단독 시스템으로 사용할 수 있으며, 기존 거래 시스템의 일부로도 사용할 수 있습니다. 이 거래 시스템은 M1 시간대 거래용으로 특별히 설계되었지만, 다른 시간대에도 사용할 수 있습니다. 원래는 XAUUSD와 BTCUSD 거래를 위해 이 방법을 설계했지만, 다른 시장 거래에도 유용하다는 것을 알게 되었습니다. 이 지표의 신호는 추세 방향과 반대로 거래될 수 있습니다. 저는 지표의 신호를 활용하여 양방향으로 거래할 수 있도록 돕는 특별한 거래 기법을 알려드립니다. 이 방법은 특별한 동적 지지선과 저항선 가격 영역을 활용하는 것을 기반으로 합니다. 구매하시면 M1 SNIPER 화살표 지표를 바로 다운로드하실 수 있습니다. 또한, 아래 스크린샷에 표시된 Apollo Dynamic SR 지표는 M1 SNIPER 도구를 사용하는 모든 사용자에게 무료로
Scalper Inside PRO
Alexey Minkov
4.74 (69)
Scalper Inside PRO – Since 2020. An exclusive indicator that utilizes an innovative algorithm to swiftly and accurately determine the market trend. The indicator automatically calculates opening, closing, and profit levels, providing detailed trading statistics. With these features, you can choose the most appropriate trading instrument for the current market conditions. Additionally, you can easily integrate your own arrow indicators into Scalper Inside Pro to quickly evaluate their statistics
PRO Renko System
Oleg Rodin
5 (30)
PRO Renko System 은 RENKO 차트 거래를 위해 특별히 고안된 매우 정확한 거래 시스템입니다. 이것은 다양한 거래 상품에 적용될 수있는 보편적 인 시스템입니다. 체계는 효과적으로 당신에게 정확한 반전 신호에 접근을 주는 소위 시장 소음을 중화합니다. 이 표시기는 사용하기가 매우 쉽고 신호 생성을 담당하는 매개 변수가 하나만 있습니다. 당신은 쉽게 당신의 선택의 어떤 무역 계기에 공구를 적응시킬 수 있고 renko 막대기의 크기. 나는 항상 당신이 내 소프트웨어로 수익성있게 거래 할 수 있도록 추가 지원을 제공 할 준비가되어 있습니다! 나는 당신에게 행복하고 수익성있는 거래를 기원합니다! 구매 후 저에게 연락하십시오! 내 렌코 차트 생성기를 보내드립니다. 또한 내 개인 권장 사항 및 시스템의 다른 모듈을 무료로 공유 할 것입니다!
Auto Optimized Parabolic RSI: 고급 3D 모멘텀 엔진 대부분의 개인 투자자용 보조지표는 시장의 변동성이 변하는 순간 무용지물이 되는 정적인 입력값에 의존하기 때문에 실패합니다. Auto Optimized Parabolic RSI는 자체적인 수학적 우위를 지속적으로 재계산하여 "보조지표 노후화" 문제를 해결하며, 기관급 퀀트 트레이딩의 적응력을 귀하의 MT5 터미널에 직접 제공합니다. 핵심 이점: 맞춤형 인메모리 3D 최적화   표준 자동 최적화 도구들은 일반적인 보조지표 호출로 터미널에 과부하를 일으켜 MT5 플랫폼을 멈추게 하는 경우가 많습니다. 이 도구는 이러한 병목 현상을 완전히 우회합니다. 맞춤형 네이티브 RAM 기반 계산기로 구축된 내부 엔진은 차트를 로드하거나 타임프레임을 변경할 때마다 빛처럼 빠른 3D 그리드 검색을 실행합니다. RSI 기간(주기), SAR 스텝(가속도) 및 SAR 최대치(속도 제한)를 동시에 스캔하여 플랫폼 지연 없이 수만 개의
Quantum Breakout Indicator PRO
Bogdan Ion Puscasu
4.96 (26)
소개       Quantum Breakout PRO   , 브레이크아웃 존 거래 방식을 변화시키는 획기적인 MQL5 지표! 13년 이상의 거래 경험을 가진 숙련된 트레이더 팀이 개발한   Quantum Breakout PRO는   혁신적이고 역동적인 브레이크아웃 영역 전략으로 거래 여정을 새로운 차원으로 끌어올리도록 설계되었습니다. Quantum Breakout Indicator는 5개의 이익 목표 영역이 있는 브레이크아웃 영역의 신호 화살표와 브레이크아웃 상자를 기반으로 한 손절 제안을 제공합니다. 초보자 거래자와 전문 거래자 모두에게 적합합니다. Quantum EA 채널:       여기를 클릭하세요 MT5 버전 :   여기를 클릭하세요 중요한! 구매 후 설치 매뉴얼을 받으려면 개인 메시지를 보내주십시오. 추천: 기간: M15 통화쌍: GBPJPY, EURJPY, USDJPY,NZDUSD, XAUUSD 계정 유형: 스프레드가 매우 낮은 ECN, Raw 또는 Razo
Market Makers
Mohamed Hassan
5 (4)
After purchase, contact me privately to receive 1 month of free testing with EA Forex Proton! This advanced MT4 trading robot automatically executes signals from any MT4 indicator, including Market Makers. The latest version also includes AI integration, allowing each trade signal to be analyzed using Artificial Intelligence. Live Signal with EA Forex Proton: Click here Market Makers is a powerful price action trading system designed to identify high-probability Buy and Sell opportunities based
이 지표를 구매하면 제 프로페셔널 트레이드 매니저를 무료로 드립니다. 우선 이 거래 시스템이 리페인팅, 리드로잉 및 레이그 인디케이터가 아니라는 점을 강조하는 것이 중요합니다. 이는 수동 및 로봇 거래 모두에 이상적인 것으로 만듭니다. 온라인 강좌, 설명서 및 프리셋 다운로드. "스마트 트렌드 트레이딩 시스템 MT5"은 새로운 및 경험이 풍부한 트레이더를 위해 맞춤형으로 제작된 종합적인 거래 솔루션입니다. 10개 이상의 프리미엄 인디케이터를 결합하고 7개 이상의 견고한 거래 전략을 특징으로 하여 다양한 시장 조건에 대한 다목적 선택이 가능합니다. 트렌드 추종 전략: 효과적인 트렌드 추이를 타기 위한 정확한 진입 및 손절 관리를 제공합니다. 반전 전략: 잠재적인 트렌드 반전을 식별하여 트레이더가 범위 시장을 활용할 수 있게 합니다. 스캘핑 전략: 빠르고 정확한 데이 트레이딩 및 단기 거래를 위해 설계되었습니다. 안정성: 모든 인디케이터가 리페인팅, 리드로잉 및 레이그가 아니므로 신뢰
PZ Harmonacci Patterns
PZ TRADING SLU
3.17 (6)
Trade smarter, not harder: Empower your trading with Harmonacci Patterns This is arguably the most complete harmonic price formation auto-recognition indicator you can find for the MetaTrader Platform. It detects 19 different patterns, takes fibonacci projections as seriously as you do, displays the Potential Reversal Zone (PRZ) and finds suitable stop-loss and take-profit levels. [ Installation Guide | Update Guide | Troubleshooting | FAQ | All Products  ] It detects 19 different harmonic pric
Please send me Direct message on MQL5 CHAT after purchasing the Indicator for Training and Installation Support There are some additional files that is important to use with the Indicator . So be sure to contact me after purchasing the Indicator So that I can add you for training and support . If you find any difficulty with installation then send me Direct message here So that I can connect with you via Anydesk or Teamview for the product installation. " Smart Order Block Indicator " to find m
GoldRush Trend Arrow Signal
Kirk Lee Holloway
5 (2)
GoldRush 트렌드 화살표 신호 GoldRush 트렌드 화살표 신호 지표는 XAU/USD 시장에서 고속 단기 스캘핑 트레이더를 위해 설계된 정밀한 실시간 트렌드 분석을 제공합니다. 1분 시간대에 특화되어 설계된 이 도구는 명확한 진입점을 표시하는 방향성 화살표를 제공하여 스캘퍼들이 변동성이 높은 시장 환경에서도 자신 있게 거래할 수 있도록 합니다. 이 지표는 PRIMARY 및 SECONDARY 경고 화살표로 구성됩니다. PRIMARY 신호는 추세 방향의 변화를 나타내는 흰색과 검은색 방향성 화살표이며, SECONDARY 신호는 PRIMARY 화살표가 지시하는 방향을 확인하고 잠재적인 거래 진입점을 표시하는 파란색과 빨간색 화살표입니다. 참고: 추세 방향이 변경된 후 PRIMARY 경고 화살표가 단 하나만 표시될 경우, 다수의 SECONDARY 파란색/빨간색 화살표가 표시될 수 있음을 유의해야 합니다. SECONDARY 신호는 신호 기준을 충족하는 어떤 캔들 이후에도 표시
Day Trader Master
Oleg Rodin
5 (15)
Day Trader Master 는 데이 트레이더를 위한 완벽한 거래 시스템입니다. 시스템은 두 개의 지표로 구성됩니다. 하나의 지표는 매수 및 매도를 위한 화살표 신호입니다. 얻을 수 있는 화살표 표시기입니다. 2차 지표를 무료로 드립니다. 두 번째 지표는 이러한 화살표와 함께 사용하도록 특별히 설계된 추세 지표입니다. 표시기는 반복하지 않고 늦지 않습니다! 이 시스템을 사용하는 것은 매우 간단합니다. 2색 선으로 표시되는 현재 추세 방향의 화살표 신호를 따라가기만 하면 됩니다. 파란색은 구매 추세입니다. 빨간색은 판매 추세입니다. 파란색 화살표는 매수 신호입니다. 빨간색 화살표는 매도 신호입니다. 추세선의 색상과 일치하려면 화살표의 색상과 신호의 방향이 필요합니다. 화살표 표시기는 주로 시간 간격 M5 및 M15에서 일중 거래를 위해 만들어졌습니다. 그러나 기술적으로 시스템은 다른 시간 간격으로 사용할 수 있습니다. 표시기에는 PUSH 메시지 기능이 있는 팝업 경고가 장착되어 있
Dynamic Scalper System
Vitalyi Belyh
5 (1)
" Dynamic Scalper System " 지표는 추세 파동 내에서 스캘핑 방식으로 거래하도록 설계되었습니다. 주요 통화쌍 및 금에서 테스트되었으며, 다른 거래 상품과의 호환성이 가능합니다. 추가적인 가격 변동 지원을 통해 추세에 따라 단기 포지션 진입 신호를 제공합니다. 지표의 원리 큰 화살표는 추세 방향을 결정합니다. 작은 화살표 형태의 스캘핑 신호를 생성하는 알고리즘은 추세 파동 내에서 작동합니다. 빨간색 화살표는 상승 방향을, 파란색 화살표는 하락 방향을 나타냅니다. 민감한 가격 변동선은 추세 방향으로 그려지며, 작은 화살표의 신호와 함께 작용합니다. 신호는 다음과 같이 작동합니다. 적절한 시점에 선이 나타나면 진입 신호가 형성되고, 선이 있는 동안 미결제 포지션을 유지하며, 완료되면 거래를 종료합니다. 권장되는 작업 시간대는 M1~H4입니다. 화살표는 현재 캔들에 형성되며, 다음 캔들이 이미 시작되었더라도 이전 캔들의 화살표는 다시 그려지지 않습니다. 입력 매개
PZ Trend Trading
PZ TRADING SLU
4.8 (5)
Capture every opportunity: your go-to indicator for profitable trend trading Trend Trading is an indicator designed to profit as much as possible from trends taking place in the market, by timing pullbacks and breakouts. It finds trading opportunities by analyzing what the price is doing during established trends. [ Installation Guide | Update Guide | Troubleshooting | FAQ | All Products ] Trade financial markets with confidence and efficiency Profit from established trends without getting whips
GOLD Impulse with Alert
Bernhard Schweigert
4.67 (12)
이 지표는 Advanced Currency IMPULSE with ALERT  +   Currency Strength Exotics  의 2가지 제품의 슈퍼 조합입니다. 그것은 모든 시간 프레임에 대해 작동하며 8개의 주요 통화와 하나의 기호에 대한 강약의 충동을 그래픽으로 보여줍니다! 이 표시기는 금, 이국적인 쌍, 상품, 지수 또는 선물과 같은 기호에 대한 통화 강도 가속을 표시하는 데 특화되어 있습니다. 금, 은, 오일, DAX, US30, MXN, TRY, CNH 등의 진정한 통화 강도 가속(충동 또는 속도)을 표시하기 위해 9번째 줄에 모든 기호를 추가할 수 있습니다. 새로운 기본 알고리즘을 기반으로 구축되어 잠재적인 거래를 훨씬 더 쉽게 식별하고 확인할 수 있습니다. 이는 통화의 강세 또는 약세가 가속되는지 여부를 그래픽으로 표시하고 가속 속도를 측정하기 때문입니다. 자동차의 속도계처럼 생각하면 됩니다. 가속화할 때 Forex 시장에서 동일한 일이 분명히 더 빠르
Advanced Supply Demand
Bernhard Schweigert
4.91 (300)
현재 40% 할인! 초보자나 전문 트레이더를 위한 최고의 솔루션! 이 보조지표는 우리가 다수의 독창적 기능과 새로운 공식을 통합한 독특하고 고품질이며 저렴한 거래 도구입니다. 이 업데이트를 통해 이중 시간대를 표시할 수 있습니다. 더 높은 TF를 표시할 수 있을 뿐만 아니라 차트 TF와 더 높은 TF 모두를 표시할 수 있습니다: 중첩 영역 표시. 모든 Supply Demand 트레이더들이 좋아할 것입니다. :) 중요한 정보 공개 Advanced Supply Demand의 잠재력을 극대화하려면 다음을 방문하십시오. https://www.mql5.com/ko/blogs/post/720245   진입 또는 목표의 명확한 트리거 포인트를 정확히 찾아냄으로 해서 거래가 어떻게 개선될지 상상해 보십시오. 새로운 알고리즘을 기반으로 매수자와 매도자 간의 잠재적인 불균형을 훨씬 더 쉽게 분간할 수 있습니다. 왜냐하면 가장 강한 공급영역과 가장 강한 수요 영역과 과거에 어떻게 진행 되었는지를(이전
CRT Candle Range Theory HTF MT4.   Ultimate CRT Indicator: Advanced ICT Concepts and Malaysian SnR Trading System Discounted   Price   $50  !!     Secure your lifetime access   now   before it switches to   subscription-only ! Master the Market Maker's Footprints with the Most Advanced Candle Range Theory Indicator Unlock the true power of   Smart Money Concepts (SMC)   and trade precisely like the institutions with the   Ultimate CRT Indicator . Built exclusively for serious traders, this indic
PZ Turning Points MT4
PZ TRADING SLU
1 (1)
Identify key turning points with reliable fractal analysis This indicator examines the price structure of fractals of different periods to determine possible reversal points in the market, providing timing to positional traders that already have a fundamental or technical valuation model. Unlike its younger brother, Reversal Fractals , this indicator won't miss reversals because of the period selected, and will find reversal fractals on a zig-zag fashion, ignoring those reversals which do not
PZ Support Resistance
PZ TRADING SLU
3.33 (3)
Unlock key market insights with automated support and resistance lines Tired of plotting support and resistance lines? This is a multi-timeframe indicator that detects and plots supports and resistance lines in the chart with the same precision as a human eye would. As price levels are tested over time and its importance increases, the lines become thicker and darker, making price leves easy to glance and evaluate. [ Installation Guide | Update Guide | Troubleshooting | FAQ | All Products ] Boos
Apex Break PRO MT4
Kestutis Balciunas
Apex Break PRO는 MetaTrader 4용 비재도색 피봇 추세선 돌파 지표입니다. 피봇 고점과 피봇 저점을 감지하고, 연속 피봇 사이에 동적 경사 추세선을 그리며, 확정된 봉 마감 시 가격이 해당 추세선을 돌파할 때 매수 및 매도 신호를 생성합니다. 모든 신호는 최대 4개의 독립적인 컨플루언스 레이어——EMA 추세, RSI 경계값, 거래량 급증 감지, ADX 추세 강도——를 통해 필터링되며, 트레이더가 몇 가지 조건이 일치했는지 즉시 확인할 수 있도록 스타 평가 시스템으로 등급이 매겨집니다. ATR 기반 손절매와 3개의 이익실현 레벨이 각 신호에 대한 체계적인 리스크 관리를 제공하며, 실시간 대시보드는 방향, 필터 상태, 도달 체크 표시가 포함된 거래 레벨 추적을 표시합니다. MT5 버전 확인:  Apex Break PRO MT5 더 많은 제품 보기:   전체 제 품 목록 실시간 예제와 새로운 도구를 확인하려면 프로필을 방문하여 업데이트를 놓치지 않도록 친구 요청을 보내세
They say history repeats itself. What if you could prove it in real-time? The Propfolio Ghost Pattern is an advanced algorithmic pattern-matching engine. It empowers you to select any current price action structure on your chart and instantly scan thousands of historical candles to find the exact moment in the past where the market did the exact same thing. Once it finds the highest probability match, it projects the historical outcome into the future as "Ghost Candles"—giving you a highly calcu
Atomic Analyst
Issam Kassas
5 (5)
우선적으로 언급할 점은이 거래 지표가 다시 그리지 않고 지연되지 않으며 이를 통해 수동 및 로봇 거래 모두에 이상적이라는 점입니다. 사용자 매뉴얼: 설정, 입력 및 전략. Atomic Analyst는 가격의 강도와 모멘텀을 활용하여 시장에서 더 나은 이점을 찾는 PA Price Action Indicator입니다. 고급 필터를 장착하여 잡음과 거짓 신호를 제거하고 거래 잠재력을 높이는 데 도움이 됩니다. 복잡한 지표의 다중 레이어를 사용하여 Atomic Analyst는 차트를 스캔하고 복잡한 수학적 계산을 간단한 신호와 색상으로 변환하여 초보 트레이더가 이해하고 일관된 거래 결정을 내릴 수 있도록합니다. "Atomic Analyst"는 새로운 및 경험이 풍부한 트레이더를위한 종합적인 거래 솔루션입니다. 프리미엄 지표와 최고 수준의 기능을 하나의 거래 전략에 결합하여 모든 종류의 트레이더에 대한 다재다능한 선택지가되었습니다. 인트라데이 거래 및 스캘핑 전략 : 빠르고 정확한 일일
현재 26% 할인!! 이 지표는 두 주요 지표( Advanced Currency Strength 28   &  Advanced Currency IMPULSE with ALERT )의 슈퍼 조합입니다. TICK-UNITS에 대한 통화 강도 값과 28개 Forex 쌍에 대한 경고 신호를 보여줍니다. 11개의 다른 틱 단위를 사용할 수 있습니다. 1, 2, 3, 4, 5, 6, 10, 12, 15, 20, 30초입니다. 두 번째 타이머 내에 최소 1틱이 있으면 하위 창의 Tick-Unit 막대가 표시되고 왼쪽으로 이동합니다. 단 하나의 차트로 28 Forex 페어를 스캘핑할 수 있습니다! 스캘핑 기회의 정확한 트리거 포인트를 정확히 찾아낼 수 있기 때문에 스캘핑이 어떻게 개선될지 상상해 보십시오. 그것은 1분보다 낮은 기간에 작동하는 시장의 첫 번째 통화 강도 지표입니다! 그것은 시장에 빠르게 들어오고 나가고 시장에서 작은 핍을 잘라내기를 원하는 빠른 스캘퍼를 위한 것입니다. 사
KURAMA GOLD SIGNAL PRO (MT4) — 7층 필터, 자동 TP/SL, 품질 점수를 탑재한 XAUUSD 완벽 트레이딩 시스템 리페인트 없음. 리드로우 없음. 지연 없음. 모든 신호는 영구적입니다. 보이는 것이 그대로입니다. 보너스: 영구 라이선스 구매자에게 AI Zone Radar ($59 상당) + 전체 PDF 매뉴얼을 무료 제공. 구매 후 메시지를 보내주세요. AI Zone Radar: https://www.mql5.com/en/market/product/175834 트레이더의 신뢰: 활발한 골드 트레이더 커뮤니티에서 이미 사용 중. 정확도와 사용 편의성으로 호평을 받고 있습니다. 당신의 문제 — 그리고 해결책 골드가 하루 $30-50 움직인다는 걸 알고 있죠. 여기서 돈을 벌 수 있다는 것도. 하지만: - 너무 일찍 진입해서 가격이 당신 방향으로 가기 전에 $10 손절당함 - MA 터치마다 진입하지만 절반은 실패 - TP/SL 시스템이 없어서 너무
구매 후 저에게 연락하여 이 지표를 기반으로 한 보너스 EA를 받으십시오. Self Optimizing Double MA Strategy는 파라미터 추측을 없애기 위해 설계된 전문가 수준의 트레이딩 도구입니다. 내장된 자동 최적화 엔진으로 구동되며, 통계적 우위를 유지하기 위해 백그라운드에서 수천 개의 파라미터 조합을 시뮬레이션하여 변화하는 시장 조건에 지속적으로 적응합니다. 정적이고 구식인 설정에 의존하는 대신, 이 인디케이터는 자체 로직을 동적으로 업데이트하여 현재 시간대와 종목에 가장 수익성 있는 구성을 찾습니다. 주요 기능 내장된 자동 최적화: 시스템은 단기 MA, 장기 MA 및 RSI 기간을 주기적으로 다시 계산하여, 선택한 업데이트 빈도에 따라 설정이 항상 현재 시장 리듬과 일치하도록 보장합니다. MA 다이버전스 필터: 이동평균선이 활발하게 발산(확장)할 때만 시그널을 검증하는 핵심 추세 강도 지표입니다. 이는 평균선이 수렴하거나 평탄한 횡보장에서는 잘못된 진입을 방지합
Gold Scalper Super
Aleksandr Makarov
5 (2)
Gold Scalper Super is an easy-to-use trading system. The indicator can be used as a standalone scalping system on the M1 time frame, as well as part of your existing trading system. Bonus: when purchasing an indicator, Trend Arrow Super is provided free of charge, write to us after purchase. The indicator 100% does not repaint!!! If a signal appears, it does not disappear! Unlike indicators with redrawing, which lead to the loss of a deposit, because they can show a signal and then remove it.
Advanced Currency Strength28 Indicator
Bernhard Schweigert
4.91 (657)
현재 40% 할인 초보자 또는 전문가 트레이더를 위한 최고의 솔루션! 이 지표는 우리가 독점 기능과 새로운 공식을 통합했기 때문에 독특하고 고품질이며 저렴한 거래 도구입니다. 단 하나의 차트로 28 Forex 쌍의 통화 강도를 읽을 수 있습니다! 새로운 추세 또는 스캘핑 기회의 정확한 트리거 포인트를 정확히 찾아낼 수 있기 때문에 거래가 어떻게 개선될지 상상해 보십시오. 사용 설명서: 여기를 클릭  https://www.mql5.com/en/blogs/post/697384 그것이 첫 번째, 원본입니다! 쓸모없는 지망생 클론을 사지 마십시오. 더 스페셜  강력한 통화 모멘텀을 보여주는 하위 창의 화살표 GAP가 거래를 안내합니다! 기본 또는 호가 통화가 과매도/과매도 영역(외부 시장 피보나치 수준)에 있을 때 개별 차트의 기본 창에 경고 표시가 나타납니다. 통화 강도가 외부 범위에서 떨어질 때 풀백/반전 경고. 교차 패턴의 특별 경고 추세를 빠르게 볼 수 있는 다중 시간
Cyclic Impulse
Vitalyi Belyh
차트를 구조화하고 주기적인 가격 변동을 식별하는 기술 지표입니다. 모든 차트에서 작업할 수 있습니다. 다양한 유형의 알림. 그래프 자체에도 추가 화살표가 있습니다. 역사를 재구성하지 않고, 촛불을 닫는 작업에 임한다. M5 이상에서 권장되는 TF입니다. 사용 및 구성이 쉬운 매개변수입니다. 매개변수가 다른 2개의 지표를 사용하는 경우, 다른 지표 없이 해당 지표만 사용할 수 있습니다. 2개의 입력 매개변수가 있습니다 주기성과 신호 지속 시간 이 2개의 매개변수는 차트 구조의 처리와 관련이 있습니다. Cyclicity - 역전 주기가 얼마나 자주 바뀌는지 조절하고 주기를 매끄럽게 합니다. Signal duration - 최소 숫자에서는 가격 움직임의 충격을 감지하고, 최대 숫자에서는 장기적 추세 움직임을 감지합니다.. --------------------------------
KuKl
IGOR KIRIANEN
The indicator is built on a non-standard Zig Zag, it draws accumulations after which if the price leaves this zone and a test of this zone occurs, then a sound signal is given and an arrow appears - after the test candle closes.The indicator does not redraw its signals, it is very easy to use, there are only three settings 1- this is the zig zag parameter 2- this is the minimum price exit from the zone 3- this is the maximum price exit from the zone. The lower the parameter for Zig Zag, the more
ZigZag Lines MTF
Taras Slobodyanik
4.38 (13)
Multi timeframe ZigZag indicator. It displays the support/resistance horizontal lines and their breakouts, as well as draws the current targets of the market. It can also display lines of the Fractals indicator and candles from other periods (up to Quarterly). So, you can actually see the supply and demand levels. Indicator – connects key lows and highs to show trend lines. You can also use it as indicator for the Break of Structure(BOS) & Market Structure Shift(MSS). The indicator redraws the
제작자의 제품 더 보기
Multi Chart Crosshairs MT5
Robert Gerald Wood
5 (4)
이 표시기는 다양한 시간 척도의 많은 차트를 더 빠르고 쉽게 검토할 수 있도록 설계되었습니다. 여러 차트에서 시간 및 가격 추적 한 차트의 심볼 변경 및 동일한 심볼의 다른 모든 차트도 변경됩니다. 사용하기 쉽고 빠르게 마스터하기 표시기를 사용하면 동일한 기호에 열려 있는 다른 모든 차트에서 마우스 포인터가 현재 차트에 있는 가격과 시간을 식별할 수 있습니다. 이렇게 하면 일반적으로 동일한 위치를 식별하는 데 약간의 시간을 소비해야 하는 반면 여러 해도에 대한 정보를 빠르게 볼 수 있습니다. 열려 있는 모든 차트에서 시간만 추적하도록 선택할 수도 있습니다. 이를 통해 다이버전스 헌팅 시 쉽게 탐색할 수 있습니다. 한 차트에서 심볼을 변경하면 동일한 심볼의 다른 모든 차트가 해당 기간 설정을 유지하면서 새 심볼로 전환됩니다. 사용하는 방법 차트를 검토할 때 추세와 거래 수준을 식별하기 위해 여러 기간을 살펴보는 것을 좋아합니다. 나는 그것을 돕기 위해 이 도구를 만들었고 또한 장기간에
Multi Chart Crosshairs
Robert Gerald Wood
5 (1)
This indicator is designed to make reviews of many charts on different timescales quicker, and easier to do. Track Time and Price across multiple charts Change Symbol on one chart and all other charts of the same symbol will be changed too. Easy to use, quick to master The indicator allows you to identify the price and time where the mouse pointer is on the current chart, across all other charts open on the same Symbol. This allows you to quickly see information on multiple charts whereas normal
Chart Drawing Cloner
Robert Gerald Wood
5 (2)
이 스크립트를 사용하면 추세선, 피보나치 되돌림 등과 같은 모든 유형의 그리기 개체를 하나 이상의 다른 차트에 복사할 수 있습니다. 기본적으로 스크립트는 현재 차트, 즉 스크립트가 적용된 차트의 모든 개체를 현재 로드된 동일한 심볼의 다른 차트에 복사합니다. 설정 목적지 시간 프레임 PERIOD_CURRENT 이외의 값으로 설정하면 스크립트가 적용된 차트와 동일한 심볼의 열린 차트에 객체를 복사합니다. 값을 특정 기간(예: PERIOD_D1)으로 설정하면 동일한 기호 AND 기간의 차트만 업데이트됩니다. CopyObjectsOfType 이것을 복사하려는 특정 유형의 개체로 설정할 수 있습니다. 그러면 해당 유형의 개체만 다른 차트에 복사됩니다. CopyIndicatorWindowObjects True로 설정하면 표시기 창의 개체도 복사됩니다. 이는 소스 차트와 동일한 지표를 동일한 순서로 갖는 두 번째 차트에 의존합니다. 마음의 내용에 차트 사이에 개체를 복제하십시오!
FREE
This script allows you to toggle the "Show Trade Levels" option, but for the current chart only. Normally, you can only change the setting using the Options -> Chart menu for ALL charts, but this script allows you to do it for a SINGLE chart. I'm using it when I take screenshots, because most of the time I'm not trying to show the trades, just some functionality of one of my other tools. Iif you need that functionality, then this script is very helpful! If the script helps you, please let me k
FREE
A simple script that can delete all the drawing objects on a chart, or just the objects of a specific type. Settings: DeleteObjectsOfType By default the value will be blank which means ALL drawing objects on the chart will be deleted. If you only wish to delete specific types of drawing object, change this setting to the type of object to delete. For example, Fibonacci Retracement, Text, Label or Trend Line. Please see the demonstration video for more information.
FREE
TheStrat Patterns
Robert Gerald Wood
This indicator will draw patterns based on Rob Smith's The Strat as they emerge in real time on your chart. As price evolves, TheStrat offers 18 distinct price action patterns that can help you get good entries in the market. Each pattern involves two or three candles, and this indicator will draw a bounding box around the candles and name the pattern. The indicator also shows when a potential setup is forming, known by stratters as an Actionable signal. Candles Each candle is defined by its
TheStrat Levels
Robert Gerald Wood
This indicator draws the prior Highs and Lows for multiple timeframes, and can display potential Take Profit and Stop Loss levels. In Rob Smith's # The Strat   terms,   these are potential entry points, or alternatively potential targets for open positions. I like to use them in both ways. On a lower timeframe, say 5 minutes to get a good entry on a daily or weekly level, and then as a potential target. Very small stops required giving an excellent risk/reward ratio. Please watch the DEMO video
TheStrat Candles
Robert Gerald Wood
5 (1)
이 표시기는 다음을 기준으로 각 캔들 위 또는 아래에 레이블을 그립니다.       롭 스미스       더 스트랫       차트에서 시간이 지남에 따라 발전합니다. 가격이 변화함에 따라 캔들은 세 가지 상태 사이를 전환할 수 있습니다. 캔들이 처음 시가를 형성할 때 이전 캔들의 고저점 내에 완전히 위치하면 유형 1로 시작합니다. 시간이 지남에 따라 이전 캔들의 고점이나 저점을 돌파하면 유형 2, 그리고 가격 움직임이 변동적이고 방향성이 없다면 이전 양초의 반대편을 깨고 유형 3이 될 수 있습니다. 양초 각 양초는 이전 양초와의 관계로 정의됩니다. 유형 1 - 내부 캔들   - 캔들이 완전히 이전 캔들의 고점과 저점 내에 있습니다. 내부 양초는 시장이 우유부단한 지점에 있음을 보여줍니다. 유형 2 - 추세 양초   - 양초가 이전 양초의 고점 또는 저점 위나 아래로 확장되지만 둘 다는 아닙니다. 유형 3 - 외부 캔들   - 캔들이 이전 캔들의 고가와 저가를 모두 깨뜨렸
TheStrat FTFC
Robert Gerald Wood
FTFC는 Rob Smith의   The Strat   에서 정의한 전체 시간 프레임 연속성을 나타냅니다. 이 지표는 분기별, 월별, 주별, 일별 또는 시간별 시가 수준 중 가장 높은 값 중 하나와 해당 값 중 가장 낮은 값 중 두 번째로 차트에 두 개의 선을 그립니다. 이것은 거래가 한 방향으로 매우 강하게 될 가능성이 높은 위 또는 아래의 채널을 제공합니다. 라인 사이에서 가격 조치는 더 고르지 않으며 더 넓은 스톱을 사용할 수 있습니다. 고점과 저점 사이의 중간 지점을 표시하기 위해 세 번째 파선도 그려집니다. 시장이 특정 방향으로 가격을 밀고자 하기 때문에 지지나 저항을 찾기에 좋은 경우가 많습니다. 색상을 NONE으로 설정하여 선택하면 이 선을 끌 수 있습니다. 설정 분기별 수준 포함 일부 사람들이 무시하는 것을 선호하므로 분기별 시가를 계산에 포함하도록 선택할 수 있습니다. IncludeCurrentTimeframeOpen true인 경우 현재 표시된 기간이 H1, D1
Round Price Levels
Robert Gerald Wood
시장은 어림수를 정말 좋아하며 시장이 하락할 때 지지선 역할을 하거나 가격이 상승할 때 저항선 역할을 하는 경우가 많습니다. 이 지표는 라운드 값에서 가격 수준을 그리도록 설계되었습니다. 이 작업은 자동으로 수행되지만 이를 재정의하고 보고 싶은 수준을 결정할 수도 있습니다. 라운드 레벨은 10단계만큼 간단할 수 있으므로 10, 20, 30 등 또는 Forex에서 작업하는 경우 0.1 또는 0.01에서 변경 사항을 보고 싶을 수 있습니다. 표시기는 각각 다른 형식을 사용하여 Major 및 Minor라는 두 클래스의 라인을 그립니다. 이를 통해 레벨의 서로 다른 두 가지 변화 사이의 변화를 동시에 볼 수 있습니다. 알림 이 표시기에는 가격이 구성 가능한 거리 내에 있을 때 메이저, 마이너 또는 두 가격 수준에서 경보를 울리는 기능이 포함됩니다. 자동 설정 기본적으로 지표는 메이저 및 마이너 가격 모두에 대해 적절한 수준을 결정합니다. 언제든지 화면에 표시할 줄 수를 제어하는 구성 가
TheStrat Monitor
Robert Gerald Wood
3.67 (3)
If you've not already learnt about The Strat trading strategy , go google it now. I promise it won't be a waste of your time, and you will likely learn some new tricks whether you use it or not. OK, so now you know what TheStrat is, you will be able to understand what this indicator can do for you. Key Features In short, the Indicator will: Show Timeframe Continuity for all supported timeframes Supports two timeset views, Day trader and Swing trader Show when Full Timeframe Continuity is in pla
TheStrat TFC Monitor
Robert Gerald Wood
The Strat를   사용하여 거래할 때 여러 시간대를 주시하는 것이 중요합니다. 이 표시기는 각 기간에 대한 현재 캔들의 일일, 주간, 월간 및 분기별 상태를 표시합니다. 원 아이콘은 해당 기간의 캔들이 현재 내부 또는 TheStrat 용어로 유형 1임을 나타냅니다. 인사이드 데이 양초가 가격 움직임을 통합하고 있으며 우리는 범위의 돌파를 찾고 있습니다. 위 또는 아래를 가리키는 삼각형 아이콘은 추세 양초 또는 TheStrat 용어의 유형 2입니다. 추세 양초는 강세 또는 약세일 수 있으며, 이는 이전 양초 범위를 벗어나 현재 한 방향으로 추세를 보이고 있음을 나타냅니다. 사각형 아이콘은 아웃사이드 캔들 또는 Strat 용어로 Type 3입니다. 이것은 두 가지를 나타냅니다. 하나는 가격이 해당 기간에 대한 방향에 대해 결정되지 않았고 상당히 고르지 못할 가능성이 높으며, 두 번째는 더 낮은 기간에 짧은 반전을 거래할 수 있는 좋은 기회가 있을 가능성이 있다는 것입니다. 사각형은
Active Pivot Levels
Robert Gerald Wood
5 (1)
피벗 수준은 모든 시장에서 인정되는 잘 확립된 기술 수준입니다. 이 표시기는 모든 기호에 대해 현재 분기별, 월별, 주별, 일별 및 4시간별 피벗을 차트에 그립니다. 또한 각 기간에 대한 지원 및 저항 수준을 표시하고 수준 1에서 4까지 표시할 항목을 선택할 수 있습니다.     다음에서 피벗 유형을 선택합니다. 기준 도당 데마크 우디 피보나치 DeMark 피벗에는 원래 사양에 따라 단일 지원 및 저항 수준이 있습니다. 표시기 벽은 선이 가격에 닿은 경우 선이 그려지는 방식을 변경합니다. 이것은 매우 도움이 될 수 있으며 라인 지원 또는 저항의 강도는 일단 만지면 상당히 감소합니다. 각 기간에 대해 예측 피벗 수준을 표시하도록 선택할 수 있습니다. 이것은 일반 피벗과 동일한 계산을 사용하지만 현재 불완전한 기간에서 작동합니다. 따라서 가격이 이미 범위의 대부분을 커버하는 해당 기간이 끝날 무렵에 가장 잘 사용됩니다. 설정 모든 설정에 대한 자세한 내용은 별도의 블로그 게시물에서 확
ATR Extremes
Robert Gerald Wood
ATR(Average True Range)은 설정된 기간 동안 가격의 움직임을 측정하는 일반적으로 사용되는 지표입니다. 그러나 그것이 주는 가치는 어떤 종류의 경계에서도 정의되지 않기 때문에 손절매나 이익실현 계산 이외의 다른 용도로 사용하는 것은 거의 불가능합니다. 이 표시기는 표준 ATR 표시기이지만 극한값을 볼 수 있도록 백분위수 구분을 도입했습니다. 백분위수와 중앙값 분할 중에서 선택할 수 있습니다. 백분위수 수준 백분위수 수준은 1%, 5%, 20%, 50%, 80%, 95%, 99%로 표시되며 가격이 다른 모든 값과 관련된 위치를 보여줍니다. 예를 들어, 5% 수준은 선 아래에서 ATR 판독값의 5%만이 그렇게 낮아진다고 말하고 99%는 그 수준보다 높은 ATR 값 중 1%만이 그렇게 높다고 말합니다. 80% 이상에서는 새로운 거래에 대해 포지션 크기를 낮추기 시작할 수 있으며 95% 이상은 모멘텀이 바뀌기 전에 이익을 취하기에 좋은 시기일 수 있습니다. 분할
Range Exhaustion
Robert Gerald Wood
범위 소진은 가격이 현재 기간의 예상 범위를 충족하거나 초과할 때 발생합니다. 이 수준에서 가격은 기간 초반에 비해 모멘텀을 잃기 시작하므로 새로운 포지션을 취하지 않도록 하는 것이 좋습니다. 이 지표는 일별, 주별 및 월별 기간에 대한 수준을 표시하여 차트에서 이러한 일이 발생할 가능성이 있는 위치를 보여줍니다. 이러한 고갈 수준을 초과하는 가격을 보면 움직임의 모멘텀이 매우 강하고 더 높은 기간 수준으로 향하고 있음을 알 수 있습니다. 지표는 기본 설정에 따라 ATR(Average True Range) 또는 ADR(Average Range) 계산을 사용할 수 있습니다. 기본적으로 우리는 Forex 차트에서 더 잘 작동하는 ATR을 사용하지만 ADR은 주식 기반 지수 및 기호에서 우위를 점합니다. 표시기에는 아래에 설명된 여러 그리기 모드가 있어 필요에 맞게 조정할 수 있습니다. 설정 계산 모드 레벨 계산을 위해 ATR(AverageTrueRange) 또는 ADR(AverageD
TheStrat Candles MT5
Robert Gerald Wood
This indicator will draw a label above or below each candle based on   Rob Smith's   The Strat   as they develop over time on your chart. As price evolves, a candle can switch between three states. When the candle first opens, if it sits completely within the previous candles high and low, then it will start as a Type 1. As time moves on, if it breaks either the high or low of the previous candle, it will be come a type 2, and should the price action be volatile and directionless, it may then
TheStrat Levels MT5
Robert Gerald Wood
5 (1)
This indicator draws the prior Highs and Lows for multiple timeframes, and can display potential Take Profit and Stop Loss levels. In Rob Smith's # The Strat  terms, these are potential entry points, or alternatively potential targets for open positions. I like to use them in both ways. On a lower timeframe, say 5 minutes to get a good entry on a daily or weekly level, and then as a potential target. Very small stops required giving an excellent risk/reward ratio. Key Features  - Levels from Hou
TheStrat FTFC MT5
Robert Gerald Wood
FTFC는 Rob Smith의   The Strat   에서 정의한 전체 시간 프레임 연속성을 나타냅니다. 이 지표는 분기별, 월별, 주별, 일별 또는 시간별 시가 수준 중 가장 높은 값 중 하나와 해당 값 중 가장 낮은 값 중 두 번째로 차트에 두 개의 선을 그립니다. 이것은 거래가 한 방향으로 매우 강하게 될 가능성이 높은 위 또는 아래의 채널을 제공합니다. 라인 사이에서 가격 조치는 더 고르지 않으며 더 넓은 스톱을 사용할 수 있습니다. 최고점과 최저점 사이의 중간 지점을 표시하기 위해 세 번째 점선도 그려집니다. 시장이 특정 방향으로 가격을 밀고자 하기 때문에 지지나 저항을 찾기에 좋은 경우가 많습니다. 색상을 NONE으로 설정하여 선택하면 이 선을 끌 수 있습니다. 설정 분기별 수준 포함 일부 사람들이 무시하는 것을 선호하므로 분기별 시가를 계산에 포함하도록 선택할 수 있습니다. IncludeCurrentTimeframeOpen true인 경우 현재 표시된 기간이 H1,
TheStrat Patterns MT5
Robert Gerald Wood
This indicator will draw patterns based on   Rob Smith's   The Strat   as they emerge in real time on your chart. As price evolves,   TheStrat   offers 18 distinct price action patterns that can help you get good entries in the market. Each pattern involves two or three candles, and this indicator will draw a bounding box around the candles and name the pattern. The indicator also shows when a potential setup is forming, known by stratters as an Actionable signal. Candles Each candle is defin
TheStrat Monitor MT5
Robert Gerald Wood
5 (1)
Strat 거래 전략   에 대해 아직 배우지 않았다면 지금 Google로 이동하십시오. 나는 그것이 당신의 시간 낭비가 아닐 것이라고 약속하며, 당신이 그것을 사용하든 안 하든 몇 가지 새로운 요령을 배우게 될 것입니다. 자, 이제 TheStrat이 무엇인지 알았으니 이 지표가 당신을 위해 무엇을 할 수 있는지 이해할 수 있을 것입니다. 주요 특징들 즉, 지표는 다음을 수행합니다. 지원되는 모든 기간에 대한 기간 연속성 표시 Day trader와 Swing trader의 두 가지 시간 설정 보기를 지원합니다. 연속된 4개의 기간에 대해 전체 기간 연속성이 있는 경우 표시 각 기간에 대한 현재 캔들 상태 표시 모든 시간대에 현재 패턴이 있는 경우 표시 In-force 및 Actionable 패턴을 모두 표시합니다. 5초마다 업데이트(1초부터 설정 가능) 패널을 클릭하여 선택한 종목 및 기간에 대한 차트를 열 수 있습니다. 차트를 여는 데 사용할 차트 템플릿을 선택할 수 있습니다.
TheStrat TFC Monitor MT5
Robert Gerald Wood
5 (1)
The Strat를   사용하여 거래할 때 여러 시간대를 주시하는 것이 중요합니다. 이 표시기는 각 기간에 대한 현재 캔들의 일일, 주간, 월간 및 분기별 상태를 표시합니다. 원 아이콘은 해당 기간의 캔들이 현재 내부 또는 TheStrat 용어로 유형 1임을 나타냅니다. 인사이드 데이 양초가 가격 움직임을 통합하고 있으며 우리는 범위의 돌파를 찾고 있습니다. 위 또는 아래를 가리키는 삼각형 아이콘은 추세 양초 또는 TheStrat 용어의 유형 2입니다. 추세 양초는 강세 또는 약세일 수 있으며, 이는 이전 양초 범위를 벗어나 현재 한 방향으로 추세를 보이고 있음을 나타냅니다. 사각형 아이콘은 아웃사이드 캔들 또는 Strat 용어로 Type 3입니다. 이것은 두 가지를 나타냅니다. 하나는 가격이 해당 기간에 대한 방향에 대해 결정되지 않았고 상당히 고르지 못할 가능성이 높으며, 두 번째는 더 낮은 기간에 짧은 반전을 거래할 수 있는 좋은 기회가 있을 가능성이 있다는 것입니다. 사각형은
피벗 수준은 모든 시장에서 인정되는 잘 확립된 기술 수준입니다. 이 표시기는 모든 기호에 대해 현재 분기별, 월별, 주별, 일별 및 4시간별 피벗을 차트에 그립니다. 또한 각 기간에 대한 지원 및 저항 수준을 표시하고 수준 1에서 4까지 표시할 항목을 선택할 수 있습니다.     다음에서 피벗 유형을 선택합니다. 기준 도당 데마크 우디 피보나치 DeMark 피벗에는 원래 사양에 따라 단일 지원 및 저항 수준이 있습니다. 표시기 벽은 선이 가격에 닿은 경우 선이 그려지는 방식을 변경합니다. 이것은 매우 도움이 될 수 있으며 라인 지원 또는 저항의 강도는 일단 만지면 상당히 감소합니다. 각 기간에 대해 예측 피벗 수준을 표시하도록 선택할 수 있습니다. 이것은 일반 피벗과 동일한 계산을 사용하지만 현재 불완전한 기간에서 작동합니다. 따라서 가격이 이미 범위의 대부분을 커버하는 해당 기간이 끝날 무렵에 가장 잘 사용됩니다. 설정 모든 설정에 대한 자세한 내용은 별도의 블로그 게시물에서 확
Round Price Levels MT5
Robert Gerald Wood
시장은 어림수를 정말 좋아하며 시장이 하락할 때 지지선 역할을 하거나 가격이 상승할 때 저항선 역할을 하는 경우가 많습니다. 이 지표는 라운드 값에서 가격 수준을 그리도록 설계되었습니다. 이 작업은 자동으로 수행되지만 이를 재정의하고 보고 싶은 수준을 결정할 수도 있습니다. 라운드 레벨은 10단계만큼 간단할 수 있으므로 10, 20, 30 등 또는 Forex에서 작업하는 경우 0.1 또는 0.01에서 변경 사항을 보고 싶을 수 있습니다. 표시기는 각각 다른 형식을 사용하여 Major 및 Minor라는 두 클래스의 라인을 그립니다. 이를 통해 레벨의 서로 다른 두 가지 변화 사이의 변화를 동시에 볼 수 있습니다. 알림 이 표시기에는 가격이 구성 가능한 거리 내에 있을 때 메이저, 마이너 또는 두 가격 수준에서 경보를 울리는 기능이 포함됩니다. 자동 설정 기본적으로 지표는 메이저 및 마이너 가격 모두에 대해 적절한 수준을 결정합니다. 언제든지 화면에 표시할 줄 수를 제어하는 구성 가능한
ATR Extremes MT5
Robert Gerald Wood
ATR(Average True Range)은 일정 기간 동안 가격 변동량을 측정하는 데 일반적으로 사용되는 지표입니다. 그러나 그것이 제공하는 가치는 어떤 종류의 경계 내에서 정의되지 않으므로 손절매 또는 이익실현 계산 이외의 용도로 사용하는 것은 거의 불가능합니다. 이 지표는 표준 ATR 지표이지만 극단을 볼 수 있도록 백분위수 경계를 도입했습니다. 백분위수와 분할 중앙값이라고 하는 것 중에서 선택할 수 있습니다. 백분위수 수준 백분위수 수준은 1%, 5%, 20%, 50%, 80%, 95%, 99%로 표시되며 다른 모든 값과 관련하여 가격이 어디에 있는지 보여줍니다. 예를 들어, 5% 수준은 선 아래에서 ATR 판독값의 5%만 그만큼 낮아지고 99%는 해당 수준 위의 ATR 값 중 1%만 그만큼 높아진다는 의미입니다. 80% 이상에서는 새로운 거래를 위해 포지션 크기를 낮추기 시작할 수 있으며 95% 이상에서는 모멘텀이 바뀌기 전에 이익을 얻을 수 있는 좋은 시간일 수 있습니다.
Range Exhaustion MT5
Robert Gerald Wood
범위 소진은 가격이 현재 기간의 예상 범위를 충족하거나 초과할 때 발생합니다. 이 수준에서 가격은 기간 초반에 비해 모멘텀을 잃기 시작하므로 새로운 포지션을 취하지 않도록 하는 것이 좋습니다. 이 지표는 일별, 주별 및 월별 기간에 대한 수준을 표시하여 차트에서 이러한 일이 발생할 가능성이 있는 위치를 보여줍니다. 이러한 고갈 수준을 초과하는 가격을 보면 움직임의 모멘텀이 매우 강하고 더 높은 기간 수준으로 향하고 있음을 알 수 있습니다. 지표는 기본 설정에 따라 ATR(Average True Range) 또는 ADR(Average Range) 계산을 사용할 수 있습니다. 기본적으로 우리는 Forex 차트에서 더 잘 작동하는 ATR을 사용하지만 ADR은 주식 기반 지수 및 기호에서 우위를 점합니다. 표시기에는 아래에 설명된 여러 그리기 모드가 있어 필요에 맞게 조정할 수 있습니다. 설정 계산 모드 레벨 계산을 위해 ATR(AverageTrueRange) 또는 ADR(AverageD
필터:
리뷰 없음
리뷰 답변