• 미리보기
  • 리뷰
  • 코멘트
  • 새 소식

TheStrat Candles MT5

This indicator will draw a label above or below each candle based on Rob Smith's The Strat as they develop over time on your chart.

As price evolves, a candle can switch between three states. When the candle first opens, if it sits completely within the previous candles high and low, then it will start as a Type 1. As time moves on, if it breaks either the high or low of the previous candle, it will be come a type 2, and should the price action be volatile and directionless, it may then break the opposite side of the previous candle and become a type 3.

Candles

Each candle is defined by its relationship to the previous candle.

Type 1 - Inside candle- The candle is entirely within the high and low of the previous candle. An inside candle shows the market is at a point of indecision.

Type 2 - Trending candle- The candle extends above or below either the High or low, but not both, of the previous candle.

Type 3 - Outside candle- The candle has broken both the high and low of the previous candle. An outside candle shows price is broadening, producing higher highs and lower lows on a lower timeframe.


Settings

ShowInside
When true, the candle number is shown for Inside candles.

ShowTrending
When true, the candle number is shown for Trending candles. I often leave this set to false (the default) as I find it distracts from the important signals given by Type 1 and 3 candles.

ShowOutside

When true, the candle number is shown for Outside candles.

LabelPosition

Choose between AboveCandle or BelowCandle.


FontName

The font to use for the candle numbers.

FontSize
The size of font to use for the candle numbers.
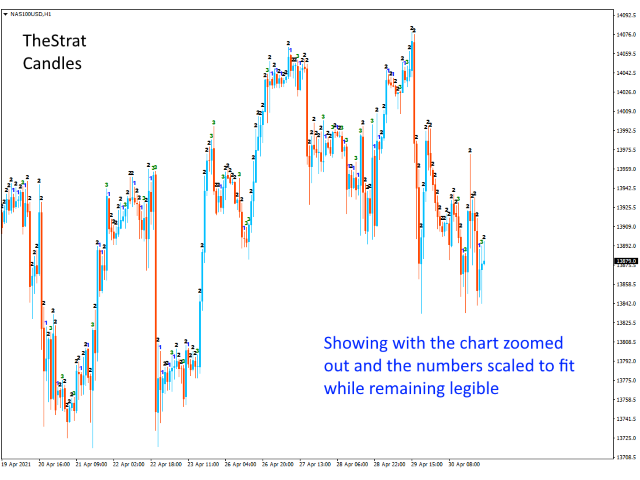
AutoSizeFont
When true, the candle numbers will be scaled according to the chart zoom levels. When false, the candle numbers will use the FontSize setting.


InsideFontColour
The colour to use for an Inside candle number

TrendingFontColour
The colour to use for an Trending candle number

OutsideFontColour
The colour to use for an Outside candle number


LookbackBars

By default, this is set to 50, meaning only the most recent 50 candles will be labelled. You can modify this number to include more candles, or set it to 0 to label all historic candles.


추천 제품
평면 및 추세를 결정하기 위한 표시기. 가격이 2개의 히스토그램과 2개의 선(빨간색 및 파란색) 중 하나보다 낮으면 판매 영역입니다. 이 버전의 표시기를 구매할 때 하나의 실제 계정과 하나의 데모 계정에 대한 MT4 버전 - 선물로(수신하려면 개인 메시지를 작성하세요)! 가격이 2개의 히스토그램과 2개의 선(빨간색 및 파란색) 중 하나보다 높으면 구매 영역입니다. MT4 버전: https://www.mql5.com/en/market/product/3793 가격이 두 라인 사이 또는 히스토그램 영역에 있으면 시장에 명확한 추세가 없습니다. 간단히 말해서 시장은 평평합니다. 표시기의 작업은 스크린샷에 더 명확하게 표시됩니다. 지표는 선행 데이터를 얻는 데 사용할 수 있습니다. 또는 현재 추세의 상태를 확인합니다.
Rocket Trend
Andriy Sydoruk
The Rocket Trend indicator is trending. The indicator draws two-color points connected by lines along the chart. This is a trend indicator, it is an algorithmic indicator. It is easy to work and understand when a blue circle appears, you need to buy, when a red one appears, sell. The indicator is used for scalping and pipsing, and has proven itself well. Rocket Trend is available for analyzing the direction of the trend for a specific period of time. Ideal for novice traders learning the laws o
Antique Trend
Nadiya Mirosh
The Antique Trend Indicator is a revolutionary trend trading and filtering solution with all the important features of a trend tool built into one tool! The Antique Trend indicator is good for any trader, suitable for any trader both for Forex and binary options. There is no need to configure anything, everything has been perfected by time and experience, it works great during flats and trends. The Antique Trend indicator is a tool for technical analysis of financial markets, reflecting curre
Best SAR MT5
Ashkan Hazegh Nikrou
5 (1)
설명 :  우리는 외환 시장(PSAR)에서 전문적이고 인기 있는 지표 중 하나를 기반으로 하는 새로운 무료 지표를 도입하게 된 것을 기쁘게 생각합니다. 이 지표는 원래 포물선 SAR 지표에 대한 새로운 수정이며, 프로 SAR 지표에서 점과 가격 차트 사이의 교차를 볼 수 있습니다. 교차는 신호가 아니지만 이동 가능성의 끝을 말하는 것입니다. 새로운 파란색 점으로 매수를 시작하고 첫 번째 파란색 점 앞에 손절매를 1 attr 배치하고 마지막으로 점이 가격 차트를 교차하는 즉시 종료할 수 있습니다. 매수 또는 매도 신호를 여는 방법은 무엇입니까? 첫 번째 파란색 점으로 공개 매수 거래 및 첫 번째 빨간색 점으로 공개 매도 거래 정확한 손절매는 어디에 있습니까? 안전한 정지 손실은 첫 번째 점에 있을 수 있습니다(구매의 경우 첫 번째 파란색 점, 매도의 경우 첫 번째 빨간색 점) 올바른 이익실현은 어디에 있습니까? 이익실현은 손절매 거리와 RR에 따라 조정할 수 있으므
FREE
Fibrillar
Vitalii Zakharuk
It is very easy to use the Fibrillar indicator, since the simplest is to look at the chart and act according to the indications of the colored arrows. The algorithm takes into account the measurement of prices, and this method also focuses on measuring each of the price drops (H / C, H / O, LC, LO) - which gives more detailed information, but also more averaged. When calculating this indicator, logarithmic gains are first calculated at the closing price, which allows you to filter out the tre
The best time to trade Using this Indicator is when the time reach exactly hour,half,45 minutes,15 minutes and sometimes 5 minutes.. This indicators is helpful to those who trade boom and crash indecies.How to read this indicator first you'll see Blue allow and Red allow all these allows used to indicate or to detect the spike which will happen so the allow happens soon before the spike happen.This indicator works properly only in boom and crash trading thing which you have to consider when
HMA Trend Professional MT5
Pavel Zamoshnikov
4.4 (5)
Improved version of the free HMA Trend indicator (for MetaTrader 4) with statistical analysis. HMA Trend is a trend indicator based on the Hull Moving Average (HMA) with two periods. HMA with a slow period identifies the trend, while HMA with a fast period determines the short-term movements and signals in the trend direction. The main differences from the free version: Ability to predict the probability of a trend reversal using analysis of history data. Plotting statistical charts for analyz
Trade history
Andriy Konovalov
5 (3)
The indicator plots charts of profit taken at the Close of candles for closed (or partially closed) long and short positions individually. The indicator allows to filter deals by the current symbol, specified expert ID (magic number) and the presence (absence) of a substring in a deal comment, to set the start time and the periodicity of profit reset (daily, weekly or monthly) to calculate the profit chart. The indicator also displays the floating (not fixed) profit of the opened positions at th
Trend Lineas
Ignacio Agustin Mene Franco
Trendline! trend line indicator, support and resistance, ideal for hunting long and short! where it uses 2 lines, the red and the blue, the red one marks rebounds for sales, the blue one marks you rebounds for purchase And not only that, but it also marks you, the uptrend and downtrend. works for any season works for forex markets and synthetic indices! also crypto. Good profit! World Investor.
To download MT4 version please click here . This is the exact conversion from TradingView: "WaveTrend [LazyBear]" By "zeusuk3". One of the coolest indicators out there to detect overbought and oversold zones. It can be used as a part of more complicated strategy and for confirming a potential trade setup. There are buffers to use in EAs also. The indicator is loaded light and non-repaint. - You can message in private chat for further changes you need. Thanks for downloading 
Upgraded - Stars added to indentify Areas you can scale in to compound on your entry  when buying or selling version 2.4 Upgraded Notifications and alerts added version 2.3 *The indicator is suitable for all pairs fromm  Deriv pairs (Vix,jump,boom & crash indices) , Currencies, cryptos , stocks(USA100, USA30 ), and metals like gold etc. How does it work? Increasing the period make it more stable hence will only focus on important entry points However  lowering the period will mean the indica
Blahtech Market Profile MT5
Blahtech Limited
5 (8)
Was: $249  Now: $99   Market Profile defines a number of day types that can help the trader to determine market behaviour. A key feature is the Value Area, representing the range of price action where 70% of trading took place. Understanding the Value Area can give traders valuable insight into market direction and establish the higher odds trade. It is an excellent addition to any system you may be using. Inspired by Jim Dalton’s book “Mind Over Markets”, this indicator is designed to suit the
TrendDetect
Pavel Gotkevitch
The Trend Detect indicator combines the features of both trend indicators and oscillators. This indicator is a convenient tool for detecting short-term market cycles and identifying overbought and oversold levels. A long position can be opened when the indicator starts leaving the oversold area and breaks the zero level from below. A short position can be opened when the indicator starts leaving the overbought area and breaks the zero level from above. An opposite signal of the indicator can
KT Horizontal Lines MT5
KEENBASE SOFTWARE SOLUTIONS
In MetaTrader, plotting multiple   horizontal lines   and then tracking their respective price levels can be a hassle. This indicator automatically plots multiple horizontal lines at equal intervals for setting price alerts, plotting support and resistance levels, and other manual purposes. This indicator is suitable for Forex traders who are new and looking for chances to make quick profits from buying and selling. Horizontal lines can help traders find possible areas to start trading when the
Owl Smart Levels MT5
Sergey Ermolov
4.47 (36)
MT4 버전  |  FAQ Owl Smart Levels Indicator 는 Bill Williams 의 고급 프랙탈, 시장의 올바른 파동 구조를 구축하는 Valable ZigZag, 정확한 진입 수준을 표시하는 피보나치 수준과 같은 인기 있는 시장 분석 도구를 포함하는 하나의 지표 내에서 완전한 거래 시스템입니다. 시장과 이익을 취하는 장소로. 전략에 대한 자세한 설명 표시기 작업에 대한 지침 고문-거래 올빼미 도우미의 조수 개인 사용자 채팅 ->구입 후 나에게 쓰기,나는 개인 채팅에 당신을 추가하고 거기에 모든 보너스를 다운로드 할 수 있습니다 힘은 단순함에 있습니다! Owl Smart Levels 거래 시스템은 사용하기 매우 쉽기 때문에 전문가와 이제 막 시장을 연구하고 스스로 거래 전략을 선택하기 시작한 사람들 모두에게 적합합니다. 전략 및 지표에는 눈에 보이지 않는 비밀 공식 및 계산 방법이 없으며 모든 전략 지표는 공개되어 있습니다. Owl Smart Levels를
ADR 경보 대시보드는 가격이 일반적인 일일 평균 범위와 관련하여 현재 거래되고 있는 위치를 한 눈에 보여줍니다. 가격이 평균 범위를 초과하고 선택한 수준보다 높을 때 팝업, 이메일 또는 푸시를 통해 즉각적인 알림을 받을 수 있으므로 신속하게 철회 및 반전에 뛰어들 수 있습니다. 대시는 빈 차트에 배치되도록 설계되었으며 배경에 앉아서 레벨에 도달하면 경고하므로 앉아서 보거나 전혀 볼 필요가 없습니다! MT4 버전은 여기에서 사용 가능: https://www.mql5.com/en/market/product/62756 새로운 기능: 이제 평균 WEEKLY 및 MONTHLY 범위와 경고도 표시됩니다! 여기에서 차트의 수준을 나타내는 ADR 반전 표시기를 얻으십시오. https://www.mql5.com/en/market/product/64477 시간의 약 60%는 가격이 정상적인 일일 평균 범위(ADR) 내에서 거래되고 이 수준 이상으로 상승하면 일반적으로 급격한 가격 변
Engulfing Candlestick Bulkowski The engulfing candlestick is a well-known candle pattern composed of two candles. This indicator for showing engulfing candlestick that describe by Thomas Bulkowski. If you need for MetaTrader 4 version, please visit here: https://www.mql5.com/en/market/product/34193 Feature Highlights Show bullish engulfing and bearish engulfing. Customizable "Up Symbol". Customizable "Down Symbol". Customizable symbol distance from candlestick. Customizable "Down Color". Cus
The Rubdfx swing indicator is a useful tool for traders looking to identify trend changes in a particular instrument they are trading. It is designed to draw a line on the main chart, and the signals are indicated by color changes with signal alerts. The color green is used to indicate a bullish trend, while the color pink is used to indicate a bearish trend. These colors can be customized to fit the trader's preferences or theme. The Rubdfx swing indicator has the ability to spot both long-te
Riko Trend mt5
Nadiya Mirosh
The Riko Trend indicator is a revolutionary trend trading and filtering solution with all the important features of a trend tool built into one tool! The Riko Trend indicator is good for any trader, suitable for any trader for both forex and binary options. You don’t need to configure anything, everything is perfected by time and experience, it works great during a flat and in a trend. The Riko Trend indicator is a technical analysis tool for financial markets that reflects the current price
MetaCOT 2 is a set of indicators and specialized utilities for the analysis of the U.S. Commodity Futures Trading Commission reports. Thanks to the reports issued by the Commission, it is possible to analyze the size and direction of the positions of the major market participants, which brings the long-term price prediction accuracy to a new higher-quality level, inaccessible to most traders. These indicators, related to the fundamental analysis, can also be used as an effective long-term filter
Provided Trend
Nadiya Mirosh
Provided Trend is a complex signal formation indicator. As a result of the work of internal algorithms, you can see only three types of signals on your chart. The first is a buy signal, the second is a sell signal, and the third is a market exit signal. Options: CalcFlatSlow - The first parameter that controls the main function of splitting the price chart into waves. CalcFlatFast - The second parameter that controls the main function of splitting the price chart into waves. CalcFlatAvg - Par
LevelPAttern MT5 is a technical indicator based on the daily levels and Price Action patterns. The indicator is based on the standard ZigZag indicator + reversal candlestick pattens, such as Star, Hammer (also knows as Pin bar), Engulfing and others. The indicator generates audio and text notifications when a pattern is formed and a level is touched. It also supports sending email and push notifications. Indicator operation features It is suitable for working with any CFD and FOREX trading ins
Easy Buy Sell Signal Alert
Franck Martin
4.83 (6)
Easy BySell is a market indicator for opening and closing positions. It becomes easy to track market entries with the alerts. It indicates the trend reversal points when a price reaches extreme values and the most favorable time to enter the market. My other products  with its advanced technology   ( artificial neural networks )  :   https://www.mql5.com/en/users/incepline/seller The algorithm is based on ATR and Stochastic Oscillator indicators. You can modify these two parameters as you
Your Trend Friend
Luigi Nunes Labigalini
The trend is your friend! Look at the color of the indicator and trade on that direction. It does not  repaint. After each candle is closed, that's the color of the trend. You can focus on shorter faster trends or major trends, just test what's most suitable for the symbol and timeframe you trade. Simply change the "Length" parameter and the indicator will automatically adapt. You can also change the color, thickness and style of the lines. Download and give it a try! There are big movements
Indicator and Expert Adviser  EA Available in the comments section of this product. Download with Indicator must have indicator installed for EA to work. Mt5 indicator alerts for bollinger band and envelope extremes occurring at the same time. Buy signal alerts occur when A bullish candle has formed below both the lower bollinger band and the lower envelope  Bar must open and close below both these indicators. Sell signal occur when A bear bar is formed above the upper bollinger band and upp
MetaCOT 2 COT Index MT5
Vasiliy Sokolov
1 (1)
MetaCOT 2 is a set of indicators and specialized utilities for the analysis of the U.S. Commodity Futures Trading Commission reports. Thanks to the reports issued by the Commission, it is possible to analyze the size and direction of the positions of the major market participants, which brings the long-term price prediction accuracy to a new higher-quality level, inaccessible to most traders. These indicators, related to the fundamental analysis, can also be used as an effective long-term filter
대칭 삼각형, 비대칭 삼각형 또는 직각 삼각형과 같은 삼각형 패턴, 상승 쐐기 또는 하강 쐐기와 같은 쐐기 패턴, 확장 패턴 및 추세 채널에 대한 패턴 탐색기 이 지표는 과거의 패턴과 현재의 패턴을 탐색하며, 수동으로 추세선이나 삼각형을 그려 시간을 절약하고 차트에 가장 좋은 패턴을 그리는 자동 분석에 사용하려는 사람들에게 가장 적합한 지표입니다. 특징 : - 최적의 패턴을 조정하고 찾기 위해 즉시 ZigZag 확장 깊이를 변경하는 패널 - 패턴을 지그재그의 이전 막대로 다시 이동하여 과거에 발생한 일을 탐색하고 추세선이 존중되는지 여부를 탐색하고 가격 동작을 이해할 수 있습니다. 이 지표를 사용하여 이전의 과거 패턴을 탐색하고 분석하고 학습하여 마스터 전략을 도출합니다. - 전환 버튼에서 추세 채널 또는 추세선에서 쐐기 또는 삼각형 모드로 즉시 전환 - 패턴이 변경되지 않도록 일시 중지하고 경고에 대한 가격 터치를 계속 확인합니다. - 레벨 터치에 대
Exclusive Limited Time Offer! Grab this useful indicator for a lifetime at just $49. Note: It is requested that purchases must be refrained from if the buyer is from India, Bangladesh, or Pakistan, as developer support for these regions is unavailable due to legal restrictions. Volatility indicator dashboard designed to revolutionize how traders perceive and navigate market volatility. Track volatile for multiple currency pairs one at time for multiple timeframes. Works best with Forex Market,
B Xtrender
Yashar Seyyedin
5 (1)
To download MT4 version please click here . This is the exact conversion from TradingView: "B-Xtrender" By "QuantTherapy". - It is an oscillator based on RSI and multiple layers of moving averages. -   It is a two in one indicator to calculate overbought and oversold zones for different RSI settings. -  This indicator lets you read the buffers for all data on the window. - This is a non-repaint and light processing load indicator. - You can message in private chat for further changes you need.
DYNAMIC SR TREND CHANNEL Dynamic SR Trend Channel is a simple indicator for trend detection as well as resistance/support levels on the current timeframe. It shows you areas where to expect possible change in trend direction and trend continuation. It works with any trading system (both price action and other trading system that use indicators) and is also very good for renko charting system as well. In an uptrend, the red line (main line) serves as the support and the blue line serves as the
이 제품의 구매자들이 또한 구매함
우선 이 거래 시스템이 리페인팅, 리드로잉 및 레이그 인디케이터가 아니라는 점을 강조하는 것이 중요합니다. 이는 수동 및 로봇 거래 모두에 이상적인 것으로 만듭니다. "스마트 트렌드 트레이딩 시스템 MT5"은 새로운 및 경험이 풍부한 트레이더를 위해 맞춤형으로 제작된 종합적인 거래 솔루션입니다. 10개 이상의 프리미엄 인디케이터를 결합하고 7개 이상의 견고한 거래 전략을 특징으로 하여 다양한 시장 조건에 대한 다목적 선택이 가능합니다. 트렌드 추종 전략: 효과적인 트렌드 추이를 타기 위한 정확한 진입 및 손절 관리를 제공합니다. 반전 전략: 잠재적인 트렌드 반전을 식별하여 트레이더가 범위 시장을 활용할 수 있게 합니다. 스캘핑 전략: 빠르고 정확한 데이 트레이딩 및 단기 거래를 위해 설계되었습니다. 안정성: 모든 인디케이터가 리페인팅, 리드로잉 및 레이그가 아니므로 신뢰할 수 있는 신호를 보장합니다. 맞춤화: 개별 거래 선호도를 고려한 맞춤형 전략을 지원합니다. 최상의 전략을 찾는
Atomic Analyst MT5
Issam Kassas
4.27 (11)
우선적으로 언급할 점은이 거래 지표가 다시 그리지 않고 지연되지 않으며 이를 통해 수동 및 로봇 거래 모두에 이상적이라는 점입니다. Atomic Analyst는 가격의 강도와 모멘텀을 활용하여 시장에서 더 나은 이점을 찾는 PA Price Action Indicator입니다. 고급 필터를 장착하여 잡음과 거짓 신호를 제거하고 거래 잠재력을 높이는 데 도움이 됩니다. 복잡한 지표의 다중 레이어를 사용하여 Atomic Analyst는 차트를 스캔하고 복잡한 수학적 계산을 간단한 신호와 색상으로 변환하여 초보 트레이더가 이해하고 일관된 거래 결정을 내릴 수 있도록합니다. "Atomic Analyst"는 새로운 및 경험이 풍부한 트레이더를위한 종합적인 거래 솔루션입니다. 프리미엄 지표와 최고 수준의 기능을 하나의 거래 전략에 결합하여 모든 종류의 트레이더에 대한 다재다능한 선택지가되었습니다. 인트라데이 거래 및 스캘핑 전략 : 빠르고 정확한 일일 거래 및 단기 거래를 위해 설계
FX Volume MT5
Daniel Stein
4.94 (17)
모닝 브리핑을 통해 세부 정보와 스크린샷으로 매일 시장 업데이트를 받으세요 여기 mql5 및 텔레그램에서 FX 거래량은 브로커의 관점에서 시장 심리에 대한 실제 통찰력을 제공하는 최초이자 유일한 거래량 지표입니다. 브로커와 같은 기관 시장 참여자가 외환 시장에서 어떤 포지션을 취하고 있는지에 대한 훌륭한 통찰력을 COT 보고서보다 훨씬 빠르게 제공합니다. 차트에서 이 정보를 직접 확인하는 것은 트레이딩의 진정한 판도를 바꾸고 획기적인 솔루션입니다. 다음과 같은 고유한 시장 데이터 인사이트의 이점 비율 는 통화의 매수/매도 포지션 비율을 백분율로 표시 비율 변화 는 선택한 기간 내 매수 비율과 비율 변화를 표시 총 거래량 는 해당 통화의 총 거래량(롱 및 숏)을 로트 단위로 보여줍니다 Volumes Long 는 해당 통화의 모든 롱 포지션의 거래량을 보여줍니다 Volumes Short 는 해당 통화의 모든 숏 포지션의 거래량을 보여줍니다 Net Long 는 순 롱 포지션의 거래량
Quantum Trend Sniper
Bogdan Ion Puscasu
5 (37)
소개       Quantum Trend Sniper Indicator는   추세 반전을 식별하고 거래하는 방식을 변화시키는 획기적인 MQL5 지표입니다! 13년 이상의 거래 경험을 가진 숙련된 트레이더 팀이 개발한       Quantum Trend Sniper 표시기       매우 높은 정확도로 추세 반전을 식별하는 혁신적인 방법으로 거래 여정을 새로운 차원으로 끌어올리도록 설계되었습니다. ***Quantum Trend Sniper Indicator를 구입하면 Quantum Breakout Indicator를 무료로 받을 수 있습니다!*** Quantum Trend Sniper Indicator는 추세 반전을 식별하고 세 가지 이익실현 수준을 제안할 때 경고, 신호 화살표를 제공합니다. 초보자 거래자와 전문 거래자 모두에게 적합합니다. Quantum EA 채널:       여기를 클릭하세요 MT4 버전:       여기를 클릭하세요
Gold Stuff mt5
Vasiliy Strukov
4.89 (166)
Gold Stuff mt5는 금을 위해 특별히 설계된 추세 지표이며 모든 금융 상품에서도 사용할 수 있습니다. 표시기가 다시 그려지지 않고 지연되지 않습니다. 권장 기간 H1. 설정 및 개인 보너스를 받으려면 구매 후 즉시 저에게 연락하십시오!   설정 화살표 그리기 - 켜기 끄기. 차트에 화살표 그리기. 경고 - 가청 경고를 끕니다. 이메일 알림 - 켜기 끄기. 이메일 알림. Puch-notification - 켜기 끄기. 푸시 알림. 다음으로 색 영역을 조정합니다. Gold Stuff mt5는 금을 위해 특별히 설계된 추세 지표이며 모든 금융 상품에서도 사용할 수 있습니다. 표시기가 다시 그려지지 않고 지연되지 않습니다. 권장 기간 H1. 설정 및 개인 보너스를 받으려면 구매 후 즉시 저에게 연락하십시오!   설정 화살표 그리기 - 켜기 끄기. 차트에 화살표 그리기. 경고 - 가청 경고를 끕니다. 이메일 알림 - 켜기 끄기. 이메일 알림. Puch-noti
Trend Screener Pro MT5
STE S.S.COMPANY
4.89 (61)
트렌드 표시기, 트렌드 트레이딩 및 필터링을 위한 획기적인 고유 솔루션, 하나의 도구 안에 내장된 모든 중요한 트렌드 기능! Forex, 상품, 암호 화폐, 지수 및 주식과 같은 모든 기호/도구에 사용할 수 있는 100% 다시 칠하지 않는 다중 시간 프레임 및 다중 통화 표시기입니다. Trend Screener는 차트에 점이 있는 화살표 추세 신호를 제공하는 효율적인 지표 추세 추종 지표입니다. 추세 분석기 표시기에서 사용할 수 있는 기능: 1. 트렌드 스캐너. 2. 최대 이익 분석이 있는 추세선. 3. 추세 통화 강도 측정기. 4. 경고가 있는 추세 반전 점. 5. 경고가 있는 강력한 추세 점. 6. 추세 화살표 Trend Screener Indicator가 있는 일일 분석 예, 일일 신호 성능...등은 여기에서 찾을 수 있습니다. 여기를 클릭하십시오. LIMITED TIME OFFER : Trend Screener Indicator는 50$ 및 평생 동안만 사용할 수 있습니다
RelicusRoad Pro MT5
Relicus LLC
4.82 (22)
이제 $ 147 (몇 가지 업데이트 후 $ 499 증가) - 무제한 계정 (PCS 또는 MACS) RelicusRoad 사용 설명서 + 교육 비디오 + 비공개 Discord 그룹 액세스 + VIP 상태 시장을 보는 새로운 방법 RelicusRoad는 외환, 선물, 암호화폐, 주식 및 지수에 대한 세계에서 가장 강력한 거래 지표로서 거래자에게 수익성을 유지하는 데 필요한 모든 정보와 도구를 제공합니다. 우리는 초보자부터 고급까지 모든 거래자가 성공할 수 있도록 기술적 분석 및 거래 계획을 제공합니다. 미래 시장을 예측할 수 있는 충분한 정보를 제공하는 핵심 거래 지표입니다. 우리는 차트에서 말이 안 되는 여러 지표 대신 완전한 솔루션을 믿습니다. 타의 추종을 불허하는 매우 정확한 신호, 화살표 + 가격 조치 정보를 표시하는 올인원 표시기입니다. 강력한 AI를 기반으로 하는 RelicusRoad는 누락된 정보와 도구를 제공하여 교육하고 성공적인 트레이더인 트레이딩 전문
우선적으로, 이 거래 도구는 전문적인 거래에 이상적인 비-다시 그리기 및 지연되지 않는 지표입니다.  스마트 가격 액션 컨셉트 인디케이터는 신규 및 경험 많은 트레이더 모두에게 매우 강력한 도구입니다. Inner Circle Trader Analysis 및 Smart Money Concepts Trading Strategies와 같은 고급 거래 아이디어를 결합하여 20가지 이상의 유용한 지표를 하나로 결합합니다. 이 인디케이터는 스마트 머니 컨셉트에 중점을 두어 대형 기관의 거래 방식을 제공하고 이동을 예측하는 데 도움을 줍니다.  특히 유동성 분석에 뛰어나 기관이 어떻게 거래하는지 이해하는 데 도움을 줍니다. 시장 트렌드를 예측하고 가격 변동을 신중하게 분석하는 데 탁월합니다. 귀하의 거래를 기관 전략에 맞추어 시장의 동향에 대해 더 정확한 예측을 할 수 있습니다. 이 인디케이터는 시장 구조를 분석하고 중요한 주문 블록을 식별하고 다양한 패턴을 인식하는 데 뛰어납니다. 
Entry Points Pro for MT5
Yury Orlov
4.54 (157)
다시 색을 칠하지 않고 거래에 진입할 수 있는 정확한 신호를 제공하는 MT5용 지표입니다. 외환, 암호화폐, 금속, 주식, 지수 등 모든 금융 자산에 적용할 수 있습니다. 매우 정확한 추정값을 제공하고 매수와 매도의 가장 좋은 시점을 알려줍니다. 하나의 시그널로 수익을 내는 지표의 예와 함께 비디오 (6:22)시청하십시오! 대부분의 거래자는 Entry Points Pro 지표의 도움으로 첫 거래 주 동안 트레이딩 결과를 개선합니다. 저희의   Telegram Group 을 구독하세요! Entry Points Pro 지표의 좋은점. 재도색이 없는 진입 신호 신호가 나타나고 확인되면(시그널 캔들이 완성된 경우) 신호는 더 이상 사라지지 않습니다. 여타 보조지표의 경우 신호를 표시한 다음 제거되기 때문에 큰 재정적 손실로 이어집니다. 오류 없는 거래 게시 알고리즘을 통해 트레이드(진입 또는 청산)를 할 이상적인 순간을 찾을 수 있으며, 이를 통해 이를 사용하는 모든 거래자의
FX Power MT5 NG
Daniel Stein
5 (4)
모닝 브리핑 여기 mql5 와 텔레그램에서 FX Power MT5 NG 는 오랫동안 인기 있는 통화 강도 측정기인 FX Power의 차세대 버전입니다. 이 차세대 강도 측정기는 무엇을 제공합니까? 기존 FX Power에서 좋아했던 모든 것 PLUS GOLD/XAU 강도 분석 더욱 정밀한 계산 결과 개별 구성 가능한 분석 기간 더 나은 성능을 위한 사용자 정의 가능한 계산 한도 특별 멀티더 많은 것을보고 싶은 사람들을위한 특별한 다중 인스턴스 설정 모든 차트에서 좋아하는 색상을위한 끝없는 그래픽 설정 수많은 알림 옵션, 중요한 것을 다시는 놓치지 않도록 Windows 11 및 macOS 스타일의 둥근 모서리가 있는 새로운 디자인 마법처럼 움직이는 인디케이터 패널 FX 파워 키 특징 모든 주요 통화의 완전한 강세 이력 모든 시간대에 걸친 통화 강세 이력 모든 브로커 및 차트에서 고유 계산 결과 100% 신뢰할 수있는 실시간100 % 신뢰할 수있는 실시간 계산-> 다시 칠하지 않음
Advanced Supply Demand MT5
Bernhard Schweigert
4.53 (15)
현재 33% 할인! 초보자나 전문 트레이더를 위한 최고의 솔루션! 이 보조지표는 우리가 다수의 독창적 기능과 새로운 공식을 통합한 독특하고 고품질이며 저렴한 거래 도구입니다. 이 업데이트를 통해 이중 시간대를 표시할 수 있습니다. 더 높은 TF를 표시할 수 있을 뿐만 아니라 차트 TF와 더 높은 TF 모두를 표시할 수 있습니다: 중첩 영역 표시. 모든 Supply Demand 트레이더들이 좋아할 것입니다. :) 중요한 정보 공개 Advanced Supply Demand의 잠재력을 극대화하려면 다음을 방문하십시오. https://www.mql5.com/ko/blogs/post/720245   진입 또는 목표의 명확한 트리거 포인트를 정확히 찾아냄으로 해서 거래가 어떻게 개선될지 상상해 보십시오. 새로운 알고리즘을 기반으로 매수자와 매도자 간의 잠재적인 불균형을 훨씬 더 쉽게 분간할 수 있습니다. 왜냐하면 가장 강한 공급영역과 가장 강한 수요 영역과 과거에 어떻게 진행 되었는지를(이
Auto Order Block with break of structure based on ICT and Smart Money Concepts Futures Break of Structure ( BoS )             Order block ( OB )            Higher time frame Order block / Point of Interest ( POI )    shown on current chart           Fair value Gap ( FVG ) / Imbalance   ,  MTF      ( Multi Time Frame )    Volume Imbalance     ,  MTF          vIMB Gap’s Equal High / Low’s     ,  MTF             EQH / EQL Liquidity               Current Day High / Low           HOD /
XQ Indicator MetaTrader 5
Marzena Maria Szmit
5 (1)
Step into the realm of Forex trading with confidence and precision using XQ, a cutting-edge Forex indicator designed to elevate your trading game to unprecedented heights. Whether you're a seasoned trader or just stepping into the world of currency exchange, XQ Forex Indicator empowers you with the insights and signals needed to make informed trading decisions. The signal conditions are a combination of three indicators, and XQ Forex Indicator only display  medium and long-term trends . The ind
ICT, SMC, SMART MONEY CONCEPTS, SMART MONEY, Smart Money Concept, Support and Resistance, Trend Analysis, Price Action, Market Structure, Order Blocks, BOS/CHoCH,   Breaker Blocks ,  Momentum Shift,   Supply&Demand Zone/Order Blocks , Strong Imbalance,   HH/LL/HL/LH,    Fair Value Gap, FVG,  Premium  &   Discount   Zones, Fibonacci Retracement, OTE, Buy Side Liquidity, Sell Side Liquidity, BSL/SSL Taken, Equal Highs & Lows, MTF Dashboard, Multiple Time Frame, BigBar, HTF OB, HTF Market Structure
Blahtech Supply Demand MT5
Blahtech Limited
4.57 (14)
Was: $299  Now: $99   Supply Demand uses previous price action to identify potential imbalances between buyers and sellers. The key is to identify the better odds zones, not just the untouched ones. Blahtech Supply Demand indicator delivers functionality previously unavailable on any trading platform. This 4-in-1 indicator not only highlights the higher probability zones using a multi-criteria strength engine, but also combines it with multi-timeframe trend analysis, previously confirmed swings
가격이 역전되고 후퇴함에 따라 시장 구조가 변경됩니다. 시장 구조 반전 경고 표시기는 추세 또는 가격 움직임이 고갈에 가까워지고 반전할 준비가 되었음을 식별합니다. 일반적으로 반전이나 큰 하락이 일어나려고 할 때 발생하는 시장 구조의 변화를 알려줍니다. 지표는 가능한 고갈 지점 근처에서 새로운 고점 또는 저점이 형성될 때마다 초기에 돌파와 가격 모멘텀을 식별합니다. 표시기는 반대쪽에 있는 마지막 촛불에 직사각형을 그립니다. 그런 다음 현재의 단기 추세에서 계속 움직이기 때문에 가격과 함께 직사각형을 따라갈 것입니다. 가격이 사각형 위나 아래로 다시 닫힐 정도로 약해지면 시장 구조에 잠재적인 변화가 일어나고 있음을 나타냅니다. 그런 다음 표시기는 방향의 잠재적인 이동과 추세 또는 주요 하락의 가능한 반전 시작에 대해 경고합니다. 작동 방식을 보려면 아래의 작동 표시기를 참조하십시오! 모든 쌍 및 주요 기간을 모니터링하는 대시보드: https://www.mql5.com/
ON Trade Gann Squares MT5
Abdullah Alrai
5 (1)
간 스퀘어 지표는 W.D. 간이 쓴 "시장 예측을 위한 수학적 공식" 기사에 기반한 강력한 시장 분석 도구입니다. 이 도구는 수학적 개념과 간 이론을 사용하여 정확한 시장 분석을 수행합니다. 144, 90, 52의 제곱과 9의 제곱을 사용합니다. 또한 의 9의 제곱근 및 해당 제곱의 채널 및 스타 패턴과의 관련성을 통합합니다. 사용자 메뉴얼 및 적용: 이 지표를 사용하기 전에 사용자 메뉴얼을 읽고 질문이 있을 경우 문의하시기 바랍니다. 전체 메뉴얼은 웹사이트에서 제공됩니다. MT5의 전체 버전을 구매하거나 MT4의 무료 버전을 테스트할 수 있습니다. 두 버전 모두 링크에서 확인하실 수 있습니다. 주요 기능 및 기능: 간 스퀘어 지표는 정확한 결정을 위해 기하학적 개념과 간 이론을 활용하는 시장 분석을 위한 포괄적인 도구 집합을 제공합니다. 주요 기능은 다음과 같습니다. 9의 제곱 분석:   이 지표는 9의 제곱에 대한 수평 선, 스타 패턴, 그리드 및 간 팬을 그릴 수 있습니다. 간
AW Trend Predictor MT5
AW Trading Software Limited
4.76 (54)
하나의 시스템에서 추세와 고장 수준의 조합입니다. 고급 지표 알고리즘은 시장 노이즈를 필터링하고 추세, 진입점 및 가능한 출구 수준을 결정합니다. 표시기 신호는 통계 모듈에 기록되어 가장 적합한 도구를 선택하여 신호 기록의 효율성을 보여줍니다. 이 표시기는 이익 실현 및 손절매 표시를 계산합니다. 매뉴얼 및 지침 ->   HERE   / MT4 버전 ->   HERE 지표로 거래하는 방법: Trend Predictor로 거래하는 것은 3단계로 간단합니다. 1단계 - 포지션 열기 70% 이상의 성공률로 매수 신호를 받았습니다. 2단계 - StopLoss 결정 반대 신호로 트렁크 선택 3단계 - 이익 실현 전략 정의 전략 1: TP1 도달 시 전체 포지션 청산 전략 2: TP1 도달 시 포지션의 50% 청산 및 TP2 도달 시 나머지 50% 청산 전략 3: 추세 반전 시 전체 포지션 청산 이익: 결과를 다시 그리지 않음, 신호는 엄격하게 양초가 닫힐 때 어드바이저에서 사용할 수 있습니
Volume by Price MT5
Brian Collard
5 (3)
The Volume by Price Indicator for MetaTrader 5 features Volume Profile and Market Profile TPO (Time Price Opportunity). Get valuable insights out of currencies, equities and commodities data. Gain an edge trading financial markets. Volume and TPO histogram bar and line charts. Volume Footprint charts. TPO letter and block marker charts including split structures. Versatile segmentation and compositing methods. Static, dynamic and flexible ranges with relative and/or absolute visualizations. Lay
TrendLine PRO MT5
Evgenii Aksenov
4.78 (49)
The Trend Line PRO indicator is an independent trading strategy. It shows the trend change, the entry point to the transaction, as well as automatically calculates three levels of Take Profit and Stop Loss protection Trend Line PRO is perfect for all Meta Trader symbols: currencies, metals, cryptocurrencies, stocks and indices Advantages of Trend Line PRO Never redraws its signals The possibility of using it as an independent strategy It has three automatic levels Take Profit and Stop Loss lev
MetaBands M5
Vahidreza Heidar Gholami
4.67 (3)
MetaBands uses powerful and unique algorithms to draw channels and detect trends so that it can provide traders with potential points for entering and exiting trades. It’s a channel indicator plus a powerful trend indicator. It includes different types of channels which can be merged to create new channels simply by using the input parameters. MetaBands uses all types of alerts to notify users about market events. Features Supports most of the channel algorithms Powerful trend detection algorith
소개       Quantum Breakout PRO   , 브레이크아웃 존 거래 방식을 변화시키는 획기적인 MQL5 지표! 13년 이상의 거래 경험을 가진 숙련된 트레이더 팀이 개발한       퀀텀 브레이크아웃 PRO       혁신적이고 역동적인 브레이크아웃 존 전략으로 거래 여정을 새로운 차원으로 끌어올리도록 설계되었습니다. Quantum Breakout Indicator는 5개의 이익 목표 영역이 있는 브레이크아웃 영역의 신호 화살표와 브레이크아웃 상자를 기반으로 한 손절 제안을 제공합니다. 초보자 거래자와 전문 거래자 모두에게 적합합니다. Quantum EA 채널:       여기를 클릭하세요 중요한! 구매 후 설치 매뉴얼을 받으려면 개인 메시지를 보내주십시오. 추천: 기간: M15 통화쌍: GBPJPY, EURJPY, USDJPY,NZDUSD, XAUUSD 계정 유형: 스프레드가 매우 낮은 ECN, Raw 또는 Razor 브로커 시간: GM
Gartley Hunter Multi
Siarhei Vashchylka
5 (5)
Gartley Hunter Multi - An indicator for searching for harmonic patterns simultaneously on dozens of trading instruments and on all classic timeframes: (m1, m5, m15, m30, H1, H4, D1, Wk, Mn). Manual (Be sure to read before purchasing) | Version for MT4 Advantages 1. Patterns: Gartley, Butterfly, Shark, Crab. Bat, Alternate Bat, Deep Crab, Cypher 2. Simultaneous search for patterns on dozens of trading instruments and on all classic timeframes 3. Search for patterns of all possible sizes. Fr
Trend Line Map Pro MT5
STE S.S.COMPANY
4.67 (9)
트렌드 라인 맵 표시기는 트렌드 스크리너 표시기의 애드온입니다. Trend screener(Trend Line Signals)에 의해 생성된 모든 신호에 대한 스캐너로 작동합니다. Trend Screener Indicator 기반의 Trend Line Scanner입니다. Trend Screener Pro 표시기가 없으면 Trend Line Map Pro가 작동하지 않습니다. It's a Trend Line Scanner based on Trend Screener Indicator. If you don't have Trend Screener Pro Indicator,     the Trend Line Map Pro will not work . MQL5 블로그에 액세스하여 추세선 지도 표시기의 무료 버전을 다운로드할 수 있습니다. Metatrader Tester 제한 없이 구매하기 전에 사용해 보십시오. : 여기를 클릭하세요 1. 쉽게 얻을 수 있는 이점 통화 및
TrendDecoder Premium MT5
Christophe, Pa Trouillas
5 (1)
이제 메타트레이더에서 사용 가능 범위 및 다음 가능한 움직임 식별       |      추세의 초기 신호와 강도를 확인하세요       |      반전 전 명확한 출구 확보       |      가격이 테스트 할 피보 레벨 파악 비추적, 비지연 지표 - 수동 및 자동 거래에 이상적 - 모든 자산 및 모든 시간 단위에 적합 - 출시 시 50% 할인   - 이후 >> $149로 복귀 구매 후   이 채널로 문의 하여 권장 설정을 확인하세요. MT4 버전:   여기를 클릭하세요 BladeSCALPER 및 PowerZONES 로 전체 방법을 확인하세요. 어떤 서비스인가요? 트렌드디코더는 추세 모니터링을 간단하고 쉽게 하기 위한 여러 혁신 기술의 집약체입니다. 투영 추세선(투영 추세선)   - 다가오는 추세의 속도 기준 실시간 추세선과 투영 추세선 비교   - 시장이 이전과 같은 방향으로 움직이고 있는지, 아니면 둔화되고 있는지? 실시간 추세선 교차   - 추세가 궤
TPSproTREND PrO MT5
Roman Podpora
5 (5)
TPSpro TRENDPRO  - is a trend indicator that automatically analyzes the market and provides information about the trend and each of its changes, as well as giving signals for entering trades without redrawing! The indicator uses each candle, analyzing them separately. referring to different impulses - up or down impulse. Exact entry points into transactions for currencies, crypto, metals, stocks, indices!  -  Version MT4                  DETAILED DESCRIPTION        /       TRADING SETUPS       
Golden Spikes Detector
Batsirayi L Marango
5 (1)
Golden Spikes Detector This indicator is based on an advanced strategy primarily for trading spikes on Boom and Crash Indices. Complex algorithms were implemented to detect high probability entries only. It alerts on potential Buy and Sell entries. To trade spikes on the Deriv or Binary broker, only take Buy Boom and Sell Cash alerts. It was optimised to be loaded on 5-minute timeframe although multiple timeframe analysis is done in the background. Features ·             Desktop pop up and sound
Matrix Arrow Indicator MT5
Juvenille Emperor Limited
5 (14)
매트릭스 화살표 표시기 MT5 는 외환, 상품, 암호 화폐, 지수, 주식과 같은 모든 기호/도구에 사용할 수 있는 100% 다시 칠하지 않는 다중 기간 표시기를 따르는 고유한 10 in 1 추세입니다.  Matrix Arrow Indicator MT5 는 다음과 같은 최대 10개의 표준 지표에서 정보와 데이터를 수집하여 초기 단계에서 현재 추세를 결정합니다. 평균 방향 이동 지수(ADX) 상품 채널 지수(CCI) 클래식 하이켄 아시 캔들 이동 평균 이동 평균 수렴 발산(MACD) 상대 활력 지수(RVI) 상대 강도 지수(RSI) 포물선 SAR 스토캐스틱 오실레이터 윌리엄스의 백분율 범위 모든 지표가 유효한 매수 또는 매도 신호를 제공하면 강력한 상승/하락 추세를 나타내는 다음 캔들/막대가 시작될 때 해당 화살표가 차트에 인쇄됩니다. 사용자는 사용할 표시기를 선택하고 각 표시기의 매개변수를 개별적으로 조정할 수 있습니다. 매트릭스 화살표 표시기 MT5는 선택한 표시기에서만 정보를 수
IX Power MT5
Daniel Stein
5 (2)
IX Power는   마침내 FX Power의 탁월한 정밀도를 외환이 아닌 기호에도 적용했습니다. 좋아하는 지수, 주식, 원자재, ETF, 심지어 암호화폐까지 단기, 중기, 장기 추세의 강도를 정확하게 파악할 수 있습니다. 단말기가 제공하는   모든 것을 분석할   수 있습니다. 사용해 보고 트레이딩   타이밍이 크게 향상되는   것을 경험해 보세요. IX Power 주요 특징 단말기에서 사용 가능한 모든 거래 심볼에 대해 100% 정확한 비재도장 계산 결과 제공 사전 구성 및 추가적으로 개별 구성 가능한 강도 분석 기간의 드롭다운 선택 가능 이메일, 메시지, 모바일 알림을 통한 다양한 알림 옵션 제공 EA 요청을 위한 액세스 가능한 버퍼 더 나은 성능을 위한 사용자 지정 가능한 계산 한도 더 많은 것을 보고 싶은 사용자를 위한 특별 다중 인스턴스 설정 모든 차트에서 좋아하는 색상을 위한 무한한 그래픽 설정 가능 Windows 11 및 macOS 스타일의 둥
The 1 2 3 Pattern Scanner MT5
Reza Aghajanpour
5 (12)
** All Symbols x All Timeframes scan just by pressing scanner button ** ***Contact me after purchase to send you instructions and add you in "123 scanner group" for sharing or seeing experiences with other users. After 15 years of experience in the markets and 3 years of programming, Winner indicator is ready. I would like to share with you! Introduction The 123 Pattern Scanner indicator with a special enhanced algorithm is a very repetitive common pattern finder with a high success rate . Inte
제작자의 제품 더 보기
Multi Chart Crosshairs MT5
Robert Gerald Wood
5 (7)
이 표시기는 다양한 시간 척도의 많은 차트를 더 빠르고 쉽게 검토할 수 있도록 설계되었습니다. 여러 차트에서 시간 및 가격 추적 한 차트의 심볼 변경 및 동일한 심볼의 다른 모든 차트도 변경됩니다. 사용하기 쉽고 빠르게 마스터하기 표시기를 사용하면 동일한 기호에 열려 있는 다른 모든 차트에서 마우스 포인터가 현재 차트에 있는 가격과 시간을 식별할 수 있습니다. 이렇게 하면 일반적으로 동일한 위치를 식별하는 데 약간의 시간을 소비해야 하는 반면 여러 해도에 대한 정보를 빠르게 볼 수 있습니다. 열려 있는 모든 차트에서 시간만 추적하도록 선택할 수도 있습니다. 이를 통해 다이버전스 헌팅 시 쉽게 탐색할 수 있습니다. 한 차트에서 심볼을 변경하면 동일한 심볼의 다른 모든 차트가 해당 기간 설정을 유지하면서 새 심볼로 전환됩니다. 사용하는 방법 차트를 검토할 때 추세와 거래 수준을 식별하기 위해 여러 기간을 살펴보는 것을 좋아합니다. 나는 그것을 돕기 위해 이 도구를 만들었고 또한 장기간
TheStrat Levels MT5
Robert Gerald Wood
5 (1)
This indicator draws the prior Highs and Lows for multiple timeframes, and can display potential Take Profit and Stop Loss levels. In Rob Smith's # The Strat  terms, these are potential entry points, or alternatively potential targets for open positions. I like to use them in both ways. On a lower timeframe, say 5 minutes to get a good entry on a daily or weekly level, and then as a potential target. Very small stops required giving an excellent risk/reward ratio. Key Features  - Levels from Ho
TheStrat Monitor
Robert Gerald Wood
3 (2)
If you've not already learnt about The Strat trading strategy , go google it now. I promise it won't be a waste of your time, and you will likely learn some new tricks whether you use it or not. OK, so now you know what TheStrat is, you will be able to understand what this indicator can do for you. Key Features In short, the Indicator will: Show Timeframe Continuity for all supported timeframes Supports two timeset views, Day trader and Swing trader Show when Full Timeframe Continuity is in pl
TheStrat Levels
Robert Gerald Wood
This indicator draws the prior Highs and Lows for multiple timeframes, and can display potential Take Profit and Stop Loss levels. In Rob Smith's # The Strat   terms,   these are potential entry points, or alternatively potential targets for open positions. I like to use them in both ways. On a lower timeframe, say 5 minutes to get a good entry on a daily or weekly level, and then as a potential target. Very small stops required giving an excellent risk/reward ratio. Please watch the DEMO video
TheStrat Candles
Robert Gerald Wood
4.5 (2)
이 표시기는 다음을 기준으로 각 캔들 위 또는 아래에 레이블을 그립니다.       롭 스미스       더 스트랫       차트에서 시간이 지남에 따라 발전합니다. 가격이 변화함에 따라 캔들은 세 가지 상태 사이를 전환할 수 있습니다. 캔들이 처음 시가를 형성할 때 이전 캔들의 고저점 내에 완전히 위치하면 유형 1로 시작합니다. 시간이 지남에 따라 이전 캔들의 고점이나 저점을 돌파하면 유형 2, 그리고 가격 움직임이 변동적이고 방향성이 없다면 이전 양초의 반대편을 깨고 유형 3이 될 수 있습니다. 양초 각 양초는 이전 양초와의 관계로 정의됩니다. 유형 1 - 내부 캔들   - 캔들이 완전히 이전 캔들의 고점과 저점 내에 있습니다. 내부 양초는 시장이 우유부단한 지점에 있음을 보여줍니다. 유형 2 - 추세 양초   - 양초가 이전 양초의 고점 또는 저점 위나 아래로 확장되지만 둘 다는 아닙니다. 유형 3 - 외부 캔들   - 캔들이 이전 캔들의 고가와 저가를
Multi Chart Crosshairs
Robert Gerald Wood
5 (2)
This indicator is designed to make reviews of many charts on different timescales quicker, and easier to do. Track Time and Price across multiple charts Change Symbol on one chart and all other charts of the same symbol will be changed too. Easy to use, quick to master The indicator allows you to identify the price and time where the mouse pointer is on the current chart, across all other charts open on the same Symbol. This allows you to quickly see information on multiple charts whereas normal
TheStrat Patterns
Robert Gerald Wood
This indicator will draw patterns based on Rob Smith's The Strat as they emerge in real time on your chart. As price evolves, TheStrat offers 18 distinct price action patterns that can help you get good entries in the market. Each pattern involves two or three candles, and this indicator will draw a bounding box around the candles and name the pattern. The indicator also shows when a potential setup is forming, known by stratters as an Actionable signal. Candles Each candle is defined by i
Chart Drawing Cloner
Robert Gerald Wood
5 (4)
이 스크립트를 사용하면 추세선, 피보나치 되돌림 등과 같은 모든 유형의 그리기 개체를 하나 이상의 다른 차트에 복사할 수 있습니다. 기본적으로 스크립트는 현재 차트, 즉 스크립트가 적용된 차트의 모든 개체를 현재 로드된 동일한 심볼의 다른 차트에 복사합니다. 설정 목적지 시간 프레임 PERIOD_CURRENT 이외의 값으로 설정하면 스크립트가 적용된 차트와 동일한 심볼의 열린 차트에 객체를 복사합니다. 값을 특정 기간(예: PERIOD_D1)으로 설정하면 동일한 기호 AND 기간의 차트만 업데이트됩니다. CopyObjectsOfType 이것을 복사하려는 특정 유형의 개체로 설정할 수 있습니다. 그러면 해당 유형의 개체만 다른 차트에 복사됩니다. CopyIndicatorWindowObjects True로 설정하면 표시기 창의 개체도 복사됩니다. 이는 소스 차트와 동일한 지표를 동일한 순서로 갖는 두 번째 차트에 의존합니다. 마음의 내용에 차트 사이에 개체를 복제하십시
FREE
TheStrat TFC Monitor MT5
Robert Gerald Wood
5 (1)
The Strat를   사용하여 거래할 때 여러 시간대를 주시하는 것이 중요합니다. 이 표시기는 각 기간에 대한 현재 캔들의 일일, 주간, 월간 및 분기별 상태를 표시합니다. 원 아이콘은 해당 기간의 캔들이 현재 내부 또는 TheStrat 용어로 유형 1임을 나타냅니다. 인사이드 데이 양초가 가격 움직임을 통합하고 있으며 우리는 범위의 돌파를 찾고 있습니다. 위 또는 아래를 가리키는 삼각형 아이콘은 추세 양초 또는 TheStrat 용어의 유형 2입니다. 추세 양초는 강세 또는 약세일 수 있으며, 이는 이전 양초 범위를 벗어나 현재 한 방향으로 추세를 보이고 있음을 나타냅니다. 사각형 아이콘은 아웃사이드 캔들 또는 Strat 용어로 Type 3입니다. 이것은 두 가지를 나타냅니다. 하나는 가격이 해당 기간에 대한 방향에 대해 결정되지 않았고 상당히 고르지 못할 가능성이 높으며, 두 번째는 더 낮은 기간에 짧은 반전을 거래할 수 있는 좋은 기회가 있을 가능성이 있다는 것입니다. 사각형은
나는 Rob Smith의 TheStrat에 대해 배우는 동안 이 간단한 표시기를 만들었고 그것이 매우 유용하다고 생각하여 여러분과 공유해야겠다고 생각했습니다. 유용하다고 생각되면 MQL5에 게시한 다른 지표를 살펴보십시오. 이 지표는 차트에서 더 높은 기간에서 선택한 가격 수준을 보여주는 단일 선을 그립니다. 설정을 사용하면 표시되는 기간을 완전히 제어할 수 있지만   기본적으로 한 단계 위로 스케일을 이동하여 더 높은 기간 자체를 계산합니다. 예를 들어 H1 차트를 열면 H4 차트의 데이터가 표시됩니다. 설정 TrackTimeframe 가격 수준을 그릴 기간을 선택합니다. 기본 설정인 현재로 두면 적절한 기간이 선택됩니다. 선이 항상 위쪽으로 조정되므로 차트를 검토하고 기간 사이를 변경하는 경우 매우 유용합니다. 트랙값 아래 표준 가격 값에서 하나를 선택할 수 있습니다. 기본값은 시가입니다. PRICE_CLOSE 종가 PRICE_OPEN 시가 가격_높음 해당 기간의 최대 가격
FREE
A simple script that can delete all the drawing objects on a chart, or just the objects of a specific type. Settings: DeleteObjectsOfType By default the value will be blank which means ALL drawing objects on the chart will be deleted. If you only wish to delete specific types of drawing object, change this setting to the type of object to delete. For example, Fibonacci Retracement, Text, Label or Trend Line. Please see the demonstration video for more information.
FREE
This script allows you to toggle the "Show Trade Levels" option, but for the current chart only. Normally, you can only change the setting using the Options -> Chart menu for ALL charts, but this script allows you to do it for a SINGLE chart. I'm using it when I take screenshots, because most of the time I'm not trying to show the trades, just some functionality of one of my other tools. Iif you need that functionality, then this script is very helpful! If the script helps you, please let me
FREE
TheStrat FTFC
Robert Gerald Wood
FTFC는 Rob Smith의   The Strat   에서 정의한 전체 시간 프레임 연속성을 나타냅니다. 이 지표는 분기별, 월별, 주별, 일별 또는 시간별 시가 수준 중 가장 높은 값 중 하나와 해당 값 중 가장 낮은 값 중 두 번째로 차트에 두 개의 선을 그립니다. 이것은 거래가 한 방향으로 매우 강하게 될 가능성이 높은 위 또는 아래의 채널을 제공합니다. 라인 사이에서 가격 조치는 더 고르지 않으며 더 넓은 스톱을 사용할 수 있습니다. 고점과 저점 사이의 중간 지점을 표시하기 위해 세 번째 파선도 그려집니다. 시장이 특정 방향으로 가격을 밀고자 하기 때문에 지지나 저항을 찾기에 좋은 경우가 많습니다. 색상을 NONE으로 설정하여 선택하면 이 선을 끌 수 있습니다. 설정 분기별 수준 포함 일부 사람들이 무시하는 것을 선호하므로 분기별 시가를 계산에 포함하도록 선택할 수 있습니다. IncludeCurrentTimeframeOpen true인 경우 현재 표시된 기간이 H1, D
Round Price Levels
Robert Gerald Wood
시장은 어림수를 정말 좋아하며 시장이 하락할 때 지지선 역할을 하거나 가격이 상승할 때 저항선 역할을 하는 경우가 많습니다. 이 지표는 라운드 값에서 가격 수준을 그리도록 설계되었습니다. 이 작업은 자동으로 수행되지만 이를 재정의하고 보고 싶은 수준을 결정할 수도 있습니다. 라운드 레벨은 10단계만큼 간단할 수 있으므로 10, 20, 30 등 또는 Forex에서 작업하는 경우 0.1 또는 0.01에서 변경 사항을 보고 싶을 수 있습니다. 표시기는 각각 다른 형식을 사용하여 Major 및 Minor라는 두 클래스의 라인을 그립니다. 이를 통해 레벨의 서로 다른 두 가지 변화 사이의 변화를 동시에 볼 수 있습니다. 알림 이 표시기에는 가격이 구성 가능한 거리 내에 있을 때 메이저, 마이너 또는 두 가격 수준에서 경보를 울리는 기능이 포함됩니다. 자동 설정 기본적으로 지표는 메이저 및 마이너 가격 모두에 대해 적절한 수준을 결정합니다. 언제든지 화면에 표시할 줄 수를 제어하는 구
TheStrat TFC Monitor
Robert Gerald Wood
The Strat를   사용하여 거래할 때 여러 시간대를 주시하는 것이 중요합니다. 이 표시기는 각 기간에 대한 현재 캔들의 일일, 주간, 월간 및 분기별 상태를 표시합니다. 원 아이콘은 해당 기간의 캔들이 현재 내부 또는 TheStrat 용어로 유형 1임을 나타냅니다. 인사이드 데이 양초가 가격 움직임을 통합하고 있으며 우리는 범위의 돌파를 찾고 있습니다. 위 또는 아래를 가리키는 삼각형 아이콘은 추세 양초 또는 TheStrat 용어의 유형 2입니다. 추세 양초는 강세 또는 약세일 수 있으며, 이는 이전 양초 범위를 벗어나 현재 한 방향으로 추세를 보이고 있음을 나타냅니다. 사각형 아이콘은 아웃사이드 캔들 또는 Strat 용어로 Type 3입니다. 이것은 두 가지를 나타냅니다. 하나는 가격이 해당 기간에 대한 방향에 대해 결정되지 않았고 상당히 고르지 못할 가능성이 높으며, 두 번째는 더 낮은 기간에 짧은 반전을 거래할 수 있는 좋은 기회가 있을 가능성이 있다는 것입니다. 사각형은
Active Pivot Levels
Robert Gerald Wood
5 (1)
피벗 수준은 모든 시장에서 인정되는 잘 확립된 기술 수준입니다. 이 표시기는 모든 기호에 대해 현재 분기별, 월별, 주별, 일별 및 4시간별 피벗을 차트에 그립니다. 또한 각 기간에 대한 지원 및 저항 수준을 표시하고 수준 1에서 4까지 표시할 항목을 선택할 수 있습니다.     다음에서 피벗 유형을 선택합니다. 기준 도당 데마크 우디 피보나치 DeMark 피벗에는 원래 사양에 따라 단일 지원 및 저항 수준이 있습니다. 표시기 벽은 선이 가격에 닿은 경우 선이 그려지는 방식을 변경합니다. 이것은 매우 도움이 될 수 있으며 라인 지원 또는 저항의 강도는 일단 만지면 상당히 감소합니다. 각 기간에 대해 예측 피벗 수준을 표시하도록 선택할 수 있습니다. 이것은 일반 피벗과 동일한 계산을 사용하지만 현재 불완전한 기간에서 작동합니다. 따라서 가격이 이미 범위의 대부분을 커버하는 해당 기간이 끝날 무렵에 가장 잘 사용됩니다. 설정 모든 설정에 대한 자세한 내용은 별도의 블로그 게시물에서
ATR Extremes
Robert Gerald Wood
ATR(Average True Range)은 설정된 기간 동안 가격의 움직임을 측정하는 일반적으로 사용되는 지표입니다. 그러나 그것이 주는 가치는 어떤 종류의 경계에서도 정의되지 않기 때문에 손절매나 이익실현 계산 이외의 다른 용도로 사용하는 것은 거의 불가능합니다. 이 표시기는 표준 ATR 표시기이지만 극한값을 볼 수 있도록 백분위수 구분을 도입했습니다. 백분위수와 중앙값 분할 중에서 선택할 수 있습니다. 백분위수 수준 백분위수 수준은 1%, 5%, 20%, 50%, 80%, 95%, 99%로 표시되며 가격이 다른 모든 값과 관련된 위치를 보여줍니다. 예를 들어, 5% 수준은 선 아래에서 ATR 판독값의 5%만이 그렇게 낮아진다고 말하고 99%는 그 수준보다 높은 ATR 값 중 1%만이 그렇게 높다고 말합니다. 80% 이상에서는 새로운 거래에 대해 포지션 크기를 낮추기 시작할 수 있으며 95% 이상은 모멘텀이 바뀌기 전에 이익을 취하기에 좋은 시기일 수 있습니다
Range Exhaustion
Robert Gerald Wood
범위 소진은 가격이 현재 기간의 예상 범위를 충족하거나 초과할 때 발생합니다. 이 수준에서 가격은 기간 초반에 비해 모멘텀을 잃기 시작하므로 새로운 포지션을 취하지 않도록 하는 것이 좋습니다. 이 지표는 일별, 주별 및 월별 기간에 대한 수준을 표시하여 차트에서 이러한 일이 발생할 가능성이 있는 위치를 보여줍니다. 이러한 고갈 수준을 초과하는 가격을 보면 움직임의 모멘텀이 매우 강하고 더 높은 기간 수준으로 향하고 있음을 알 수 있습니다. 지표는 기본 설정에 따라 ATR(Average True Range) 또는 ADR(Average Range) 계산을 사용할 수 있습니다. 기본적으로 우리는 Forex 차트에서 더 잘 작동하는 ATR을 사용하지만 ADR은 주식 기반 지수 및 기호에서 우위를 점합니다. 표시기에는 아래에 설명된 여러 그리기 모드가 있어 필요에 맞게 조정할 수 있습니다. 설정 계산 모드 레벨 계산을 위해 ATR(AverageTrueRange) 또는 ADR(Averag
TheStrat FTFC MT5
Robert Gerald Wood
FTFC는 Rob Smith의   The Strat   에서 정의한 전체 시간 프레임 연속성을 나타냅니다. 이 지표는 분기별, 월별, 주별, 일별 또는 시간별 시가 수준 중 가장 높은 값 중 하나와 해당 값 중 가장 낮은 값 중 두 번째로 차트에 두 개의 선을 그립니다. 이것은 거래가 한 방향으로 매우 강하게 될 가능성이 높은 위 또는 아래의 채널을 제공합니다. 라인 사이에서 가격 조치는 더 고르지 않으며 더 넓은 스톱을 사용할 수 있습니다. 최고점과 최저점 사이의 중간 지점을 표시하기 위해 세 번째 점선도 그려집니다. 시장이 특정 방향으로 가격을 밀고자 하기 때문에 지지나 저항을 찾기에 좋은 경우가 많습니다. 색상을 NONE으로 설정하여 선택하면 이 선을 끌 수 있습니다. 설정 분기별 수준 포함 일부 사람들이 무시하는 것을 선호하므로 분기별 시가를 계산에 포함하도록 선택할 수 있습니다. IncludeCurrentTimeframeOpen true인 경우 현재 표시된 기간이 H1
TheStrat Patterns MT5
Robert Gerald Wood
This indicator will draw patterns based on   Rob Smith's   The Strat   as they emerge in real time on your chart. As price evolves,   TheStrat   offers 18 distinct price action patterns that can help you get good entries in the market. Each pattern involves two or three candles, and this indicator will draw a bounding box around the candles and name the pattern. The indicator also shows when a potential setup is forming, known by stratters as an Actionable signal. Candles Each candle is de
TheStrat Monitor MT5
Robert Gerald Wood
5 (1)
Strat 거래 전략   에 대해 아직 배우지 않았다면 지금 Google로 이동하십시오. 나는 그것이 당신의 시간 낭비가 아닐 것이라고 약속하며, 당신이 그것을 사용하든 안 하든 몇 가지 새로운 요령을 배우게 될 것입니다. 자, 이제 TheStrat이 무엇인지 알았으니 이 지표가 당신을 위해 무엇을 할 수 있는지 이해할 수 있을 것입니다. 주요 특징들 즉, 지표는 다음을 수행합니다. 지원되는 모든 기간에 대한 기간 연속성 표시 Day trader와 Swing trader의 두 가지 시간 설정 보기를 지원합니다. 연속된 4개의 기간에 대해 전체 기간 연속성이 있는 경우 표시 각 기간에 대한 현재 캔들 상태 표시 모든 시간대에 현재 패턴이 있는 경우 표시 In-force 및 Actionable 패턴을 모두 표시합니다. 5초마다 업데이트(1초부터 설정 가능) 패널을 클릭하여 선택한 종목 및 기간에 대한 차트를 열 수 있습니다. 차트를 여는 데 사용할 차트 템플릿을 선택할 수 있습니다.
피벗 수준은 모든 시장에서 인정되는 잘 확립된 기술 수준입니다. 이 표시기는 모든 기호에 대해 현재 분기별, 월별, 주별, 일별 및 4시간별 피벗을 차트에 그립니다. 또한 각 기간에 대한 지원 및 저항 수준을 표시하고 수준 1에서 4까지 표시할 항목을 선택할 수 있습니다.     다음에서 피벗 유형을 선택합니다. 기준 도당 데마크 우디 피보나치 DeMark 피벗에는 원래 사양에 따라 단일 지원 및 저항 수준이 있습니다. 표시기 벽은 선이 가격에 닿은 경우 선이 그려지는 방식을 변경합니다. 이것은 매우 도움이 될 수 있으며 라인 지원 또는 저항의 강도는 일단 만지면 상당히 감소합니다. 각 기간에 대해 예측 피벗 수준을 표시하도록 선택할 수 있습니다. 이것은 일반 피벗과 동일한 계산을 사용하지만 현재 불완전한 기간에서 작동합니다. 따라서 가격이 이미 범위의 대부분을 커버하는 해당 기간이 끝날 무렵에 가장 잘 사용됩니다. 설정 모든 설정에 대한 자세한 내용은 별도의 블로그 게시물에서
Round Price Levels MT5
Robert Gerald Wood
시장은 어림수를 정말 좋아하며 시장이 하락할 때 지지선 역할을 하거나 가격이 상승할 때 저항선 역할을 하는 경우가 많습니다. 이 지표는 라운드 값에서 가격 수준을 그리도록 설계되었습니다. 이 작업은 자동으로 수행되지만 이를 재정의하고 보고 싶은 수준을 결정할 수도 있습니다. 라운드 레벨은 10단계만큼 간단할 수 있으므로 10, 20, 30 등 또는 Forex에서 작업하는 경우 0.1 또는 0.01에서 변경 사항을 보고 싶을 수 있습니다. 표시기는 각각 다른 형식을 사용하여 Major 및 Minor라는 두 클래스의 라인을 그립니다. 이를 통해 레벨의 서로 다른 두 가지 변화 사이의 변화를 동시에 볼 수 있습니다. 알림 이 표시기에는 가격이 구성 가능한 거리 내에 있을 때 메이저, 마이너 또는 두 가격 수준에서 경보를 울리는 기능이 포함됩니다. 자동 설정 기본적으로 지표는 메이저 및 마이너 가격 모두에 대해 적절한 수준을 결정합니다. 언제든지 화면에 표시할 줄 수를 제어하는 구성 가능
ATR Extremes MT5
Robert Gerald Wood
ATR(Average True Range)은 일정 기간 동안 가격 변동량을 측정하는 데 일반적으로 사용되는 지표입니다. 그러나 그것이 제공하는 가치는 어떤 종류의 경계 내에서 정의되지 않으므로 손절매 또는 이익실현 계산 이외의 용도로 사용하는 것은 거의 불가능합니다. 이 지표는 표준 ATR 지표이지만 극단을 볼 수 있도록 백분위수 경계를 도입했습니다. 백분위수와 분할 중앙값이라고 하는 것 중에서 선택할 수 있습니다. 백분위수 수준 백분위수 수준은 1%, 5%, 20%, 50%, 80%, 95%, 99%로 표시되며 다른 모든 값과 관련하여 가격이 어디에 있는지 보여줍니다. 예를 들어, 5% 수준은 선 아래에서 ATR 판독값의 5%만 그만큼 낮아지고 99%는 해당 수준 위의 ATR 값 중 1%만 그만큼 높아진다는 의미입니다. 80% 이상에서는 새로운 거래를 위해 포지션 크기를 낮추기 시작할 수 있으며 95% 이상에서는 모멘텀이 바뀌기 전에 이익을 얻을 수 있는 좋은 시간일 수 있습니다.
Range Exhaustion MT5
Robert Gerald Wood
범위 소진은 가격이 현재 기간의 예상 범위를 충족하거나 초과할 때 발생합니다. 이 수준에서 가격은 기간 초반에 비해 모멘텀을 잃기 시작하므로 새로운 포지션을 취하지 않도록 하는 것이 좋습니다. 이 지표는 일별, 주별 및 월별 기간에 대한 수준을 표시하여 차트에서 이러한 일이 발생할 가능성이 있는 위치를 보여줍니다. 이러한 고갈 수준을 초과하는 가격을 보면 움직임의 모멘텀이 매우 강하고 더 높은 기간 수준으로 향하고 있음을 알 수 있습니다. 지표는 기본 설정에 따라 ATR(Average True Range) 또는 ADR(Average Range) 계산을 사용할 수 있습니다. 기본적으로 우리는 Forex 차트에서 더 잘 작동하는 ATR을 사용하지만 ADR은 주식 기반 지수 및 기호에서 우위를 점합니다. 표시기에는 아래에 설명된 여러 그리기 모드가 있어 필요에 맞게 조정할 수 있습니다. 설정 계산 모드 레벨 계산을 위해 ATR(AverageTrueRange) 또는 ADR(Averag
필터:
리뷰 없음
리뷰 답변
버전 1.30 2023.01.20
Added a buffer to indicate candle type for use with iCustom in your own indicators, Experts or scripts.
The values returned are

0=Unknown - The first candle in the chart will always return this as we need a minimum of two candles to determine candle type.
1 = Inside (Strat type 1)
2 = Trending UP (Strat type 2)
3 = Trending DOWN (Strat type 2)
4 = Outside (Strat type 3)

버전 1.20 2021.06.26
Added ability to choose the location of the state label. It can now go above or below the candle.
버전 1.1 2021.05.20
Minor fix to display logic to ensure candle numbers align correctly