Range Exhaustion MT5
- 지표
-
Robert Gerald Wood
 25년 이상 경력의 전문 소프트웨어 개발자, 이제 나만을 위한 도구를 만들고 더 많은 커뮤니티와 공유합니다.
내 제품에 대한 자세한 내용은 https://www.bunnywood.co.uk를 방문하십시오. - 버전: 1.0
- 활성화: 10
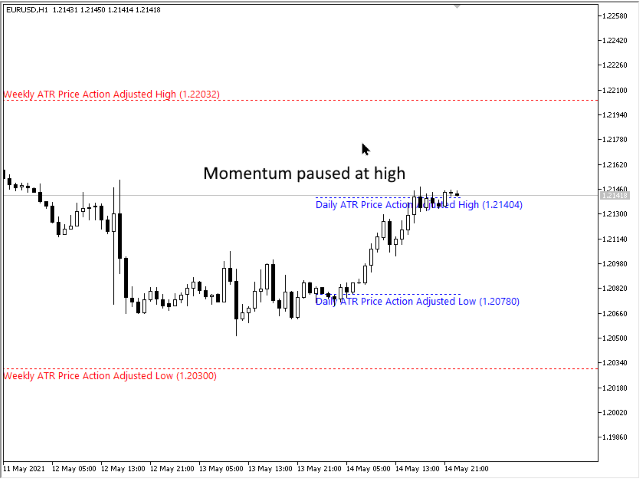
범위 소진은 가격이 현재 기간의 예상 범위를 충족하거나 초과할 때 발생합니다. 이 수준에서 가격은 기간 초반에 비해 모멘텀을 잃기 시작하므로 새로운 포지션을 취하지 않도록 하는 것이 좋습니다.
이 지표는 일별, 주별 및 월별 기간에 대한 수준을 표시하여 차트에서 이러한 일이 발생할 가능성이 있는 위치를 보여줍니다.
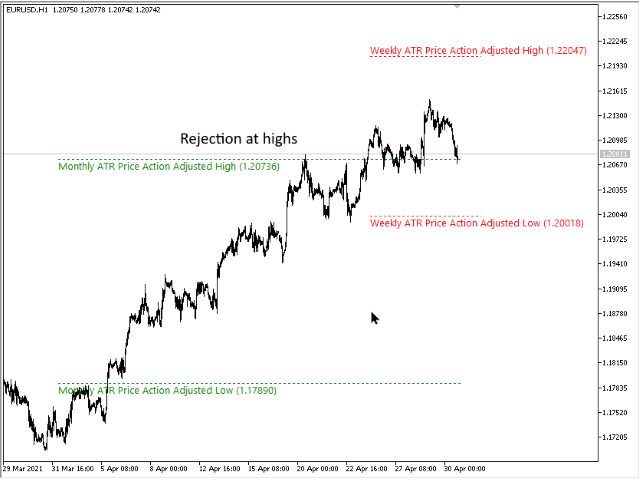
이러한 고갈 수준을 초과하는 가격을 보면 움직임의 모멘텀이 매우 강하고 더 높은 기간 수준으로 향하고 있음을 알 수 있습니다.
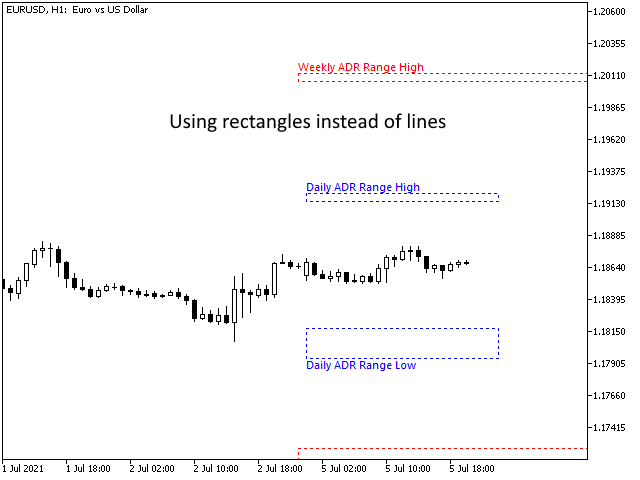
지표는 기본 설정에 따라 ATR(Average True Range) 또는 ADR(Average Range) 계산을 사용할 수 있습니다. 기본적으로 우리는 Forex 차트에서 더 잘 작동하는 ATR을 사용하지만 ADR은 주식 기반 지수 및 기호에서 우위를 점합니다.
표시기에는 아래에 설명된 여러 그리기 모드가 있어 필요에 맞게 조정할 수 있습니다.
설정
계산 모드
레벨 계산을 위해 ATR(AverageTrueRange) 또는 ADR(AverageDailyRange) 중에서 선택합니다.
그리기 모드
표시기는 다양한 방식으로 표시될 수 있습니다.
- 가격 조정 라인 그리기 - 도달한 최고점과 최저점에 따라 기간 동안 레벨이 조정됩니다. 이것이 기본이며 가장 일반적으로 사용되는 방법입니다.
- 예상 최대 추첨 - 레벨은 ATR 또는 ADR 값을 더하거나 뺀 마지막 기간의 고정 값입니다.
- 두 줄 그리기 - 위의 두 줄을 모두 표시합니다.
- 직사각형 그리기 - 상단 및 하단 라인이 조정된 가격 및 예상 최대/최소인 단일 직사각형을 표시합니다.
심사기간
ATR/ADR 값을 계산할 때 사용할 기간입니다.
ShowDailyLimits
true인 경우 일일 소모 수준을 그립니다.
ShowWeeklyLimits
true인 경우 주간 소모 수준을 그립니다.
ShowMonthlyLimits
true인 경우 월간 소모 수준을 그립니다.
설명 표시
true인 경우 레벨에 대한 설명 레이블을 그립니다. false인 경우 선만 그려지지만 선이 무엇을 나타내는지 알아야 할 경우 해당 선에는 도구 설명이 있습니다.
ShowPriceInDescription
true인 경우 레벨 값이 설명 및 툴팁에 추가됩니다.
설명글꼴 크기
설명을 그릴 때 사용할 글꼴 크기
연장선
true인 경우 기간의 끝까지 선을 그리는 대신 선이 차트의 오른쪽으로 무기한 확장됩니다.
각 기간 D1, W1 및 MN1에 대해 다음 설정이 나타납니다.
XX_색상
선과 설명을 그릴 때 사용할 색상
XX_LineWidth
그릴 선의 너비입니다. LineStyle이 단색이 아닌 경우 이 값은 무시됩니다. MetaTrader에서는 실선만 폭을 가질 수 있습니다.
XX_LineStyle
표준 선택에서 그릴 선의 유형입니다.