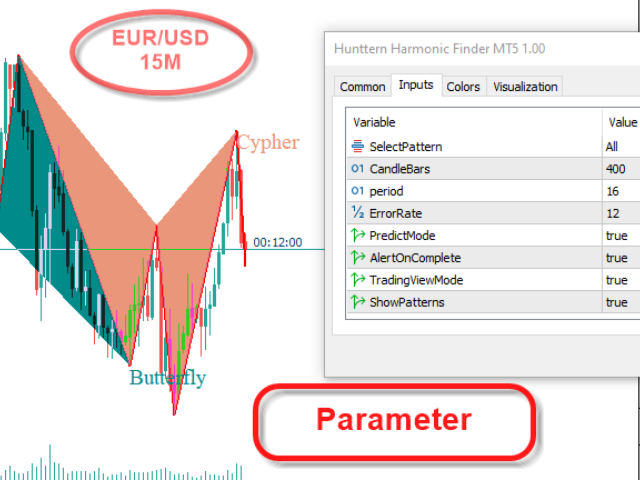
Hunttern Harmonic Finder MT5
- 지표
- 버전: 1.0
- 활성화: 5

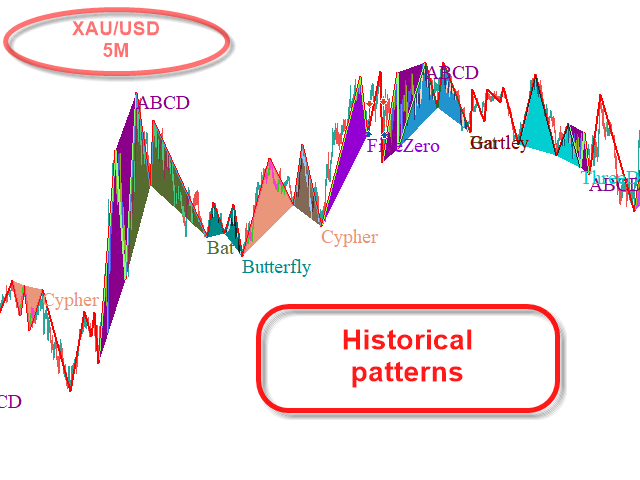
"Hunttern harmonic pattern finder" base on the dynamic zigzag with the notification and prediction mode
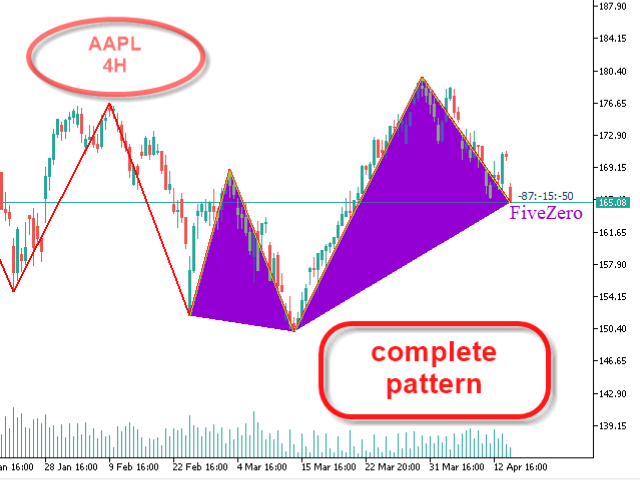
This version of the indicator identifies 11 harmonic patterns and predicts them in real-time before they are completely formed. It offers the ability to calculate the error rate of Zigzag patterns depending on a risk threshold. It moreover sends out a notification once the pattern is complete.
The supported patterns:
- ABCD
- BAT
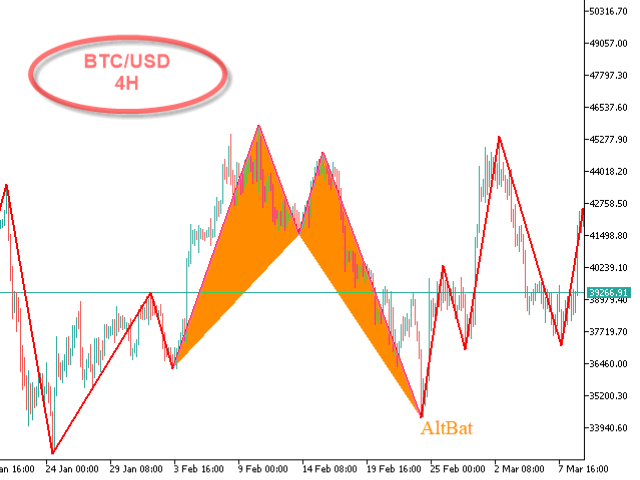
- ALT BAT
- BUTTERFLY
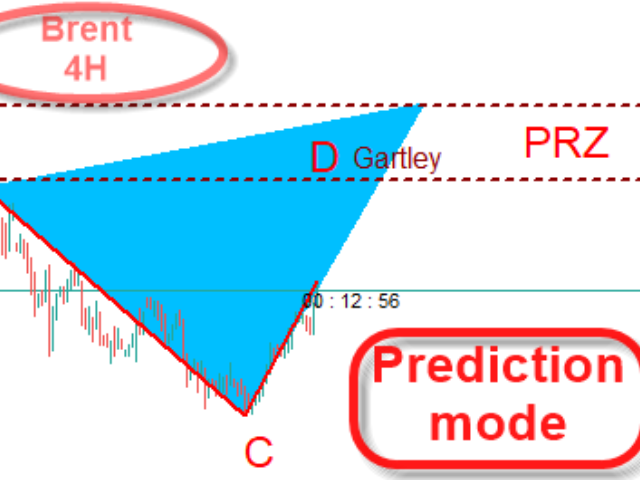
- GARTLEY
- CRAB
- DEEP CRAB
- CYPHER
- SHARK
- THREE DRIVE
- 5-0
Features:
- prediction
- Dynamic Zigzag
- Alarm notification
- candle time
Adjustable parameters:
- Period : Determining the zigzag pattern's compactness.
- Error rate : Maximum permitted pattern recognition error rate.
- prediction mode : Predict harmonic patterns in advance.
- show pattern on chart : Real-time visualization of predicted patterns on chart.
- Alarm :Get notify as a pattern fully constructed
- candle bars : Determining the desired number of candles participating in the prediction and historical pattern recognition process.
If you are pleased with your purchase, I would highly appreciate a favorable review. If you are not, please contact me so that we can work out a solution.


사용자가 평가에 대한 코멘트를 남기지 않았습니다