Most time the market is in a small oscillation amplitude. The Trade Area indicator helps users to recognize that time. There are 5 lines in this indicator: Area_high, Area_middle, Area_Low, SL_high and SL_low. Recommendations: When price is between Area_high and Area_Low, it's time to trade. Buy at Area_Low level and sell at Area_high level. The SL_high and SL_low lines are the levels for Stop Loss. Change the Deviations parameter to adjust SL_high and SL_low.
This is the ADX Dashboard MT5. This dashboard will scan multiple timeframes in MT5 platform, from M1 chart to D1 chart. It will send the buy/sell signals by alert on the platform or sending notification to your phone or message you via a email.
The buy signal is the cross over of DI+ and DI- The sell signal is the cross under of DI+ and DI-.
The up trend color will be displayed when DI+ is greater than DI- The down trend color will be displayed when DI+ is less than DI- The value of ADX value wi
Breakeven Line v2 Indicator is a MetaTrader indicator that calculates breakeven level based on all open positions and displays it on your chart as a horizontal line. Additionally, it will calculate the total number trades, the total number of lots, and the distance to the breakeven line in points and profit/loss. The indicator is available for MetaTrader 5 . Why use Breakeven Line Indicator? When you have multiple trades opened on a single symbol, it can be difficult to tell where your averag
G-FiboTrend — Indicator Description G-FiboTrend is a trend-channel indicator for MetaTrader 5 that plots dynamic Fibonacci-based price zones over a rolling lookback period. How It Works The indicator scans a user-defined number of bars ( FiboPeriod ) to identify the highest high (HH) and lowest low (LL) within that window. From this range, it derives three key levels: Upper Band — Fibonacci level (default 61.8%) Mid Band — 50.0% midpoint Lower Band — Fibonacci level (default 38.2%) These levels
Buy Sell Strength Realtime displays buying and selling pressure directly on each candle of the main chart, with no separate window needed. For each bar, the indicator calculates the proportion of buyers and sellers based on the close position within the bar range (high and low), multiplied by tick volume. Results appear as: Green number below the low — buying strength Red number above the high — selling strength Instantly identify which side is dominating bar by bar, without switching wind
- This is an indicator of directional movement that allows you to determine the trend at the time of its inception and set the levels of a protective stop.
Trailing can be carried out both from below, when the stop level is below the current price and is pulled up behind the price if it increases, and above, when stop levels are above the current price.
Unlike trailing with a constant distance, the stop level is set at the lower boundary of the quadratic regression channel (in the case of tra
THE NUMBER CHANGES.
THE MEANING DOESN’T. Change timeframes. Keep your reference. SAME PERIOD. DIFFERENT MEANING. Change the timeframe, and the MA you trusted is no longer measuring the same market horizon. The problem The same MA period measures a different amount of market time when the chart timeframe changes. The solution Equivalent MA changes the number — so your reference keeps the same meaning. H4 EMA 50
=
H1 EMA 200
=
M15 EMA 800
USER MANUAL Complete setup instructions, feature details,
No EA, no complex configuration – just run this script and see your professional trade setup instantly on the chart. The MTT Breakout Trade Setup Pro script is built for manual breakout traders who want institutional‑grade risk management without the overhead of an Expert Advisor. It uses a proprietary higher‑timeframe detection algorithm (calibrated for the 9:00 GMT+3 session) to identify the optimal breakout reference levels. Your Stop Loss distance is derived automatically from market
//////////////////////////////////////////////// //////////////////////////////////////////////// /////////////////////////////////////
Go My Way is an ultra-accurate indicator of trend direction or price movement.
This indicator is calculated on the basis of a dozen other indicators and has a very complex mechanism.
//////////////////////////////////////////////// //////////////////////////////////////////////// /////////////////////////////////////
The settings are very simple, but it is
300 downloads without review ? !!!!
If continued. I will not share any product for free. :( Small and very simple timer next to the current price to show the end time of the current candle
Very useful and important for scalpers and those who work on price action.
We assure you that we welcome any suggestions to improve this indicator and make the necessary changes to improve this indicator.
You can contact us via Instagram, Telegram, WhatsApp, email or here. We are ready to answer you.
TrendScan: Multi-Asset Trend Radar
It is a high-speed scanner that monitors 23 symbols and 7 timeframes on a single screen. It identifies real trends and filters sideways markets using a triple EMA and ATR volatility algorithm.
Instant Detection: Bullish, bearish, or neutral trend signals. Noise Filter: It only shows strongly confirmed trends (Slope filter). Quick Access: Click on any signal to open the chart with your template. Clean Interface: Massive analysis without cluttering your workspac
ElohimTrade Ultimate Confluence Pro – 세계에서 가장 강력한 멀티 타임프레임 컨플루언스 인디케이터 ElohimTrade Ultimate Confluence Pro 와 함께 당신의 트레이딩 잠재력을 최대한 발휘하세요. 정확성, 신뢰성, 깊이 있는 시장 통찰을 추구하는 트레이더를 위해 설계된 최고의 기술 분석 도구입니다. 이 고급 인디케이터는 EMA, RSI, MACD, 볼린저 밴드, 스토캐스틱, ADX 등 주요 지표를 결합하여, M15, H1, H4 같은 세 가지 주요 타임프레임을 동시에 분석합니다. 결과는? 시장의 잡음을 걸러내고 가장 수익성 높은 기회를 알려주는 명확한 컨플루언스 점수입니다. 추측에 의존하지 말고: 멀티 타임프레임 시너지 활용: 여러 시간대를 동시에 분석하여 트렌드와 반전을 높은 정확도로 포착. 시그널 품질 극대화: 여러 지표와 시간대의 확인을 반영한 고급 점수 시스템으로 잘못된 시그널을 크게 줄임. 실시간 알림으로 항상 한발 앞서기:
Pattern Finder 2 is a MULTICURRENCY indicator that scans the entire market seeking for up to 62 candlestick patterns in 15 different pairs/currencies all in one chart. It will help you to make the right decision in the right moment. You can filter the scanning following the trend by a function based on exponential moving average. You can setup parameters by an interface that appears by clicking the arrow that appear on the upperleft part of the window after you place the indicator. Parameters ar
Adjustable Consecutive Fractals looks for 2 or more fractals in one direction and sends out a on screen alert, sound alert and push notification, for strong reversal points .
Adjustable Consecutive Fractals, shows the fractals on chart along with a color changing text for buy and sell signals when one or more fractals appear on one side of price.
Adjustable Consecutive Fractals is based Bill Williams Fractals . The standard Bill Williams fractals are set at a non adjustable 5 bars, BUT withe th
The professional browser of News and Trading Sessions is now available in MetaTrader 5.
Now all the most important market information is collected on one dial!
News located on the Time scale. Planning your working time has never been so easy and convenient ... The news scale can be switched a day, two, a week, a month forward or backward (see the details in the short video). All news updates in real time.
Thanks to the built-in filters, you can configure the display of news by importance, cou
This is the Super Trend Dashboard MT5. This dashboard will scan multiple timeframes in MT5 platform, from M1 chart to D1 chart. It will send the buy/sell signals by alert on the platform or sending notification to your phone or message you via a email.
The buy signal is generated when the super trend line flip from SELL to BUY. The sell signal is is generated when the super trend line flip from BUY to SELL.
The up trend color will be displayed depending on the current Super Trend value.
Master Edition은 거래량과 자금 흐름의 관점을 통해 시장 구조를 시각화하도록 설계된 전문가급 분석 도구입니다. 표준 거래량 지표와 달리, 이 도구는 차트에 일일 거래량 프로필을 직접 표시하여 가격 발견이 발생한 위치와 "스마트 머니"가 위치한 곳을 정확하게 볼 수 있게 합니다. 이 Master Edition은 명확성과 속도를 위해 설계되었으며, 로드 시 차트 레이아웃을 즉시 아름답게 만드는 독특한 자동 테마 동기화 시스템을 특징으로 합니다. 주요 기능: 진정한 자금 흐름 계산: 표준 틱 거래량을 넘어섭니다. "Use Money Flow"를 활성화하면 거래량이 가격에 따라 가중치가 부여되어 특정 가격 수준에서의 실제 자본 투입을 드러냅니다. 가치 영역(VA) 시각화: 가치 영역(기본값: 거래량의 70%)을 자동으로 계산합니다. VA Fill: 통제 구역을 즉시 식별하기 위해 가치 영역 배경을 음영 처리합니다. 주요 수준: 통제점(POC), 가치 영역 고점(VAH), 가치 영
The Momentum Waves Oscillator is an indicator designed for traders who want to declutter their charts. It does not generate "magic" signals; instead, it structures market data to provide an immediate, noise-free reading of momentum and volatility. This tool transforms price action into an organized visual grid, facilitating rapid and confident decision-making. Key Features: "Snap-to-Grid" Points: Prices are normalized on a scale of -100 to +100 with a step of 5. This eliminates chart "jitter" an
VWAP Pro – Institutional VWAP Indicator Professional MT5 Indicator
Trade With Institutional Precision
VWAP Pro is a professional MetaTrader 5 indicator designed to display the Volume Weighted Average Price (VWAP), one of the most widely used institutional benchmarks in financial markets.
Used by banks, hedge funds and professiona
The Antique Trend Indicator is a revolutionary trend trading and filtering solution with all the important features of a trend tool built into one tool! The Antique Trend indicator is good for any trader, suitable for any trader both for Forex and binary options. There is no need to configure anything, everything has been perfected by time and experience, it works great during flats and trends.
The Antique Trend indicator is a tool for technical analysis of financial markets, reflecting curren
This indicator will draw a label above or below each candle based on Rob Smith's The Strat as they develop over time on your chart.
As price evolves, a candle can switch between three states. When the candle first opens, if it sits completely within the previous candles high and low, then it will start as a Type 1. As time moves on, if it breaks either the high or low of the previous candle, it will be come a type 2, and should the price action be volatile and directionless, it may then
A technical Indicator Providing Price Convergence Signals along with value for experienced and professional traders. Easy to comprehend, Easy to understand.
This is a helping tool provides best signals. This indicator is designed based on the fundamentals of trade. A very good indicator you can customized its color. A best tool to find trade direction.
An adaptive indicator. It constantly adapts to the trade.
Features List 1:
FVG->iFVG Order Block High Transaction Line (Personal strategy) Premium Discount 50% and 61% Previous day high low Previous week high low Candle end countdown Feature List 2 : (Implemented based on feedback from community groups) trend identification Hide FVG, Order Block, Large Transaction line below 50% equilibrium. Hide all/Individual texts/features FUTURE Feature List (Will be implemented only if at least 5 people request for it.)
Asia, London, NY lq zones (Implemented) Def
!! FLASH SALE !! Over 80% off !! For ONE week only. Now only $47 - normally $297! >>> Ends on 30 June 2023 - Don't miss it!
Buy And Sell Signal Arrows On The Chart When The Price Is About To Reverse. Also Sends Alerts –On MT5 To Your Phone To Your Email.
Does not repaint.
Works on any pair, any timeframe. (Just ajust the settings for your pair and timeframe.)
10 Activations allowed so you are free from limitations
MT4 version here .
Spreads from 0.1pip RAW/ECN Accounts, c
Description :
VWAP (Volume-Weighted Average Price) is the ratio of the value traded to total volume traded over a particular time horizon. It is a measure of the average price at which pair is traded over the trading horizon. Read More.
All Symbols and All Timeframes are supported.
Indicator Inputs :
VWAP Mode : Mode of VWAP Calculation. Options can be selected : Single,Session,Daily,Weekly,Monthly
Volumes : Real Volumes,Tick Volumes
Price Type : Used price for calculating. O
알파 원 MT5 - 고급 추세 탐지 시스템
알파 원은 전문적인 추세 추종 지표로, 차트에 직접 표시되는 자동 진입, 손절매, 세 가지 이익 실현 수준과 함께 명확한 매수 및 매도 신호를 제공합니다.
이 지표는 실시간 추세 강도와 방향을 반영하기 위해 녹색과 빨간색 사이를 전환하는 15개의 동적 라인으로 구성된 독특한 에너지 필드 시각화 기능을 갖추고 있습니다. 녹색 에너지는 강세 우세를, 빨간색 에너지는 약세 압력을 나타내어 시장 모멘텀을 즉시 시각적으로 파악할 수 있게 합니다.
신호 시스템 신호는 여러 독립적인 분석 차원에서의 모멘텀 변화를 분석하는 다중 확인 과정을 통해 생성됩니다. 각 신호는 차트에 표시되기 전에 여러 구성 요소의 일치된 판단이 필요합니다.
리페인트 없음 보장 모든 신호는 확정된 마감 바에서만 계산됩니다. 신호가 표시되면 절대 이동, 변경 또는 사라지지 않습니다. 과거 데이터에서 보는 것은 실시간에 나타난 것과 정확히 동일합니다. 백테스트 결과는 실제 성
Klinger Volume Oscillator Short Description A volume-based flow analysis tool designed to visualize buying and selling pressure through a dual-colored histogram. Detailed Description The Klinger Volume Oscillator Histo is a technical analysis indicator that explores the relationship between price movement and transactional volume. By converting the traditional Klinger Oscillator into a dynamic histogram, this tool allows traders to observe the internal strength of market movements. The indicat
"2nd To NoneFX Scalper" is one powerful indicator which you can use on any timeframe. The accuracy is in between 90% - 95% can be more. The indicator is 100% non repaint so it doesn't repaint at all. When the arrow comes out wait for the candlestick to close the arrow won't repaint/recalculate or move. The indicator works with all volatility indices,step index, Boom & Crash(500 & 1000) and all currency pairs. You can change settings of the indicator. For great results find the trend of the pair,
Price Magnet — Price Density and Attraction Levels Indicator Price Magnet is a professional analytical tool designed to identify key support and resistance levels based on statistical Price Density. The indicator analyzes a specified historical period and detects price levels where the market spent the most time. These zones act as “magnets,” attracting price action or forming a structural base for potential reversals. Unlike traditional Volume Profile tools, Price Magnet focuses on price-time d
Was: $249 Now: $99 Market Profile defines a number of day types that can help the trader to determine market behaviour. A key feature is the Value Area, representing the range of price action where 70% of trading took place. Understanding the Value Area can give traders valuable insight into market direction and establish the higher odds trade. It is an excellent addition to any system you may be using. Inspired by Jim Dalton’s book “Mind Over Markets”, this indicator is designed to suit the
이 제품은 2026년 시장에 맞게 업데이트되었으며 최신 MT5 빌드에 최적화되었습니다. 가격 업데이트 안내:
Smart Trend Trading System은 현재 $99 에 제공됩니다.
다음 30회 구매 후 가격은 $199 로 인상됩니다. 특별 혜택: Smart Trend Trading System 구매 후 저에게 개인 메시지를 보내시면 Smart Universal EA를 무료 로 받을 수 있으며, Smart Trend 신호를 자동 거래로 전환할 수 있습니다. Smart Trend Trading System은 리페인트 없음, 재그리기 없음, 지연 없음의 완전한 트레이딩 시스템으로, 더 깨끗한 신호, 더 나은 추세 방향, 그리고 더 체계적인 시장 거래 방식을 원하는 트레이더를 위해 제작되었습니다. Online course , manual and [download presets] . 이 시스템은 추세 감지, 반전 구간, Smart Cloud, 트레일링 스톱 로직, 지지와 저항, 캔들
Trend Sniper X 는 MetaTrader 5용 멀티 타임프레임 추세 추종 지표로, 트레이더가 추세 방향과 잠재적 반전 지점을 명확하고 정확하게 식별하도록 돕습니다. 가격 정보: 현재 가격은 프로모션 가격이며, 향후 업데이트 및 새로운 기능 출시 시 변경될 수 있습니다. Code2Profit 채널 멀티 타임프레임 분석으로 시장을 마스터하세요! 기술 사양 플랫폼 MetaTrader 5 지표 유형 멀티 타임프레임 추세 지표 운용 타임프레임 모든 차트 타임프레임 지원, 독립적으로 선택 가능한 상위 타임프레임(M1–MN1) 주요 상품 외환, 금(XAUUSD) 및 기타 CFD 권장 계좌 모든 계좌 유형 시각화 색상별 추세 캔들(매수/매도/약세/변경) + 매수/매도 화살표 추가 모듈 세션 시장 박스(시드니, 도쿄, 런던, 뉴욕) 주요 기능 멀티 타임프레임 추세 분석: 상위 타임프레임의 추세 방향을 현재 차트에 직접 투영하여 명확한 매크로 관점을 제공합니다. 약세/불확실한 바 감지: 추세
Welcome to ENTRY IN THE ZONE AND SMC MULTI TIMEFRAME Entry In The Zone and SMC Multi Timeframe is a professional trading indicator built on Smart Money Concepts (SMC) , combining market structure analysis with a No Repaint BUY / SELL signal system in a single indicator. It helps traders understand market structure more clearly, identify key price zones, and focus on higher-quality trading opportunities. By combining Multi-Timeframe Analysis , Points of Interest (POIs) , and real-time signals, th
먼저 솔직하게 말하겠습니다.
어떤 인디케이터도 단독으로 당신을 수익성 있게 만들어주지 않습니다. 누군가 그렇게 말한다면, 그는 당신에게 꿈을 파는 것입니다. 완벽한 매수/매도 화살표를 보여주는 모든 인디케이터는 완벽하게 보이도록 만들 수 있습니다 — 단지 올바른 과거 구간을 확대하고 승리한 거래만 캡처하면 됩니다. 우리는 그렇게 하지 않습니다. SMC Intraday Formula는 도구입니다. 시장 구조를 읽고, 가장 높은 확률의 가격 구간을 표시하며, 현재 스마트 머니의 흐름이 어떻게 보이는지 아주 단순한 언어로 보여줍니다. 최종 결정은 여전히 당신이 합니다. 실행도 당신이 합니다. 하지만 이제는 희망이 아니라 정확성으로 거래하게 됩니다. 우리는 이 인디케이터를 지난 약 3년 동안 골드(XAUUSD) 및 주요 외환 통화쌍의 데이 트레이딩 스캘핑에 사용해 왔습니다. M1, M5, M15, M30에서 우리의 핵심 도구입니다. 이 도구는 미래를 예측하려 하지 않습니다 — 지금 형성
SuperScalp Pro – 전문 멀티 레이어 컨플루언스 스캘핑 시스템 SuperScalp Pro 는 다중 컨플루언스를 기반으로 한 전문 스캘핑 시스템으로, 트레이더가 더 높은 확률의 매매 기회를 식별할 수 있도록 설계되었습니다. 명확한 진입 신호 확인, ATR 기반 손절(Stop Loss) 및 목표가(Take Profit), 그리고 XAUUSD, BTCUSD 및 주요 외환 통화쌍에 대한 유연한 신호 필터링 기능을 제공합니다.
전체 문서는 제품 블로그에서 확인할 수 있습니다: [User Guide]
SuperScalp Pro Auto Trader EA를 통해 자동 매매를 지원합니다: [Auto Trader]
SuperScalp Pro 의 거래 로직을 기반으로 개발된 골드 자동 스캘핑 EA: [SuperScalp Gold]
SuperScalp Pro 는 Supertrend, VWAP, EMA, RSI, ADX, 거래량 분석, 볼린저 밴드 및 MACD 다이버전스를 결합하여
전설이 돌아왔습니다: Entry Points Pro 10. MQL5 마켓 Top-3 자리를 3년간 지켜온 전설적인 지표의 재출시입니다. 수백 개의 호평 리뷰(두 버전 합산 589개), 매일 이 지표로 거래하는 수천 명의 트레이더, 31,000회 이상의 데모 다운로드 MT4+MT5 . 지난 5년간 여러분이 남긴 리뷰를 하나도 빠짐없이 읽었고, 약속 대신 그 답을 버전 10에 담았습니다. 1999년부터 시장에서 활동하며 정직함과 자신의 평판, 그리고 고객을 소중히 여기는 개발자가 만들었습니다. Entry Points Pro의 진입 시그널은 절대 리페인팅되지 않습니다. 그리고 이번에는 개발자의 말뿐이 아니라 검증 가능한 사실입니다: 확정 시그널은 캔들 종가에서만 표시되며, 자동화 테스트에서 리페인팅 0건 이 확인되었습니다(EURUSD, XAUUSD, BTCUSD에서 2,486,568회의 불변조건 검사 — 위반 0건). 검증 방법은 공개되어 있으니 전략 테스터에서 직접 재현해 보실 수
M1 Quantum을 이용한 실시간 트레이딩 신호 : 신호 ( Quantum Trade Assistant 에 의해 거래가 자동으로 실행되며, 이 제품에 무료 로 포함되어 있습니다.) 가격 계획: 현재 가격: $169 (얼리 어답터 혜택) 다음 예정 가격: $189 예정 소매 가격: $299 개발자 안내: 구매 후 저에게 연락하시면 최신 권장 설정 파일(Set File) , 사용 팁, 그리고 다른 M1 Quantum 사용자들과 소통할 수 있는 VIP 지원 그룹 초대장을 받으실 수 있습니다. 자주 묻는 질문 - 설정 파일 - 설치 가이드
M1 Quantum 은 M1 전용 전문 트레이딩 시스템으로, 손절(Stop Loss), 익절(Take Profit), 그리고 스마트 자금 관리 기능이 내장된 빠르고 정확한 거래 신호를 제공합니다. M1 Quantum 은 연속 수익 거래 에 집중하여 계좌를 빠르게 성장시키도록 설계된 전문 자금 관리 시스템을 포함하고 있습니다. M1 Quantum
가끔은 제가 직접 이 시스템을 이용해 거래를 하곤 합니다. 실계좌에서 제가 직접 수행하는 BOMBER 트레이딩을 확인해 보세요 - LIVE SIGNAL 이 지표를 구매하신 분께는 다음과 같은 혜택이 무료로 제공됩니다:
각 거래를 자동으로 관리하고, 손절/익절 수준을 설정하며, 전략 규칙에 따라 거래를 종료하는 전용 도우미 툴 "Bomber Utility" 다양한 자산에 맞게 지표를 설정할 수 있는 셋업 파일(Set Files) "최소 위험", "균형 잡힌 위험", "관망 전략" 모드로 설정 가능한 Bomber Utility의 셋업 파일 이 전략을 빠르게 설치, 설정, 시작할 수 있도록 돕는 단계별 영상 매뉴얼 주의: 위의 모든 보너스를 받기 위해서는 MQL5 개인 메시지 시스템을 통해 판매자에게 연락해 주세요. 독창적인 커스텀 지표인 “Divergence Bomber(다이버전스 봄버)”를 소개합니다. 이 지표는 MACD 다이버전스(괴리) 전략을 기반으로 한 올인원(All-in-On
Neuro Poseidon is a new indicator by Daria Rezueva. It combines precise trading signals with adaptive TP/SL levels - creating best possible trades as a result!
Message me and get Neuro Poseidon Assistant as a gift to automize your trading process!
What makes it stand out?
1. Proven profitability on all assets and timeframes
2. Only confirmed BUY and SELL signals present on the chart
3. Adaptive TP & SL levels generated by the software for each trade
4. Easy to understand - suitable for al
Gann Made Easy 는 mr.의 이론을 사용하여 최고의 거래 원칙을 기반으로 하는 전문적이고 사용하기 쉬운 Forex 거래 시스템입니다. W.D. 간. 이 표시기는 Stop Loss 및 Take Profit Levels를 포함하여 정확한 BUY 및 SELL 신호를 제공합니다. PUSH 알림을 사용하여 이동 중에도 거래할 수 있습니다. 구매 후 거래 방법 안내 및 유용한 추가 지표를 무료로 받으시려면 저에게 연락주세요! 아마도 Gann 거래 방법에 대해 이미 여러 번 들었을 것입니다. 일반적으로 Gann의 이론은 초보자 거래자뿐만 아니라 이미 거래 경험이 있는 사람들에게도 매우 복잡한 것입니다. Gann의 거래 방식은 이론적으로 적용하기 쉽지 않기 때문입니다. 나는 그 지식을 연마하고 Forex 지표에 최고의 원칙을 적용하기 위해 몇 년을 보냈습니다. 표시기는 적용하기가 매우 쉽습니다. 차트에 첨부하고 간단한 거래 권장 사항을 따르기만 하면 됩니다. 지표는 지속적으로 시장 분석
이 제품은 2026년 시장에 맞게 업데이트되었으며 최신 MT5 빌드에 최적화되었습니다. 가격 업데이트 안내:
Atomic Analyst는 현재 $99 에 제공됩니다.
다음 30회 구매 후 가격은 $199 로 인상됩니다. 특별 혜택: Atomic Analyst 구매 후 저에게 개인 메시지를 보내시면 Smart Universal EA를 무료 로 받을 수 있으며, Atomic Analyst 신호를 자동 거래로 전환할 수 있습니다. Atomic Analyst는 리페인트 없음, 재그리기 없음, 지연 없음의 Price Action 거래 인디케이터로, 수동 거래, 신호 명확성, EA 자동화를 위해 설계되었습니다. User manual: settings, inputs and strategy. & User Manual PDF . 가격 움직임, 강도, 모멘텀, 다중 시간대 방향 및 고급 필터를 분석하여 트레이더가 노이즈를 줄이고 약한 세팅을 피하며 더 체계적인 거래 결정을 내릴 수 있도록
ARICoin is a powerful trading companion designed to generate high-probability entry signals with dynamic TP/SL/DP levels based on volatility. Built-in performance tracking shows win/loss stats, PP1/PP2 hits, and success rates all updated live. Key Features: Buy/Sell signals with adaptive volatility bands Real-time TP/SL/DP levels based on ATR Built-in MA Filter with optional ATR/StdDev volatility Performance stats panel (Success, Profit/Loss, PP1/PP2) Alerts via popup, sound, push, or email Cust
Crystal Heikin Ashi Signals - Professional Trend & Signal Detection Indicator Advanced Heikin Ashi Visualization with Intelligent Signal System for Manual & Automated Trading
Final Price: $149 ---------> Price goes up $10 after every 10 sales .
Limited slots available — act fast .
Overview Crystal Heikin Ashi Signals is a professional-grade MetaTrader 5 indicator that combines pure Heikin Ashi candle visualization with an advanced momentum-shift detection system. Designed for both manual traders
ARIPoint is a powerful trading companion designed to generate high-probability entry signals with dynamic TP/SL/DP levels based on volatility. Built-in performance tracking shows win/loss stats, PP1/PP2 hits, and success rates all updated live. Key Features: Buy/Sell signals with adaptive volatility bands Real-time TP/SL/DP levels based on ATR Built-in MA Filter with optional ATR/StdDev volatility Performance stats panel (Success, Profit/Loss, PP1/PP2) Alerts via popup, sound, push, or email Cu
Power Candles V3 - 자체 최적화 강도 지표 파워 캔들 V3는 적용된 모든 차트에서 통화 및 상품의 강세를 실행 가능한 거래 계획으로 전환합니다. 단순히 캔들에 색상을 입히는 대신, 백그라운드에서 실시간 자동 최적화를 수행하여 현재 보고 있는 종목에 대한 최적의 손절매, 익절 및 신호 임계값을 제공합니다. 한 번의 클릭으로 실시간 거래에 적용할 수 있으며, 진입점, 손절매 및 익절 선이 정확한 가격에 맞춰 차트에 표시되고, 방향과 함께 알림이 발령됩니다. 이 도구는 Stein Investments 에코시스템의 일부입니다. 18개 이상의 도구와 함께 당신의 1대1 AI 트레이딩 멘토 Max.
항상 대기 중, 모든 인디케이터를 깊이 있게 이해, 무언가를 차근차근 생각해보고 싶은 순간에 도움을 줍니다. https://stein.investments 에서 만나보세요
매 종가 바마다 3,000회 이상의 트레이딩 시뮬레이션. 9가지 강도 상태. 2가지 전략을 병렬로 테스트.
GEM Signal Pro GEM Signal Pro는 MetaTrader 5용 추세추종형 지표로, 차트에서 더 명확한 신호, 더 구조적인 트레이드 설정, 그리고 더 실용적인 리스크 관리를 원하는 트레이더를 위해 설계되었습니다. 단순한 화살표만 표시하는 것이 아니라, GEM Signal Pro는 전체 트레이드 아이디어를 더 깔끔하고 읽기 쉬운 방식으로 보여줍니다. 조건이 확인되면 진입가, 손절가, 목표가를 차트에 표시하여 트레이더가 설정을 더 효율적으로 검토할 수 있도록 도와줍니다. 작동 방식 이 지표는 먼저 내부 로직에 따라 유효한 초기 신호를 식별합니다. 확인 조건이 충족되면, GEM Signal Pro는 차트에 전체 설정을 표시합니다. 이를 통해 트레이더는 거래 구조를 더 명확하게 보고, 수동 분석 작업을 줄일 수 있습니다. 차트에 표시되는 거래 레벨 확인된 신호에 대해, GEM Signal Pro는 다음을 표시할 수 있습니다. 진입가
손절가
목표가 1
목표가 2
목표가 3
손
UZFX {SSS} 스캘핑 스마트 시그널 v4.0 MT5는 급변하는 시장에서 정확한 실시간 시그널을 필요로 하는 스캘퍼, 데이 트레이더, 스윙 트레이더를 위해 설계된 리페인팅이 없는 고성능 트레이딩 지표입니다. (UZFX-LABS)에서 개발한 이 지표는 가격 움직임 분석, 추세 확인 및 스마트 필터링을 결합하여 모든 통화 쌍과 시간대에서 높은 확률의 매수 및 매도 신호, 경고 신호, 추세 지속 기회를 생성합니다.
거래에 대한 의구심을 떨쳐버리고, 명확성, 정밀성, 그리고 규율 있는 시장 실행을 원하는 트레이더를 위해 설계된 체계적인 신호 시스템을 따르기 시작하세요. 제 추천* 최적의 시간대: 15분 이상. {H1}이 제가 가장 선호하는 시간대입니다. 그리고 그 결과는 정말 놀라울 정도입니다...!!
주요 기능 업데이트
• 자동 매수 및 매도 신호 감지 • 고급 반전 인식 로직 • 잠재적인 시장 반전 전 조기 경고 신호 • 추세 지속 확인 신호 • 진입, 손절, TP1, TP2,
M1 SNIPER 는 사용하기 쉬운 거래 지표 시스템입니다. M1 시간대에 맞춰 설계된 화살표 지표입니다. 이 지표는 M1 시간대 스캘핑을 위한 단독 시스템으로 사용할 수 있으며, 기존 거래 시스템의 일부로도 사용할 수 있습니다. 이 거래 시스템은 M1 시간대 거래용으로 특별히 설계되었지만, 다른 시간대에도 사용할 수 있습니다. 원래는 XAUUSD와 BTCUSD 거래를 위해 이 방법을 설계했지만, 다른 시장 거래에도 유용하다는 것을 알게 되었습니다. 이 지표의 신호는 추세 방향과 반대로 거래될 수 있습니다. 저는 지표의 신호를 활용하여 양방향으로 거래할 수 있도록 돕는 특별한 거래 기법을 알려드립니다. 이 방법은 특별한 동적 지지선과 저항선 가격 영역을 활용하는 것을 기반으로 합니다. 구매하시면 M1 SNIPER 화살표 지표를 바로 다운로드하실 수 있습니다. 또한, 아래 스크린샷에 표시된 Apollo Dynamic SR 지표는 M1 SNIPER 도구를 사용하는 모든 사용자에게 무료로
RelicusRoad Pro: 퀀트 시장 운영 체제 70% 할인 평생 이용권 (한정 시간) - 2,000명 이상의 트레이더와 함께하세요 왜 대부분의 트레이더는 "완벽한" 지표를 가지고도 실패할까요? 진공 상태에서 단일 개념 만으로 거래하기 때문입니다. 문맥 없는 신호는 도박입니다. 지속적인 승리를 위해서는 컨플루언스(중첩) 가 필요합니다. RelicusRoad Pro는 단순한 화살표 지표가 아닙니다. 완전한 퀀트 시장 생태계 입니다. 독점적인 변동성 모델링을 사용하여 가격이 이동하는 "공정 가치 로드"를 매핑하고, 단순 노이즈와 실제 구조적 돌파를 구분합니다. 추측은 그만두세요. 기관급 로드 로직으로 거래를 시작하세요. 핵심 엔진: "Road" 알고리즘 시스템의 중심에는 시장 상황에 실시간으로 적응하는 동적 변동성 채널인 Road Algo 가 있습니다. 세이프 라인(평형) 과 가격이 수학적으로 반전될 가능성이 높은 확장 레벨 을 투영합니다. Simple Road: 일반적인 시장을 위
SkyHammer Signal Pro Entry, SL, TP 레벨이 고정되는 전문 No-Repaint 추세 신호 인디케이터 SkyHammer Signal Pro는 명확하고 고정되며 검증 가능한 신호를 원하는 트레이더를 위해 설계된 구조적인 추세 및 모멘텀 신호 인디케이터입니다. 특히 M1 및 M5 같은 낮은 시간대에서 가장 효과적으로 작동합니다. 이 인디케이터는 시장의 고점이나 저점을 예측하려고 하지 않습니다. 대신 신호를 생성하기 전에 확인된 시장 구조, 추세 방향, 모멘텀 강도, 건강한 변동성, 그리고 목표까지의 충분한 공간을 기다립니다. 주요 기능 고정 신호 메커니즘 신호가 확인되면 화살표, Entry, Stop Loss, TP1, TP2 레벨이 차트에 영구적으로 고정됩니다. 이후 캔들 움직임 때문에 신호가 사라지거나, 이동하거나, 변경되지 않습니다. 이를 통해 트레이더는 각 신호를 명확하게 검토할 수 있으며, 실시간 시장에서 신호가 사라지는 일반적인 문제를 피할 수 있습니다
통화 강도 마법사는 성공적인 거래를 위한 올인원 솔루션을 제공하는 매우 강력한 지표입니다. 표시기는 여러 시간 프레임의 모든 통화 데이터를 사용하여 이 또는 해당 외환 쌍의 힘을 계산합니다. 이 데이터는 특정 통화의 힘을 확인하는 데 사용할 수 있는 사용하기 쉬운 통화 지수 및 통화 전력선의 형태로 표시됩니다. 필요한 것은 거래하려는 차트에 표시기를 부착하는 것뿐입니다. 표시기는 거래하는 통화의 실제 강세를 보여줍니다. 지표는 또한 추세와 거래할 때 유리하게 사용할 수 있는 구매 및 판매 거래량 압력의 극한값을 보여줍니다. 지표는 또한 피보나치에 기반한 가능한 대상을 보여줍니다. 표시기는 PUSH 알림을 포함한 모든 유형의 알림을 제공합니다. 구매 후 연락주세요. 나는 당신과 거래 팁을 공유하고 당신에게 무료로 훌륭한 보너스 지표를 줄 것입니다! 나는 당신에게 행복하고 유익한 거래를 기원합니다!
이 제품은 2026년 시장에 맞게 업데이트되었으며 최신 MT5 빌드에 최적화되었습니다. 가격 업데이트 안내:
Smart Price Action Concepts는 현재 $200 에 제공됩니다.
다음 30회 구매 후 가격은 $299 로 인상됩니다. 특별 혜택: 구매 후 저에게 개인 메시지를 보내시면 무료 보너스 + 선물 을 받을 수 있습니다. 먼저, 이 트레이딩 도구는 리페인트 없음, 재그리기 없음, 지연 없음의 인디케이터이므로 전문적인 트레이딩에 적합하다는 점을 강조하고 싶습니다. Online course , and manual Smart Price Action Concepts Indicator는 초보자와 경험 많은 트레이더 모두에게 매우 강력한 도구입니다. 20개 이상의 유용한 인디케이터를 하나로 결합하고, Inner Circle Trader Analysis와 Smart Money Concepts Trading Strategies 같은 고급 트레이딩 아이디어를 통합합니다. 이 인디
AtBot: 작동 방식 및 사용 방법 ### 작동 방식 MT5 플랫폼용 "AtBot" 지표는 기술 분석 도구의 조합을 사용하여 매수 및 매도 신호를 생성합니다. 01:37 단순 이동 평균(SMA), 지수 이동 평균(EMA), 평균 진폭 범위(ATR) 지수를 통합하여 거래 기회를 식별합니다. 또한 Heikin Ashi 캔들을 사용하여 신호의 정확성을 향상시킬 수 있습니다. 구매 후 리뷰를 남기면 특별 보너스 선물을 받게 됩니다. ### 주요 기능: - 비재표시: 신호는 플로팅 후 변경되지 않습니다. - 비재작성: 신호는 일관되며 변경되지 않습니다. - 지연 없음: 지연 없이 시기적절한 신호를 제공합니다. - 다양한 시간대: 거래 전략에 맞게 모든 시간대에서 사용할 수 있습니다. ### 운영 단계: #### 입력 및 설정: - firstkey (TrendValue): 추세 감지의 민감도를 조정합니다. - Secondkey (SignalValue): 매수/매도 신호 생성의 민감도를 정의
BTMM State Engine Pro is a MetaTrader 5 indicator for traders who use the Beat The Market Maker approach: Asian session context, kill zone timing, level progression, peak formation detection, and a multi-pair scanner from a single chart. It combines cycle state logic with a built-in scanner dashboard so you do not need the same tool on many charts at once.
What it does
Draws the Asian session range; session times can follow broker server offset or be set in inputs. Tracks level progression (L
SuperTrend , RSI , Stochastic 의 힘을 하나의 포괄적인 지표로 결합하여 트레이딩 잠재력을 극대화하는 궁극의 트레이딩 도구 인 Quantum TrendPulse를 소개합니다. 정밀성과 효율성을 추구하는 트레이더를 위해 설계된 이 지표는 시장 추세, 모멘텀 변화, 최적의 진입 및 종료 지점을 자신 있게 식별하는 데 도움이 됩니다. 주요 특징: SuperTrend 통합: 주요 시장 추세를 쉽게 따라가고 수익성의 물결을 타세요. RSI 정밀도: 매수 과다 및 매도 과다 수준을 감지하여 시장 반전 시점을 파악하는 데 적합하며 SuperTrend 필터로 사용 가능 확률적 정확도: 변동성이 큰 시장에서 숨겨진 기회를 찾기 위해 확률적 진동 을 활용하고 SuperTrend의 필터로 사용 다중 시간대 분석: M5부터 H1 또는 H4까지 다양한 시간대에 걸쳐 시장을 최신 상태로 유지하세요. 맞춤형 알림: 맞춤형 거래 조건이 충족되면
DayTrader PRO DayTrader PRO는 존 에러스(John Ehlers)의 Laguerre 필터와 강력한 자동 최적화 엔진을 결합한 고급 트레이딩 지표입니다. 고정된 파라미터를 사용하는 대신, 최근 시장 상황을 바탕으로 최적의 설정을 자동으로 검색하므로 지속적인 수동 조정 없이도 변화하는 시장 변동성에 대응할 수 있습니다. 이 지표는 명확한 매수(BUY) 및 매도(SELL) 신호를 생성하며, 현재 시장 변동성을 기준으로 계산된 적응형 손절매(Stop Loss) 및 익절(Take Profit) 레벨을 제공합니다. 내장된 추세, 효율성 지수(Efficiency Ratio), 변동성 및 캔들 필터 기능은 저품질의 진입 신호를 제거하여 신호의 정확도를 높여줍니다. 실시간 성능 대시보드에서는 현재 최적화된 설정값, 수익 요인(Profit Factor), 승률(Win Rate), 최대 낙폭(Drawdown) 및 기타 트레이딩 통계를 확인할 수 있습니다. 또한 DayTrader PR
AXIOM MATRIX MT5 출시 가격: $99 Axiom Matrix는 출시 가격 $99에 제공됩니다.
첫 30회 구매 이후 가격은 $199로 인상됩니다.
구매 후, 안내 사항을 받고 독점 선물 보너스를 받기 위해 저에게 직접 DM을 보내주세요. Axiom Matrix는 MetaTrader 5용 전문 멀티 심볼, 멀티 타임프레임 시장 스캐너이자 의사결정 대시보드입니다. Axiom Matrix는 사용자의 Market Watch를 스캔하고, 여러 타임프레임을 분석하며, 여러 근거 엔진을 읽고, 가장 강한 기회를 비교하여 하나의 깔끔한 매트릭스 대시보드 안에서 최적의 BUY, SELL, WAIT 또는 차단 상태를 보여줍니다. 저는 무거운 시장 스캔 작업을 대신 처리해 줄 수 있는 하나의 도구가 필요했기 때문에 Axiom Matrix를 만들었습니다. 저는 RSI만 따로 확인하고 싶지 않았습니다.
그다음 MACD만 따로 확인하고.
그다음 이동평균.
그다음 거래량.
그다음 변동성.
그다음
Berma Bands(BBs) 지표는 시장 동향을 파악하고 이를 활용하려는 트레이더에게 귀중한 도구입니다. 가격과 BBs 간의 관계를 분석함으로써 트레이더는 시장이 추세 단계인지 범위 단계인지를 분별할 수 있습니다. 자세한 내용을 알아보려면 [ Berma Home Blog ]를 방문하세요. 버마 밴드는 세 개의 뚜렷한 선으로 구성되어 있습니다. 어퍼 버마 밴드, 미들 버마 밴드, 로어 버마 밴드입니다. 이 선들은 가격 주위에 그려져 전체 추세에 대한 가격 움직임을 시각적으로 표현합니다. 이 밴드들 사이의 거리는 변동성과 잠재적인 추세 반전에 대한 통찰력을 제공할 수 있습니다.
버마 밴드 라인이 각각에서 분리될 때, 그것은 종종 시장이 횡보 또는 범위 이동 기간에 접어들고 있음을 시사합니다. 이는 명확한 방향 편향이 없음을 나타냅니다. 트레이더는 이러한 기간 동안 추세를 파악하기 어려울 수 있으며 더 명확한 추세가 나타날 때까지 기다릴 수 있습니다.
버마 밴드 라인이 단일 라인으로
FX Power: 통화 강세 분석으로 더 스마트한 거래 결정을 개요
FX Power 는 어떤 시장 상황에서도 주요 통화와 금의 실제 강세를 이해하기 위한 필수 도구입니다. 강한 통화를 매수하고 약한 통화를 매도함으로써 FX Power 는 거래 결정을 단순화하고 높은 확률의 기회를 발견합니다. 트렌드를 따르거나 극단적인 델타 값을 사용해 반전을 예측하고자 한다면, 이 도구는 귀하의 거래 스타일에 완벽히 적응합니다. 단순히 거래하지 말고, FX Power 로 더 스마트하게 거래하세요.
1. FX Power가 거래자에게 매우 유용한 이유 통화와 금의 실시간 강세 분석
• FX Power 는 주요 통화와 금의 상대적 강세를 계산하고 표시하여 시장 역학에 대한 명확한 통찰력을 제공합니다.
• 어떤 자산이 앞서고 있고 어떤 자산이 뒤처지는지 모니터링하여 보다 현명한 거래 결정을 내릴 수 있습니다. 포괄적인 멀티 타임프레임 뷰
• 단기, 중기 및 장기 타임프레임에서 통화와 금의 강세를
제품 소식: Strategy Assistant가 새로운 버전 1.9로 업데이트되었습니다. 더 빠른 성능, 새롭게 디자인된 전문적인 인터페이스, 그리고 향상된 사용자 경험을 제공합니다. 개발자 안내: Strategy Assistant는 지속적으로 개발되고 있으며, 정기적인 업데이트와 기능 개선이 이루어지고 있습니다. 다음 업데이트: Strategy Agent(여러 거래 전략을 지능적으로 조합하는 기능)가 추가될 예정입니다. 가격 안내: 현재 가격은 첫 100명의 사용자까지 $50 로 유지됩니다 . 이후 가격은 $100 로 인상됩니다. Strategy Assistant 소개 15가지 강력한 트레이딩 전략을 하나의 스마트 인디케이터에 통합 복잡한 설정 없이 간단한 설치 하나의 차트에서 다양한 거래 전략의 도형 표시와 알림을 관리할 수 있는 빠른 계산 기능. MT4 Version : Open Strategy Assistant 는 전문 트레이더들이 사용하는 가장 인기 있고 효과적인 전략들
MACD indicators https://mql5.com This MACD indicator looks slightly different from the MACD indicator found in many other charting software. When the value of the signal line parameter is greater than the value of the MACD parameter, the indicator will give a buy prompt, and when the signal line parameter is less than the value of the MACD parameter, the indicator will give a sell prompt.
https://www.mql5.com A double moving average indicator This indicator uses the system's own two different time period of moving average indicators to reflect the movement of market prices. It is recommended that you use the default parameter Settings, which you can set according to your own experience to get the best predictive power. I hope it can provide some help for your trading.
https://www.mql4.com The price trend indicator
The price trend indicator accurately shows the changes in market prices , At the same time, this index also shows the future trend of the market price . The indicator does not redraw and does not lag. The recommended time frame is not less than H1 . When the market price is in the light green range, the market is in the rising range, and when the market price is in the light purple range, the market is in the falling range
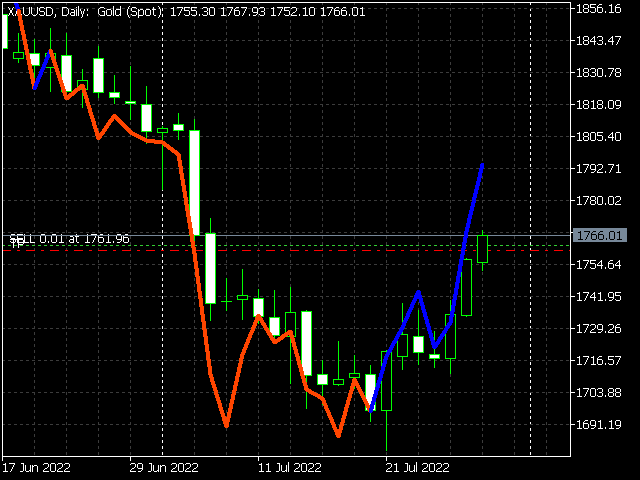
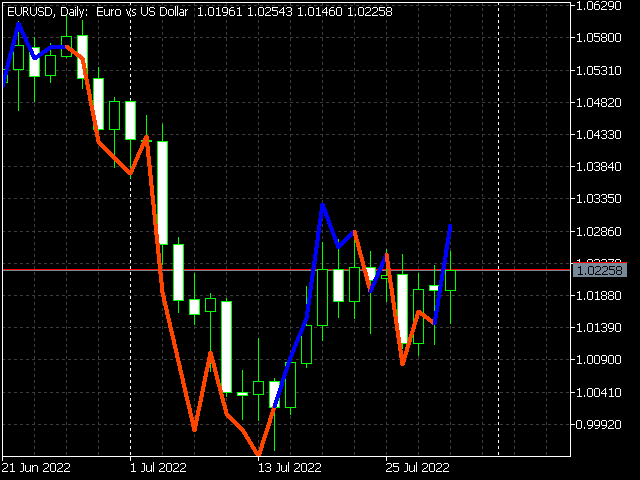
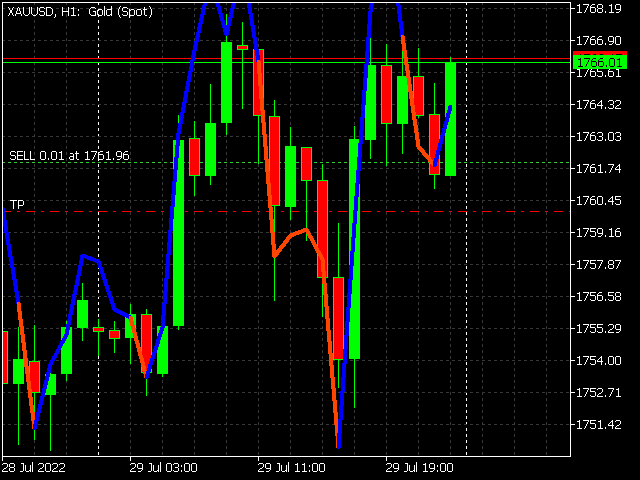
https://c.mql5.com/31/761/best-trend-indicator-logo-200x200-8493.png The indicator uses a solid line of red and green to reflect the myriad changes in market prices. The green line indicates a period of rising market prices and the red line indicates a period of falling market prices. Solid line color change indicates that the market has changed and the market is likely to reverse! It is recommended that you use this indicator on your daily K-chart. This indicator is not suitable for you to do
https://www.mql4.com The price trend indicator
The price trend indicator accurately shows the changes in market prices , At the same time, this index also shows the future trend of the market price . The indicator does not redraw and does not lag. The recommended time frame is not less than H1 . When the market price is in the light green range, the market is in the rising range, and when the market price is in the light purple range, the market is in the falling range