
Draggable Volume Profile
- 지표
- 버전: 1.31
- 업데이트됨: 13 9월 2026

Short Description
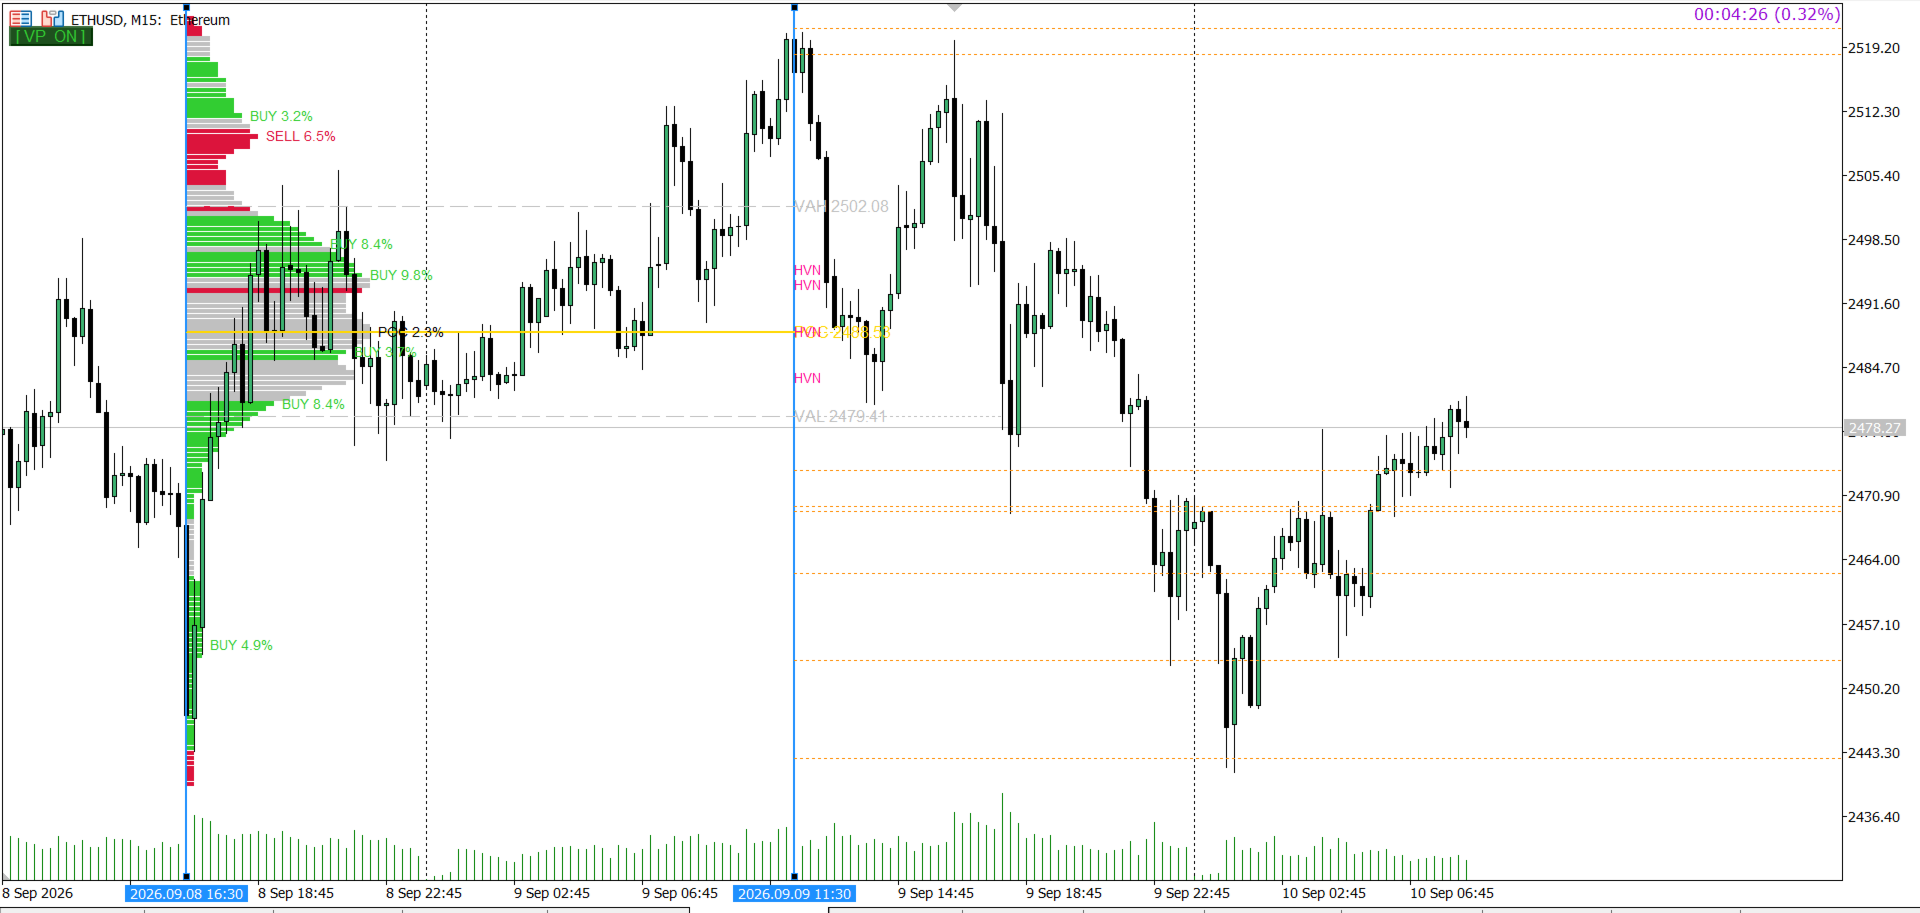
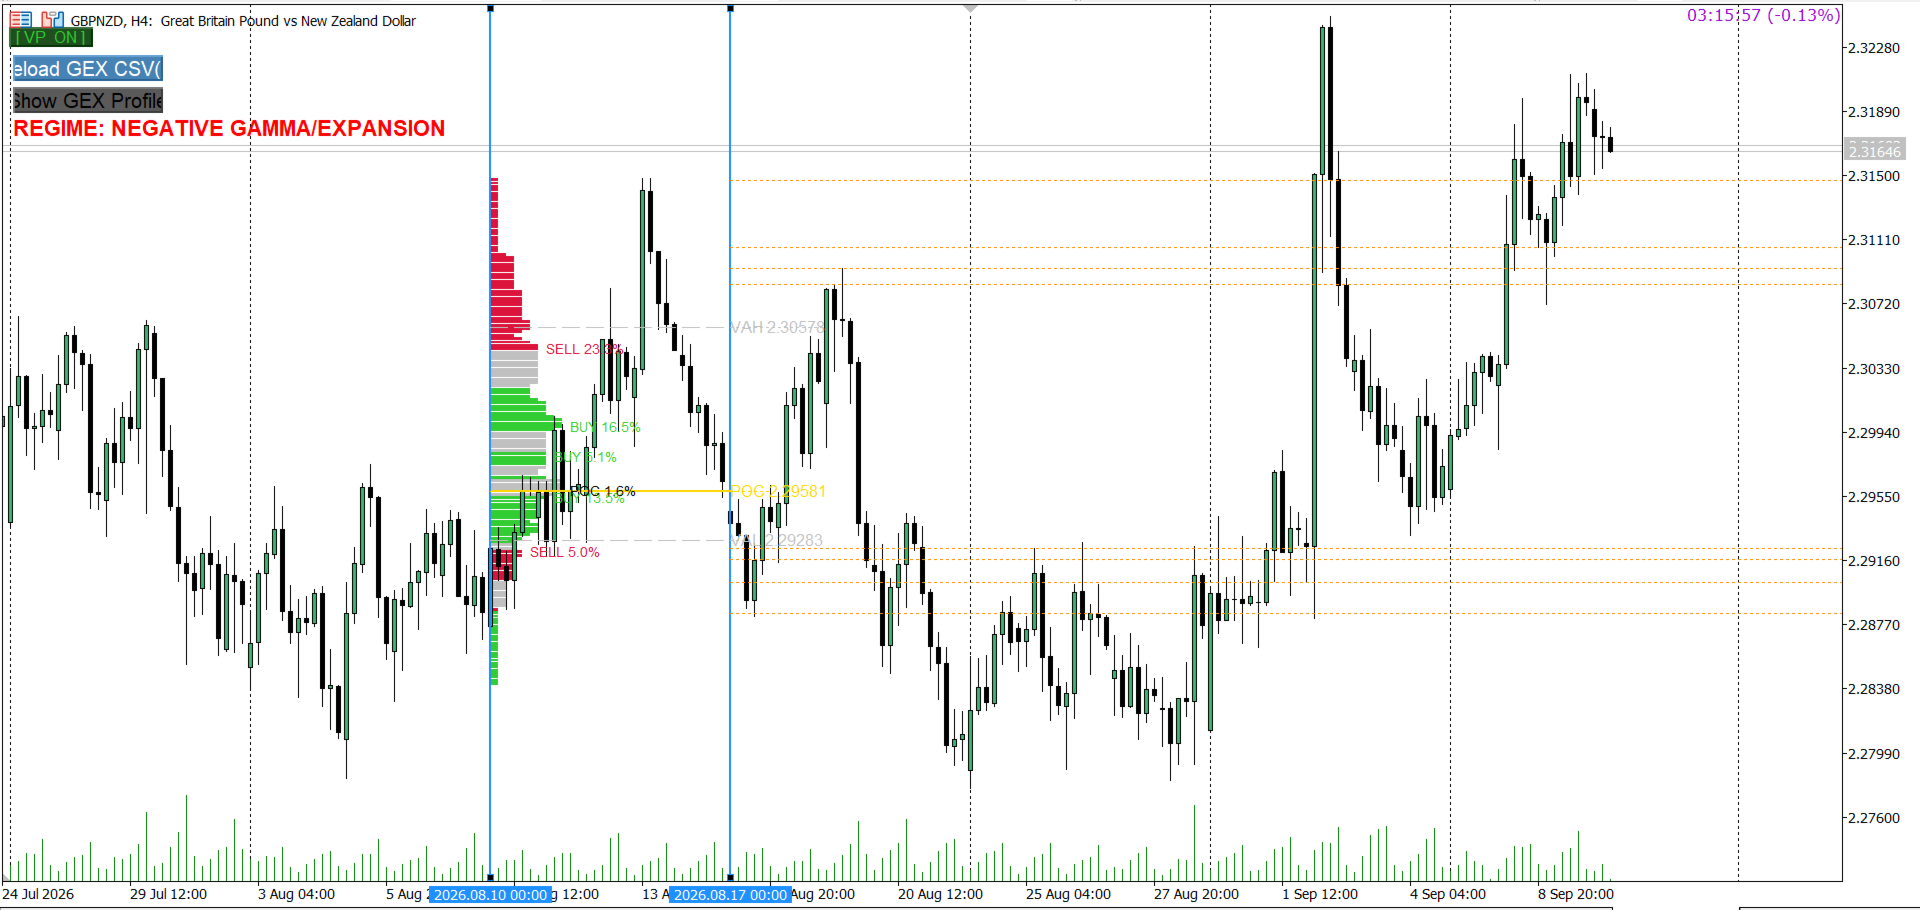
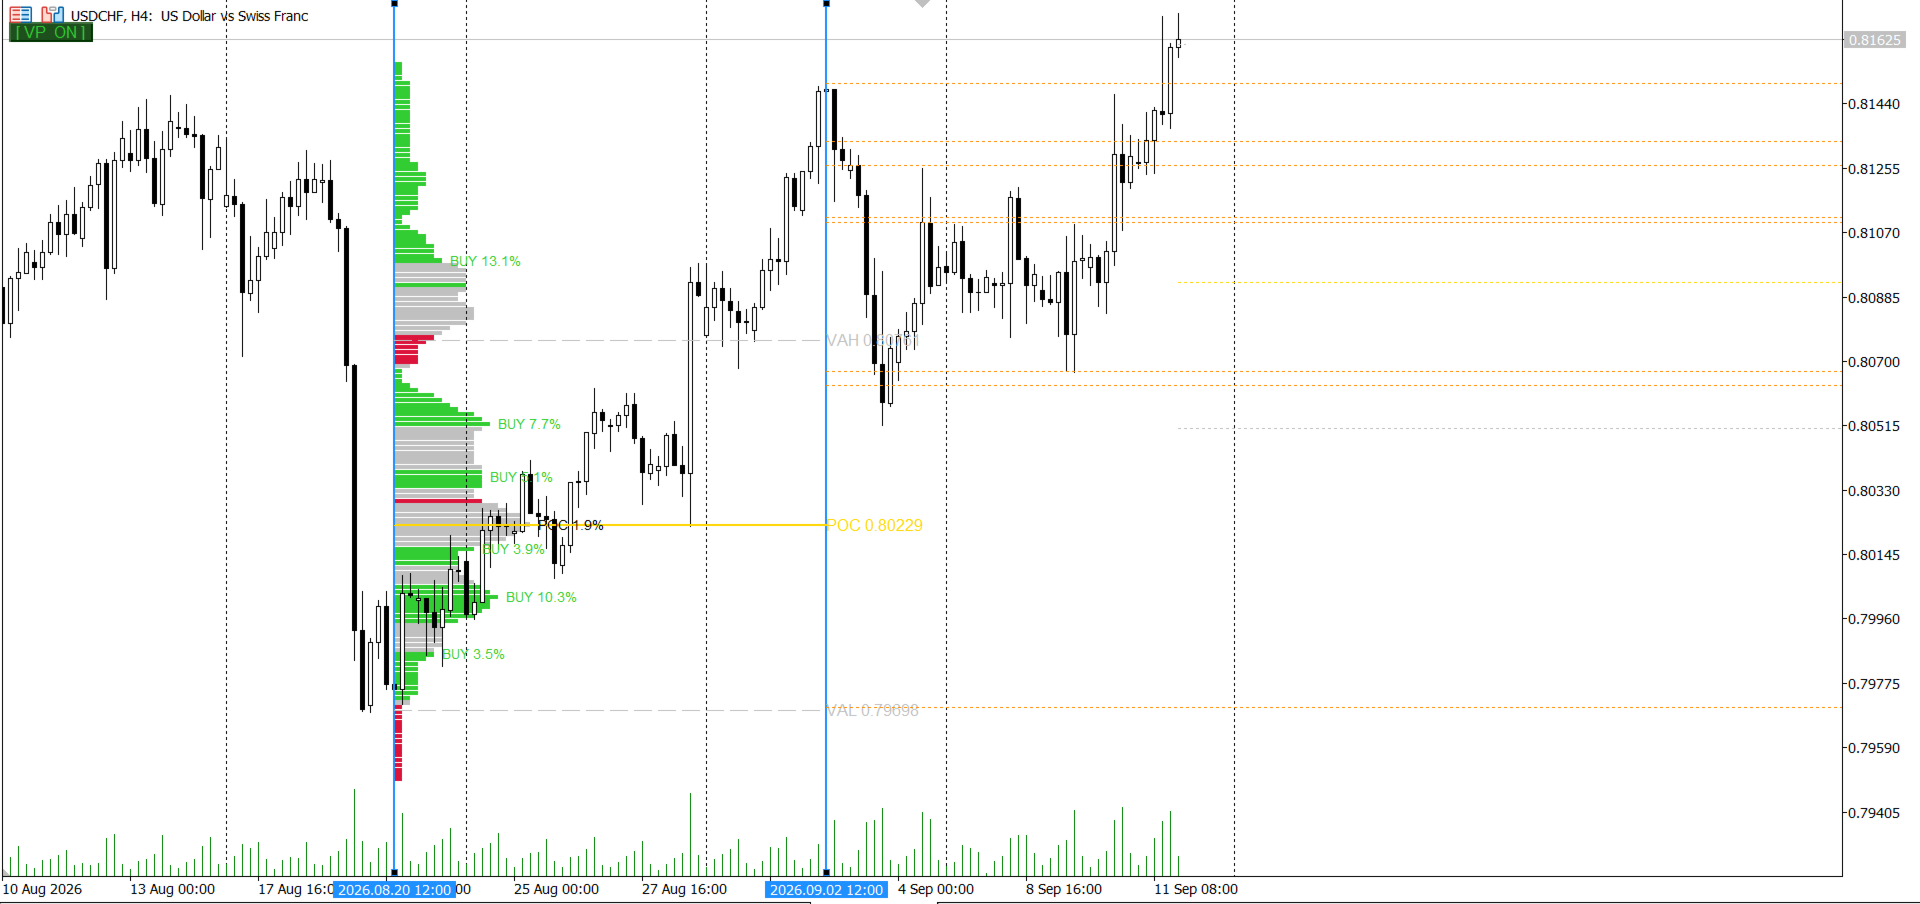
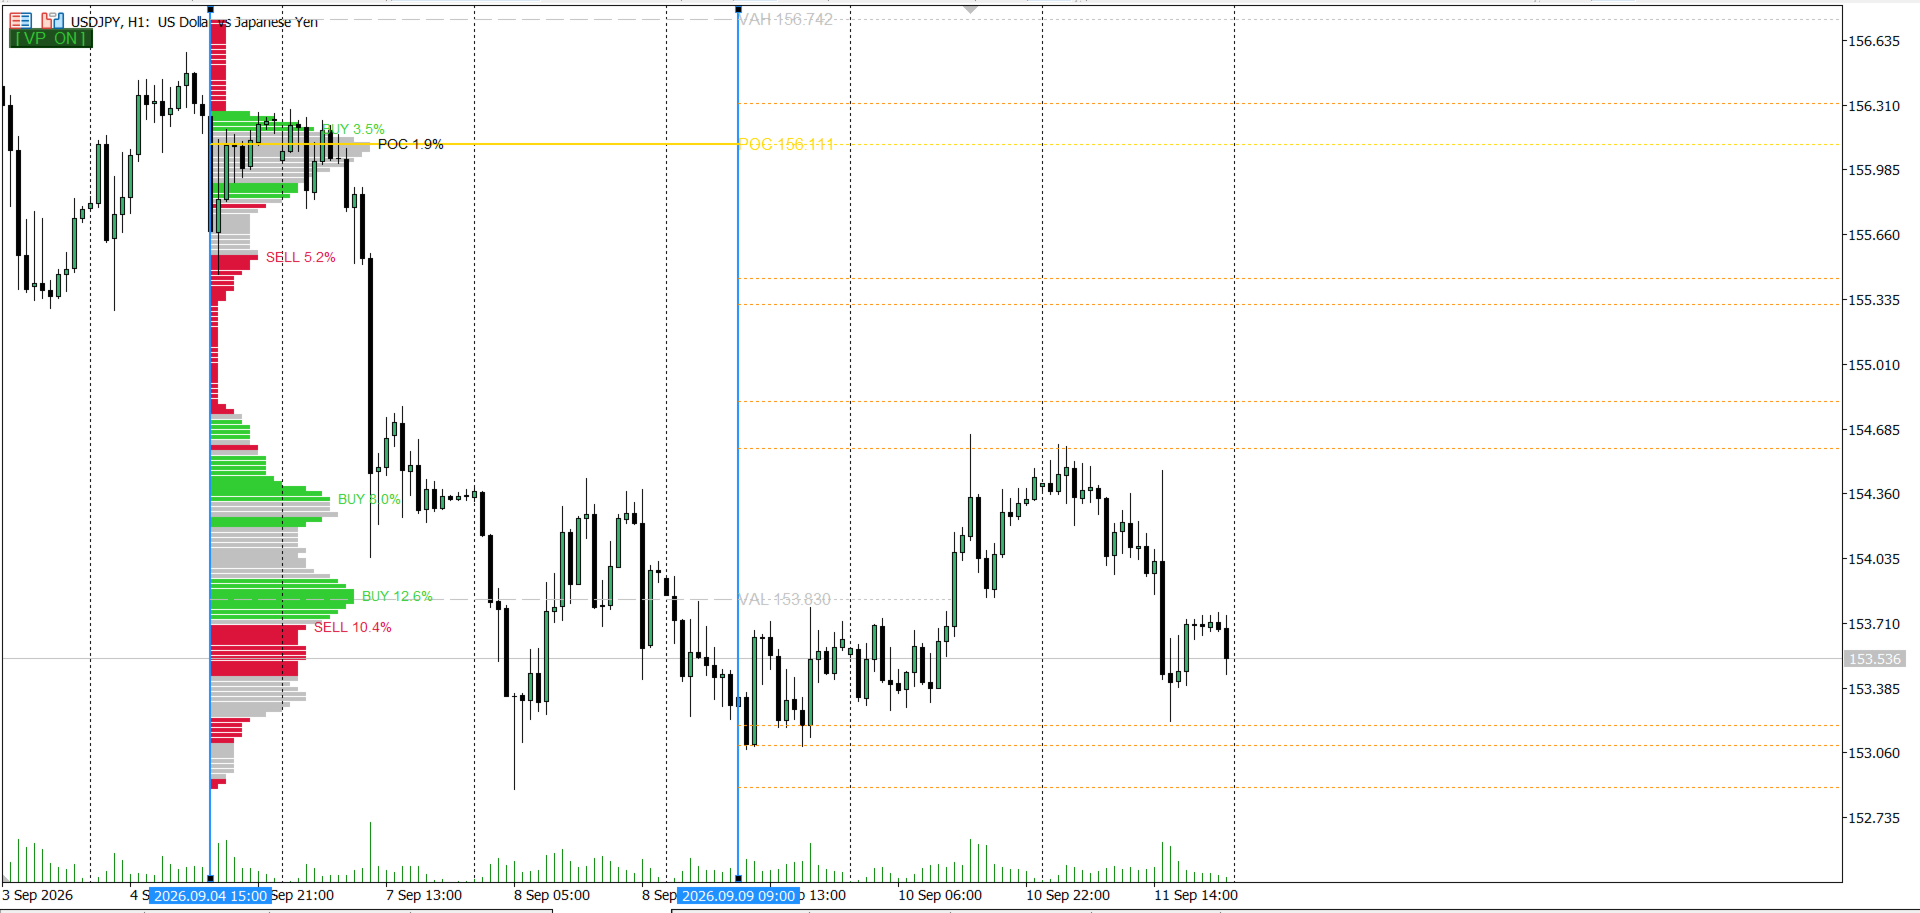
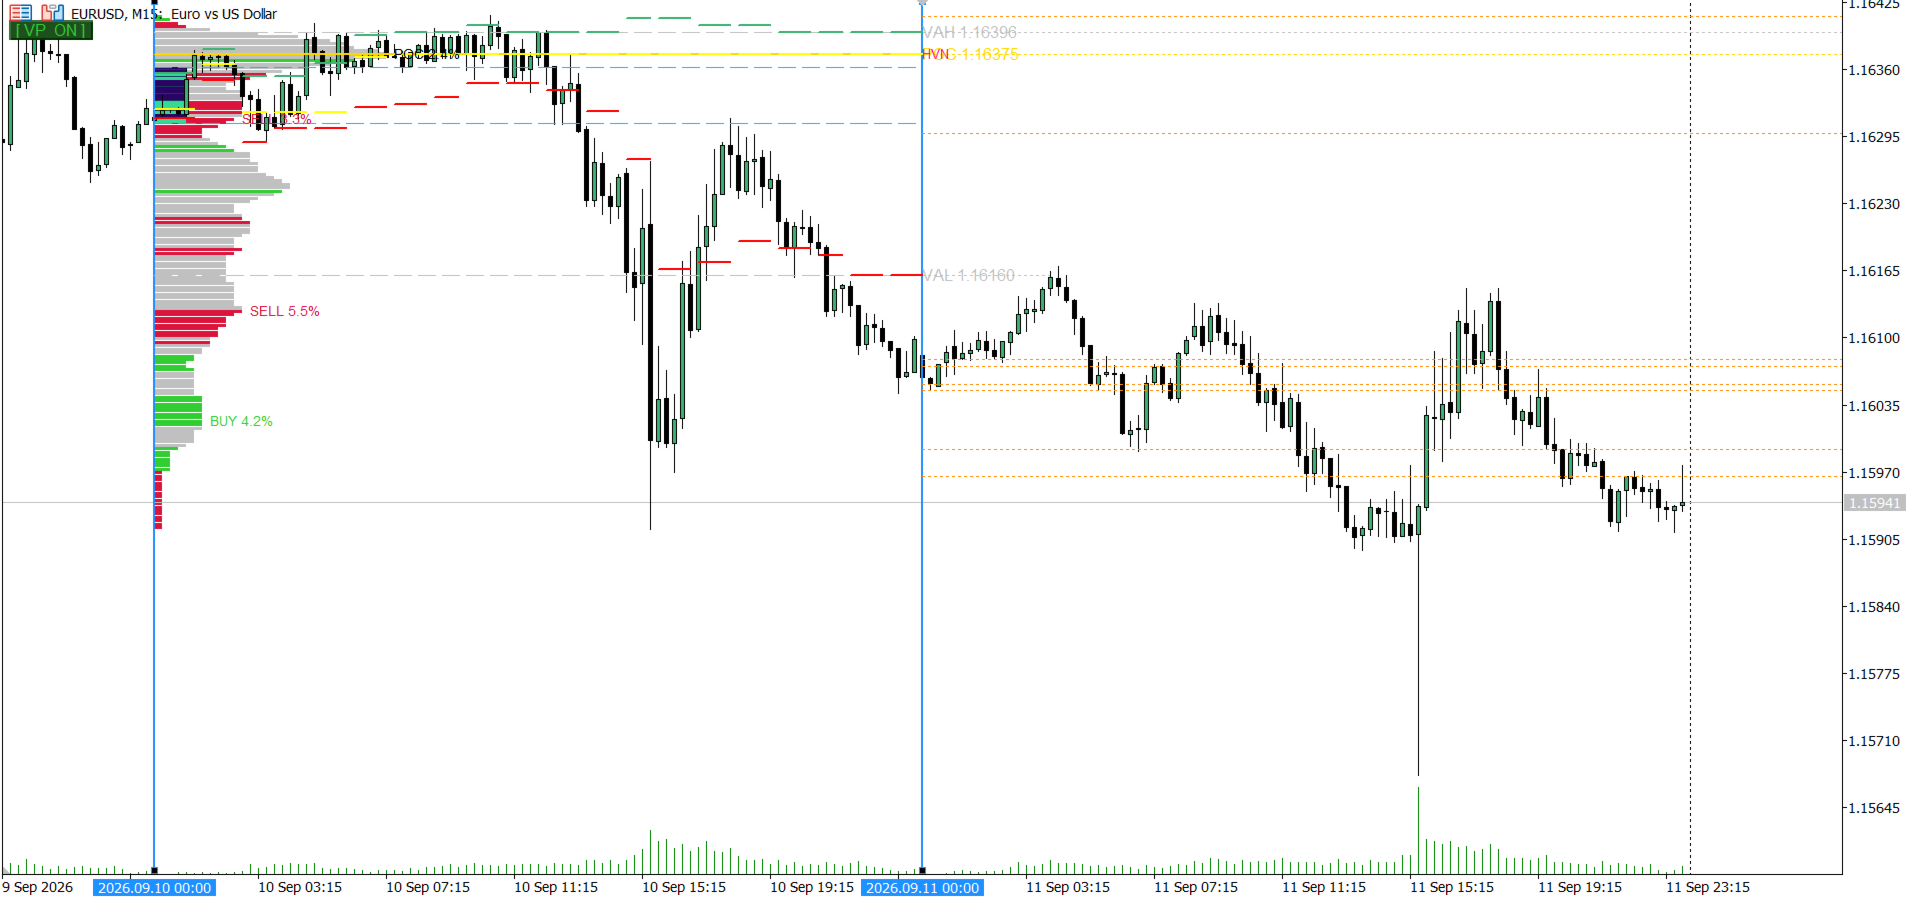
Drag two lines to any chart range for an instant Fixed-Range Volume Profile (POC, Value Area VAH/VAL) featuring Delta Coloring, Developing Profile tracking, Initial Balance, HVN/LVN, and Retest Rays.
Detailed Description
The Fixed-Range Volume Profile & Delta Analyzer answers a foundational market structure question: At which price did the most trading activity actually occur within a specific timeframe?
Simply drag the two vertical reference lines ( START and END ) anywhere on your chart to isolate any trading range—such as an intraday session, a consolidation phase, or a major news event. The indicator slices the selected area into price buckets and builds a precise horizontal volume histogram.
Designed for active traders who demand speed and accuracy, this tool features an incremental dual-layer calculation engine. It processes historical data smoothly without screen flicker, freezing, or lagging during volatile market conditions.
Key Technical Features & Capabilities
-
CME-Standard Value Area Calculation: Uses the official Market Profile "pair" comparison rule to expand from the Point of Control (POC), identifying true 70% value areas rather than relying on simplified approximations.
-
Delta Bias Overlay & Volume Share: Color-code histogram bars based on aggressive buyer vs. seller volume bias. Contiguous order-flow zones are grouped automatically, showing consolidated percentage shares at key volume peaks.
-
Developing Profile Tracking: Step the POC, VAH, and VAL forward chronologically across the dragged range to observe how fair value shifted over time.
-
Initial Balance (IB) Display: Highlights the high/low range of the initial session minutes (e.g., first 30 or 60 minutes) to monitor institutional auction expansions.
-
High & Low Volume Nodes (HVN / LVN): Automatically detects market acceptance (HVN) and rejection/liquidity gaps (LVN), projecting LVN support/resistance levels forward.
-
Naked / Virgin Level Projection: Projects historical POC, VAH, and VAL levels to the right until a future bar trades through (retests) them.
-
Optimized Performance: Adaptive coarsening handles ranges beyond 5,000 bars easily while retaining exact volume totals.
-
Intrabar Live Updates: Keeps tracking volume live when the END boundary is snapped to the current forming bar.
Practical Use Cases
-
Auction Market Theory Trading: Identify high-volume fair-value zones (POC) where price tends to mean-revert, as well as low-volume rejection areas (LVNs) where price moves rapidly.
-
Breakout & Target Identification: Monitor VAH (Value Area High) and VAL (Value Area Low) boundaries to trade rejections back into value or catch high-momentum breakouts.
-
Session Structure Analysis: Use the Initial Balance (IB) lines alongside Developing POC tracking to evaluate early-session bias and institutional expansion.
Input Parameters & Customization
-
Instance Tag: Assign a unique tag when running multiple copies on the same chart to keep individual profiles independent.
-
Histogram Styling: Choose between Filled, Outline, or Dot-Line styles with customizable colors, widths, and bucket counts (50 to 300+).
-
Min Bucket Pixel Height: Automatically adjusts bucket density so histogram rows render clearly on high-resolution screens without visual blurring.
-
Interactive Controls: Toggle the entire display with a single click using the on-chart [VP ON/OFF] button, or click the gold POC line directly to show/hide VAH/VAL boundaries.
Important Disclaimer & Development Notice
THIS PRODUCT IS CURRENTLY UNDER ACTIVE DEVELOPMENT.
-
Use At Your Own Risk: This software is provided "as-is" for informational, educational, and analytical purposes only. It does not constitute financial, investment, or trading advice.
-
Software State: Because this tool is undergoing active development and continuous refinement, users may encounter minor visual bugs, unexpected behavior, or execution edge-cases under certain broker configurations or volatile market conditions.
-
No Trading Signals: This indicator is a visual reference tool. It does not generate automatic buy/sell signals, execute trades, or guarantee financial results.
-
Testing Recommended: Always test this software thoroughly on a Demo Account in your trading environment before using it alongside live capital. The developer accepts no liability for trading losses incurred through the use of this software.







































Really good tool. Highly recommended! Thanks!