PriceLevels
- 지표
- 버전: 1.10
- 활성화: 5

NOTE:
DONT BUY THIS PRODUCT, THIS IS INDICATOR IS ALREADY AVAILABLE FOR FREE YOU CAN CHECK IT WITH NAME - PRICE LEVELS LTF
BUY ONLY IF YOU LIKE THE OTHER INDICATORS AND WANT TO SUPPORT US!!!
IF YOU DONT LIKE THE INDICATOR PLEASE LEAVE A COMMNET ON THAT SO THAT OTHERS WILL NOT WASTE TIME ON THAT INDICATOR
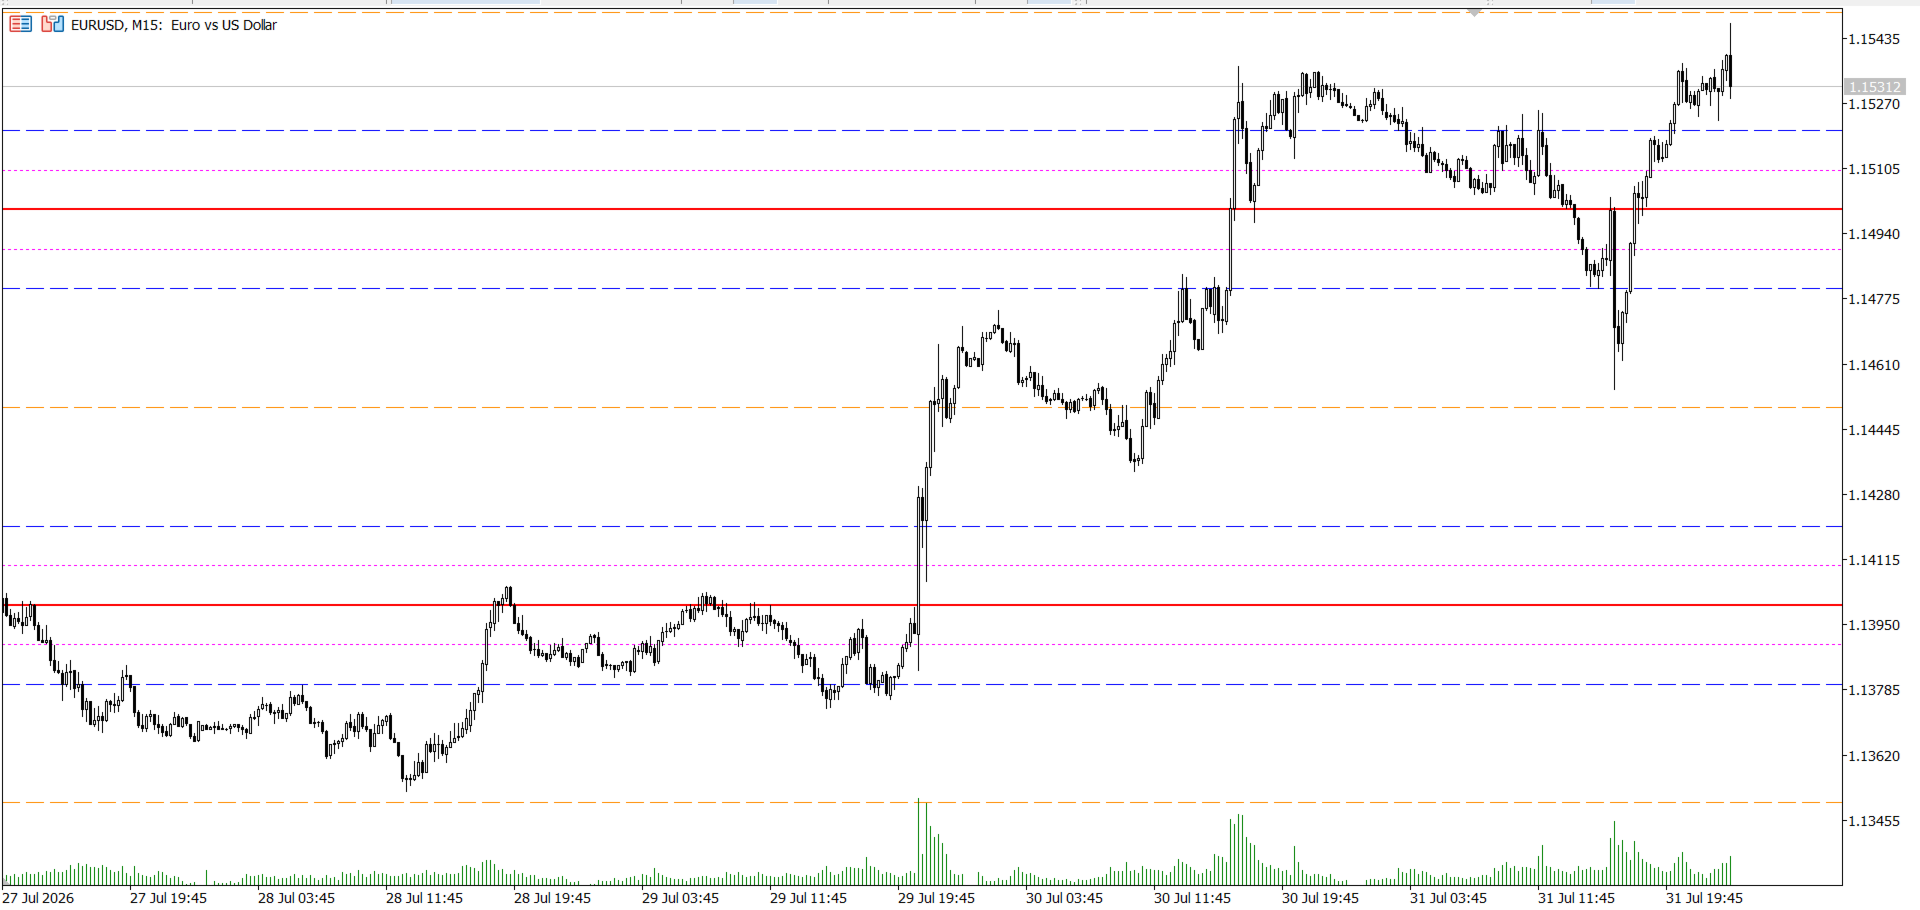
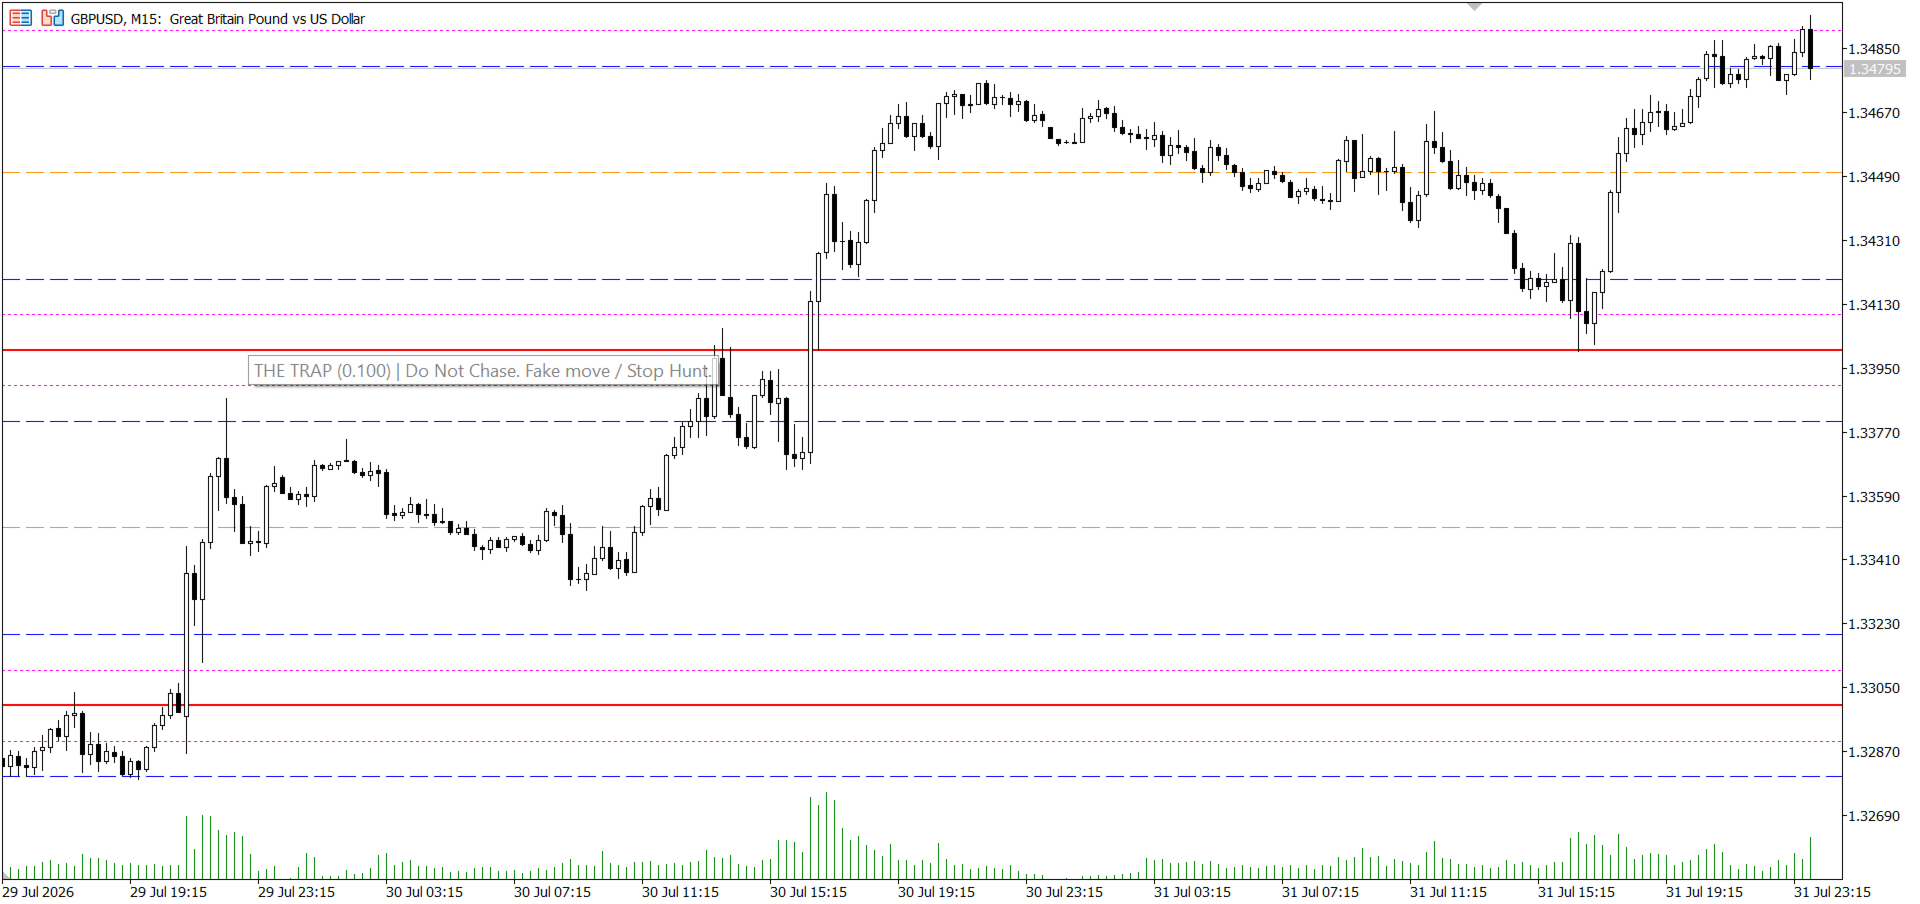
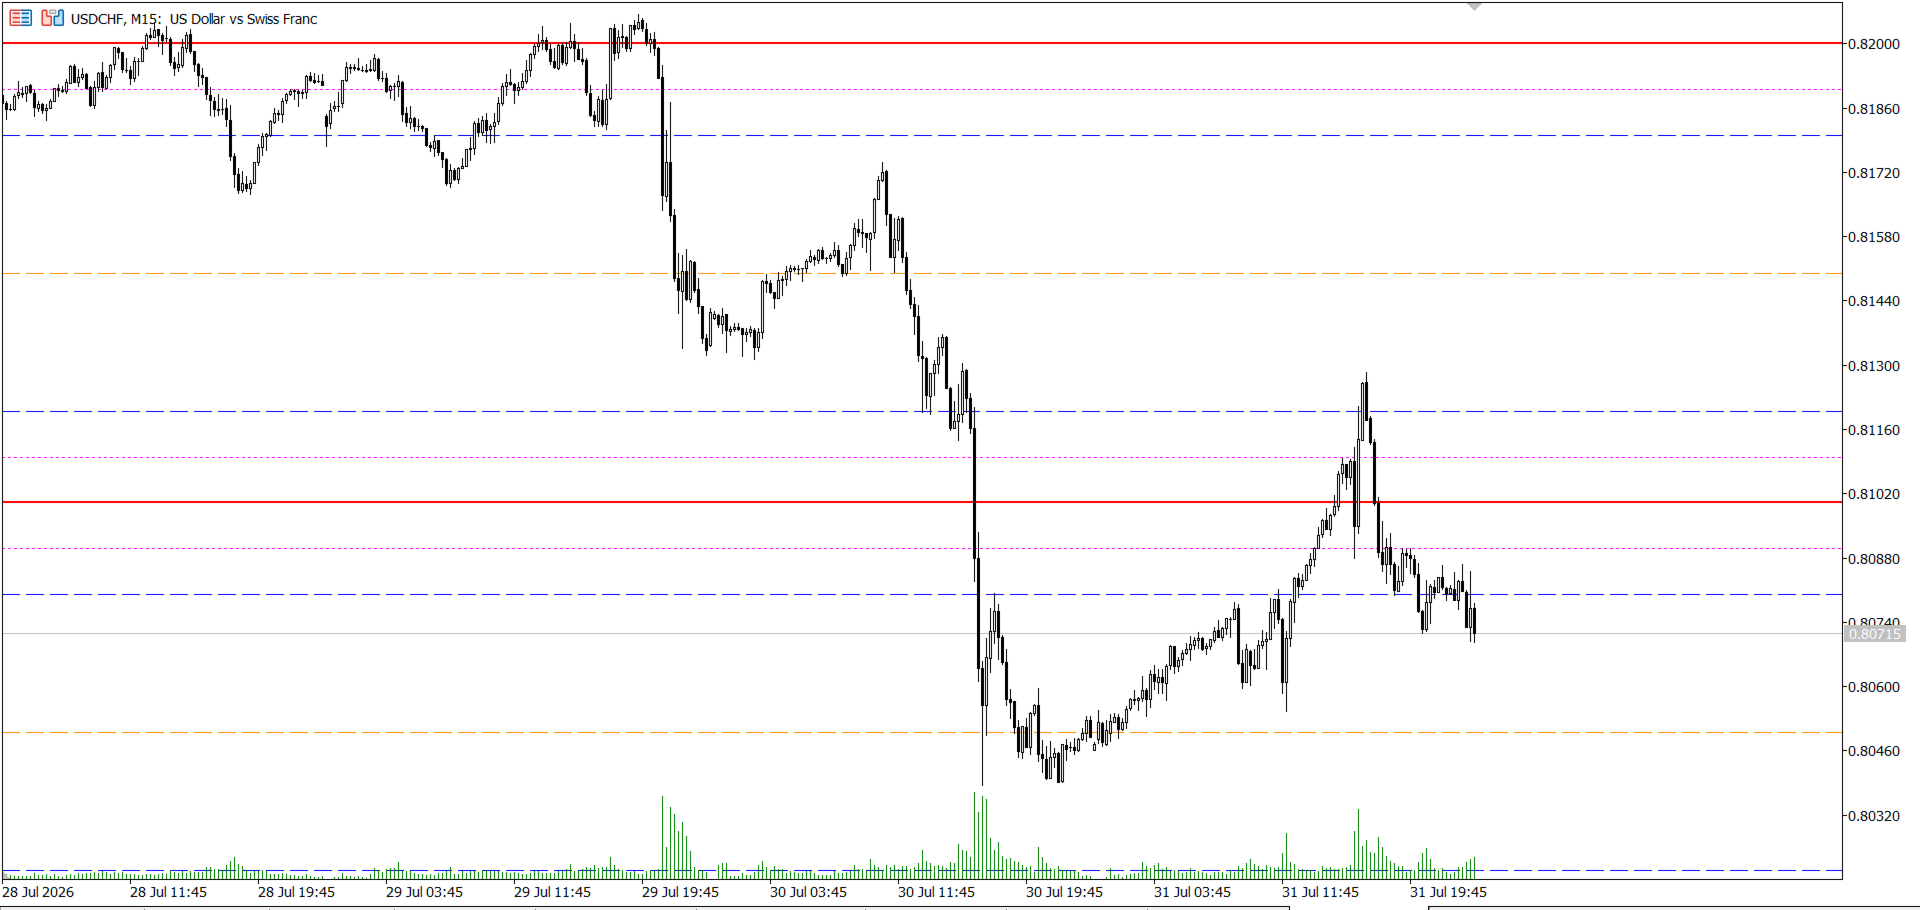
This indicator draws horizontal reference lines at fixed 100-pip intervals, based on the classic idea that round numbers (.000, .500) and near-round numbers (.100/.900, .200/.800) tend to act as psychological support/resistance zones where retail stop hunts, liquidity grabs, and reactions commonly cluster.
Each level is labeled with its role so you can read the chart at a glance:
- .000 — The Wall: major round number, often a zone of rejection.
- .200 / .800 — The Hot Zone: a common area to watch for entry confirmation via price action or volume signals.
- .500 — The Exit: mid-level, often used as a partial take-profit reference.
- .100 / .900 — The Trap: a level prone to fakeouts and stop hunts — a caution zone rather than an entry signal.
- Optional minor grid lines at every remaining .X00 level for additional context.
Features
- Works on any symbol and mostly used on 15Min timeframe
- Automatically adapts to each symbol's digits/point value, so spacing is correct on 3, 4, and 5-digit pairs alike
- Lines update in place with no flicker or redraw lag
- Fully configurable color, style, and width per zone type
- Optional minor grid for finer-grained round-number levels
- Lightweight: no DLL calls, no external dependencies
Inputs
- LookbackPips — how many pips above/below the current price to draw
- Per-zone color / line style / line width settings for Wall, Hot Zone, Exit, and Trap
- ShowMinorGrid — toggle minor round-number levels on/off, with independent styling
How to use
This tool is a visual reference only — it does not generate trade signals. Many traders use round-number zones alongside price action, volume, or market structure analysis to judge where reactions are more likely. Combine with your own confirmation method rather than trading the levels blindly.
What each tool does
Institutional_M15_Custom plots key round-number price levels directly on the chart — the Wall (.00), Hot Zone (.20/.80), Exit (.50), and Trap (.10/.90) — using standard Forex broker pip conventions (auto-adjusting for 3/5-digit pricing). Because these levels are built from broker-standard pip spacing rather than any single pair's quirks, the grid works identically across all major Forex pairs — EUR/USD, GBP/USD, USD/JPY, USD/CHF, AUD/USD, USD/CAD, NZD/USD — without any manual recalibration.
VolumeZoneAnalyzer lets you mark any zone on the chart with two draggable lines and instantly computes buy/sell volume delta, spread character (wide vs. narrow), and a rule-based Volume Spread Analysis (VSA) read — climax, absorption, accumulation/distribution, or trend confirmation. Because it works off relative volume and spread behavior rather than pair-specific price levels, it applies the same way regardless of which major pair you're trading.
The strategy: Level + Confirmation
The logic is simple: the price grid tells you where a reaction is likely; the volume analyzer tells you whether that reaction is real. Used together, one tool's blind spot is covered by the other — the grid has no volume context, and the volume tool has no fixed reference point without a level to anchor to.
Step 1 — Identify the level
Watch for price approaching a Wall (.00) or Hot Zone (.20/.80) level on any major pair, on your working timeframe. These are the two level types that qualify as entry candidates. Trap levels (.10/.90) are treated as caution zones, not entry zones.
Step 2 — Confirm with volume
As price touches the level, drag the VolumeZoneAnalyzer's start/end lines across the last several candles leading into and through the touch. Read the conclusion panel:
| VSA Read | Meaning | Action |
|---|---|---|
| Strong Bullish/Bearish pressure, aligned with the level reaction | Volume confirms the move | Trade the reaction |
| Hidden Strength / Hidden Weakness (absorption) | Institutional buying/selling against apparent price direction | Trade the reaction — often the higher-quality signal |
| Balanced / Mixed Signals | No conviction either way | Stand aside |
| Climax against the expected direction | Move into the level is exhausted | Stand aside or fade |
Step 3 — Respect the Trap levels
If price is currently sitting on or just through a .10/.90 Trap level, treat any volume signal with extra caution — this is the classic stop-hunt zone. Wait for price to clear the trap before acting on a confirmation read.
Step 4 — Manage the trade
Enter on the confirming candle's close or on a retest of the level. Place your stop just beyond the level. Use the next level in sequence (Hot Zone → Exit → next Wall) as your target, giving a natural framework for 1:2+ reward-to-risk trades.
Why this generalizes across pairs
Both tools are built on universal Forex mechanics rather than pair-specific tuning: standard pip conventions for the levels, and relative volume/spread behavior for the VSA read. This means the same rules — level first, volume second, trap-aware always — apply whether you're trading EUR/USD in the London session or USD/JPY in the Tokyo session, with no re-optimization needed per pair.
Risk note
Both tools are analytical aids, not automated signal generators. Volume figures in Forex are derived from tick volume as a proxy (no centralized market tape exists for spot Forex), so treat VSA reads as directional pressure estimates rather than certainty. Always combine with sound risk management and your own trade plan.
Disclaimer
This indicator is provided for informational and educational purposes only. It does not constitute financial advice, and past price behavior at these levels is not indicative of future results. Trading involves risk of loss.